. 2022 Sep 15;206(6):712-729.
doi: 10.1164/rccm.202108-1901OC.

Increased SARS-CoV-2 Infection, Protease, and Inflammatory Responses in Chronic Obstructive Pulmonary Disease Primary Bronchial Epithelial Cells Defined with Single-Cell RNA Sequencing

Affiliations

Increased SARS-CoV-2 Infection, Protease, and Inflammatory Responses in Chronic Obstructive Pulmonary Disease Primary Bronchial Epithelial Cells Defined with Single-Cell RNA Sequencing

Matt D Johansen et al. Am J Respir Crit Care Med. .

Abstract

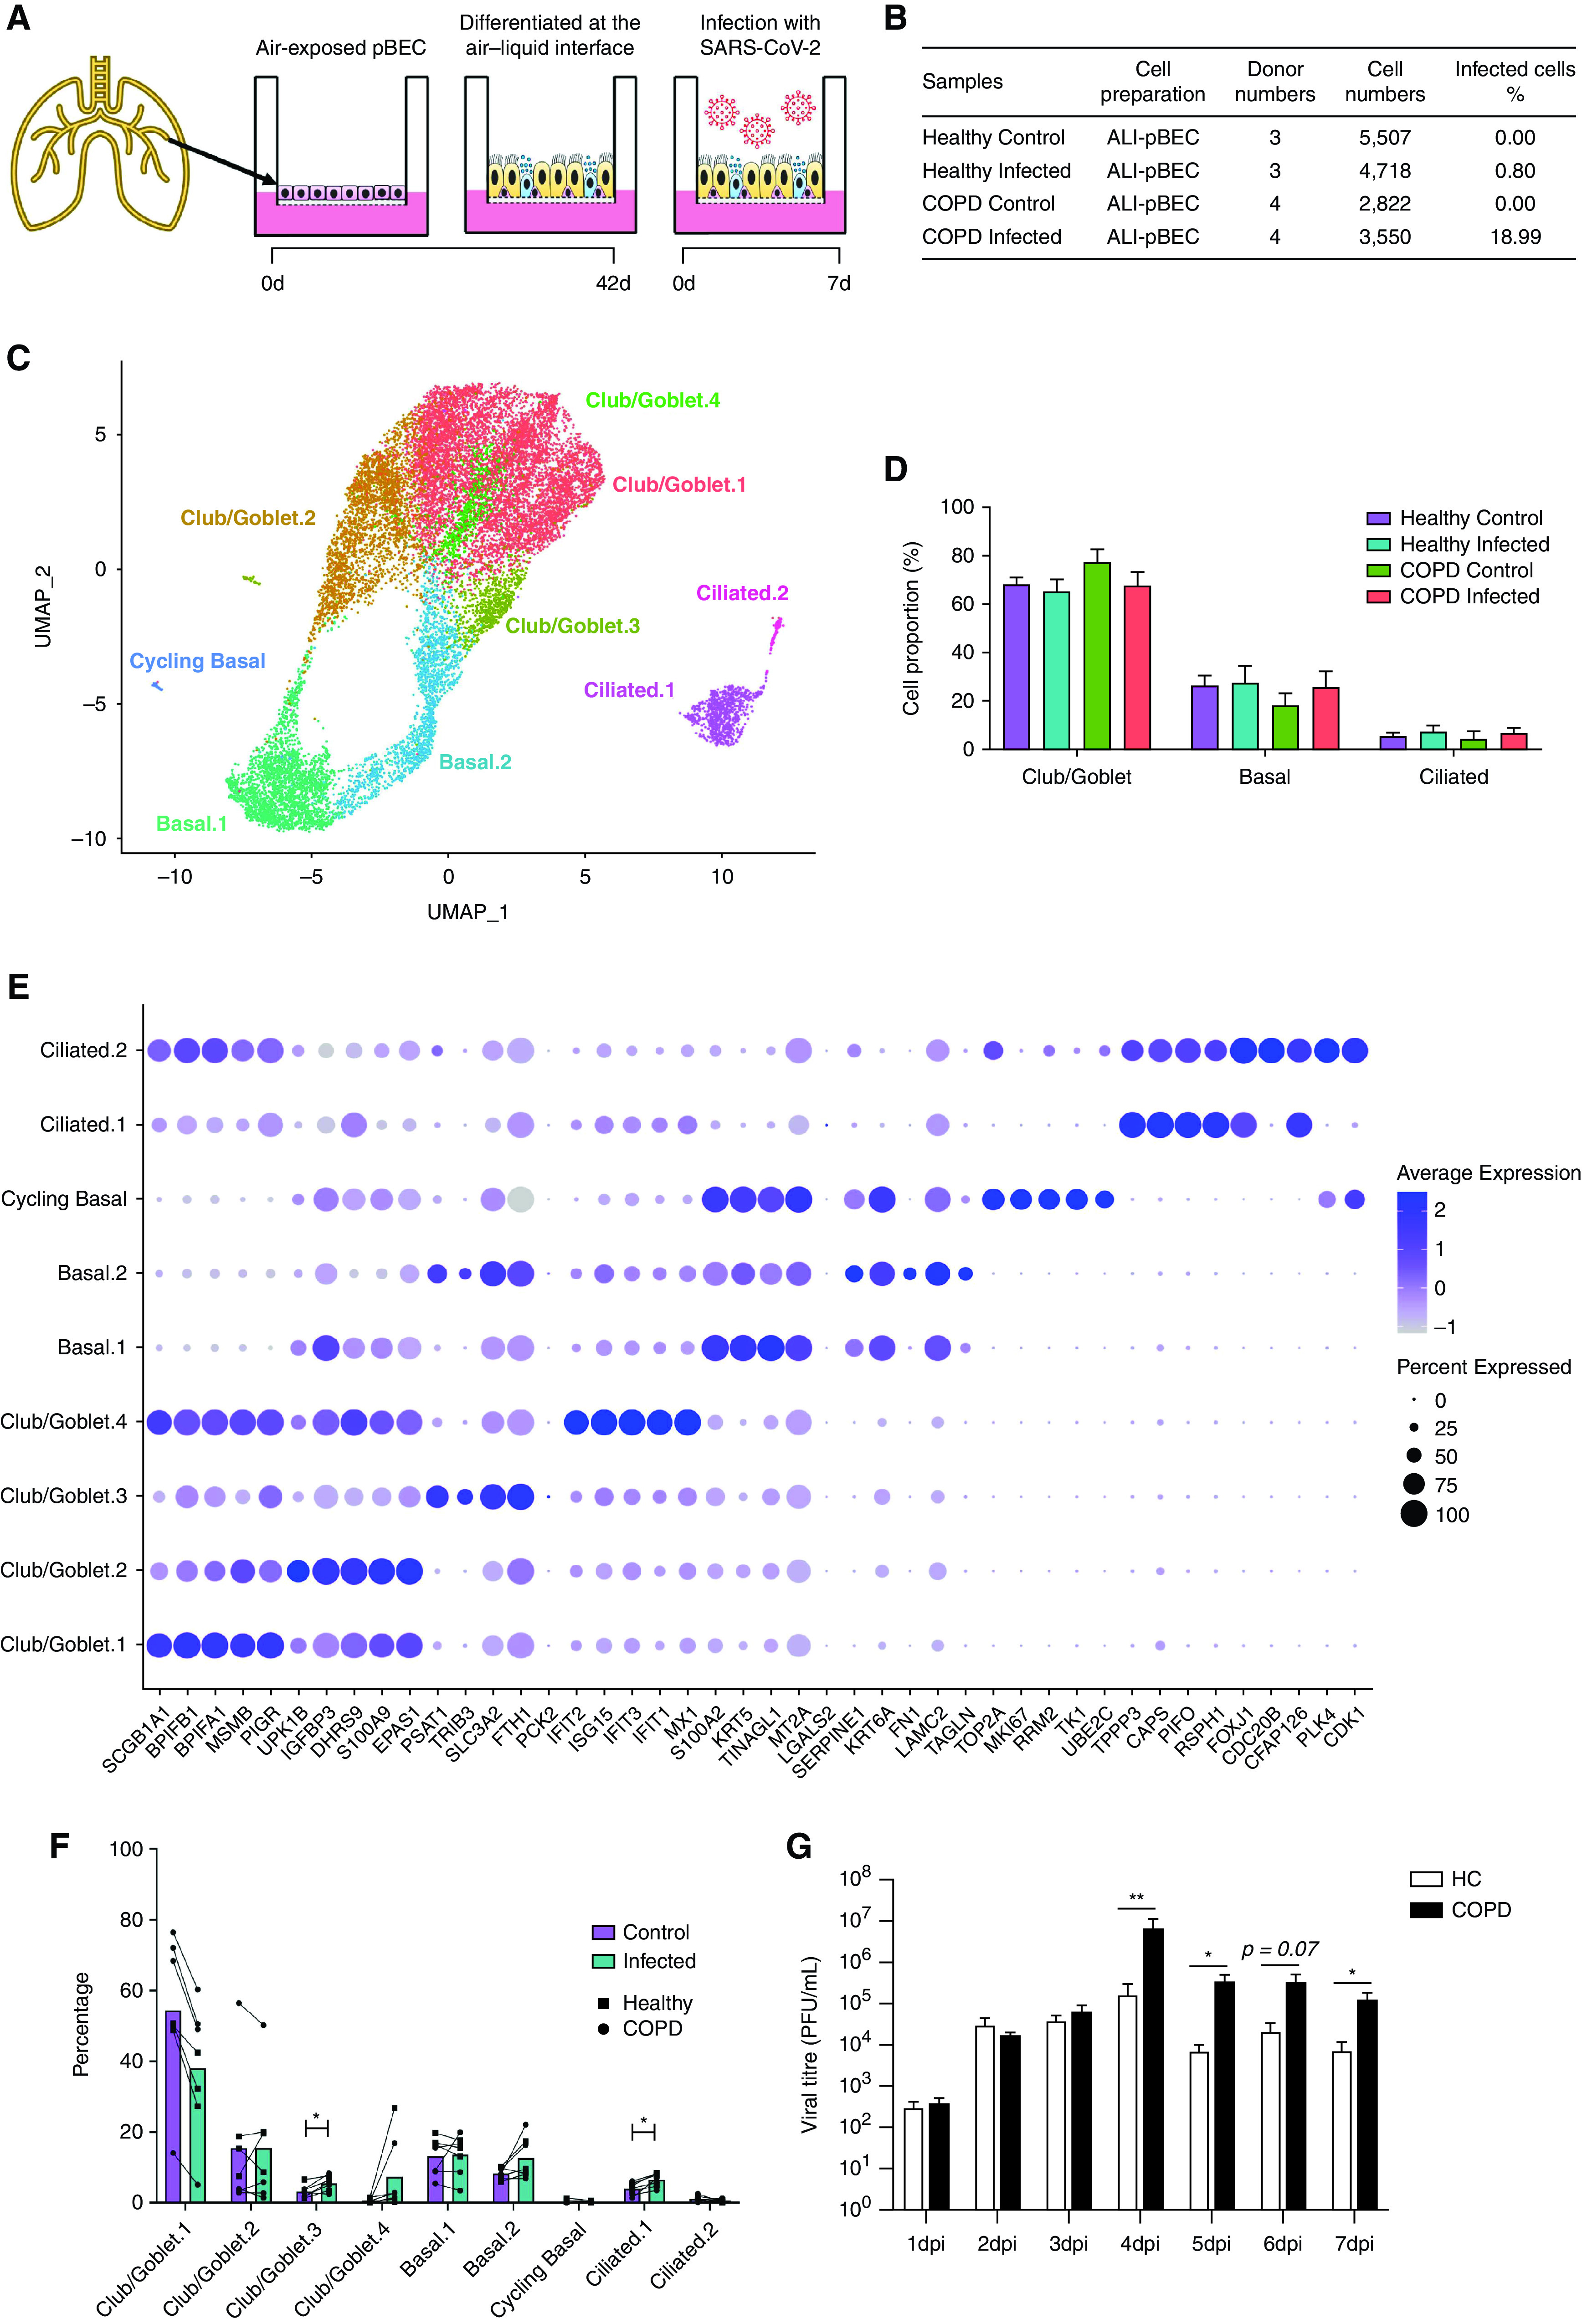
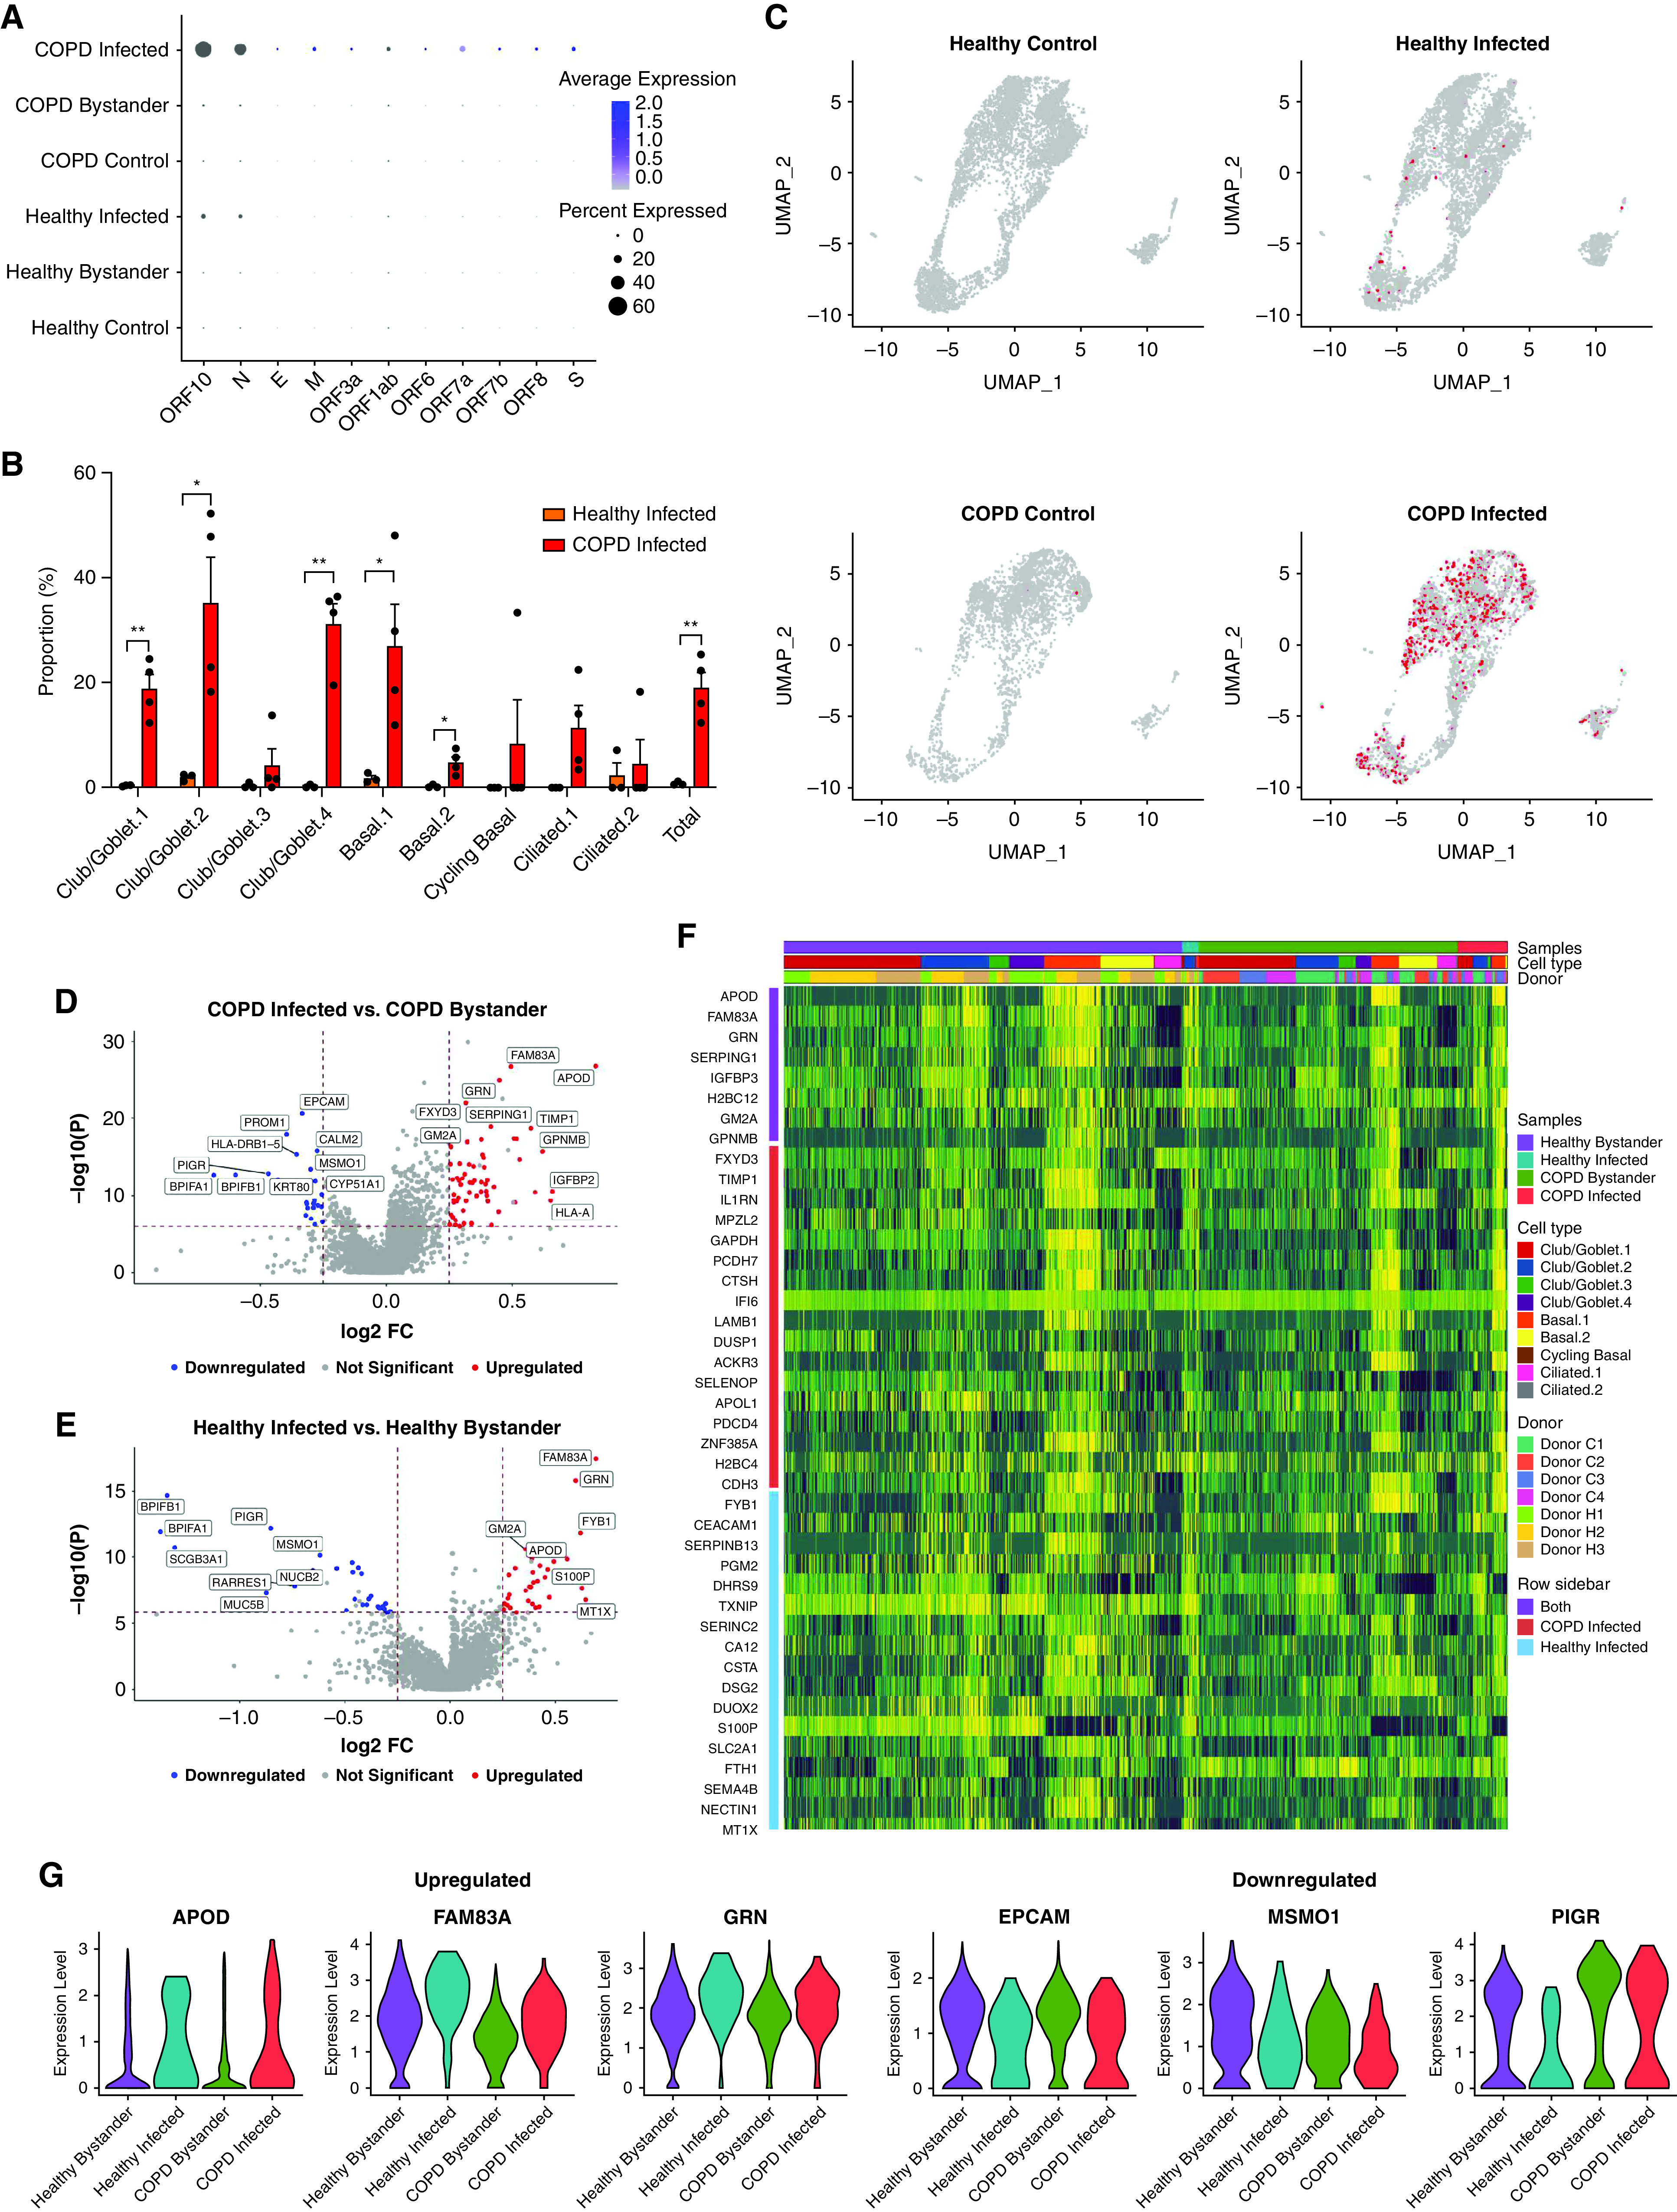
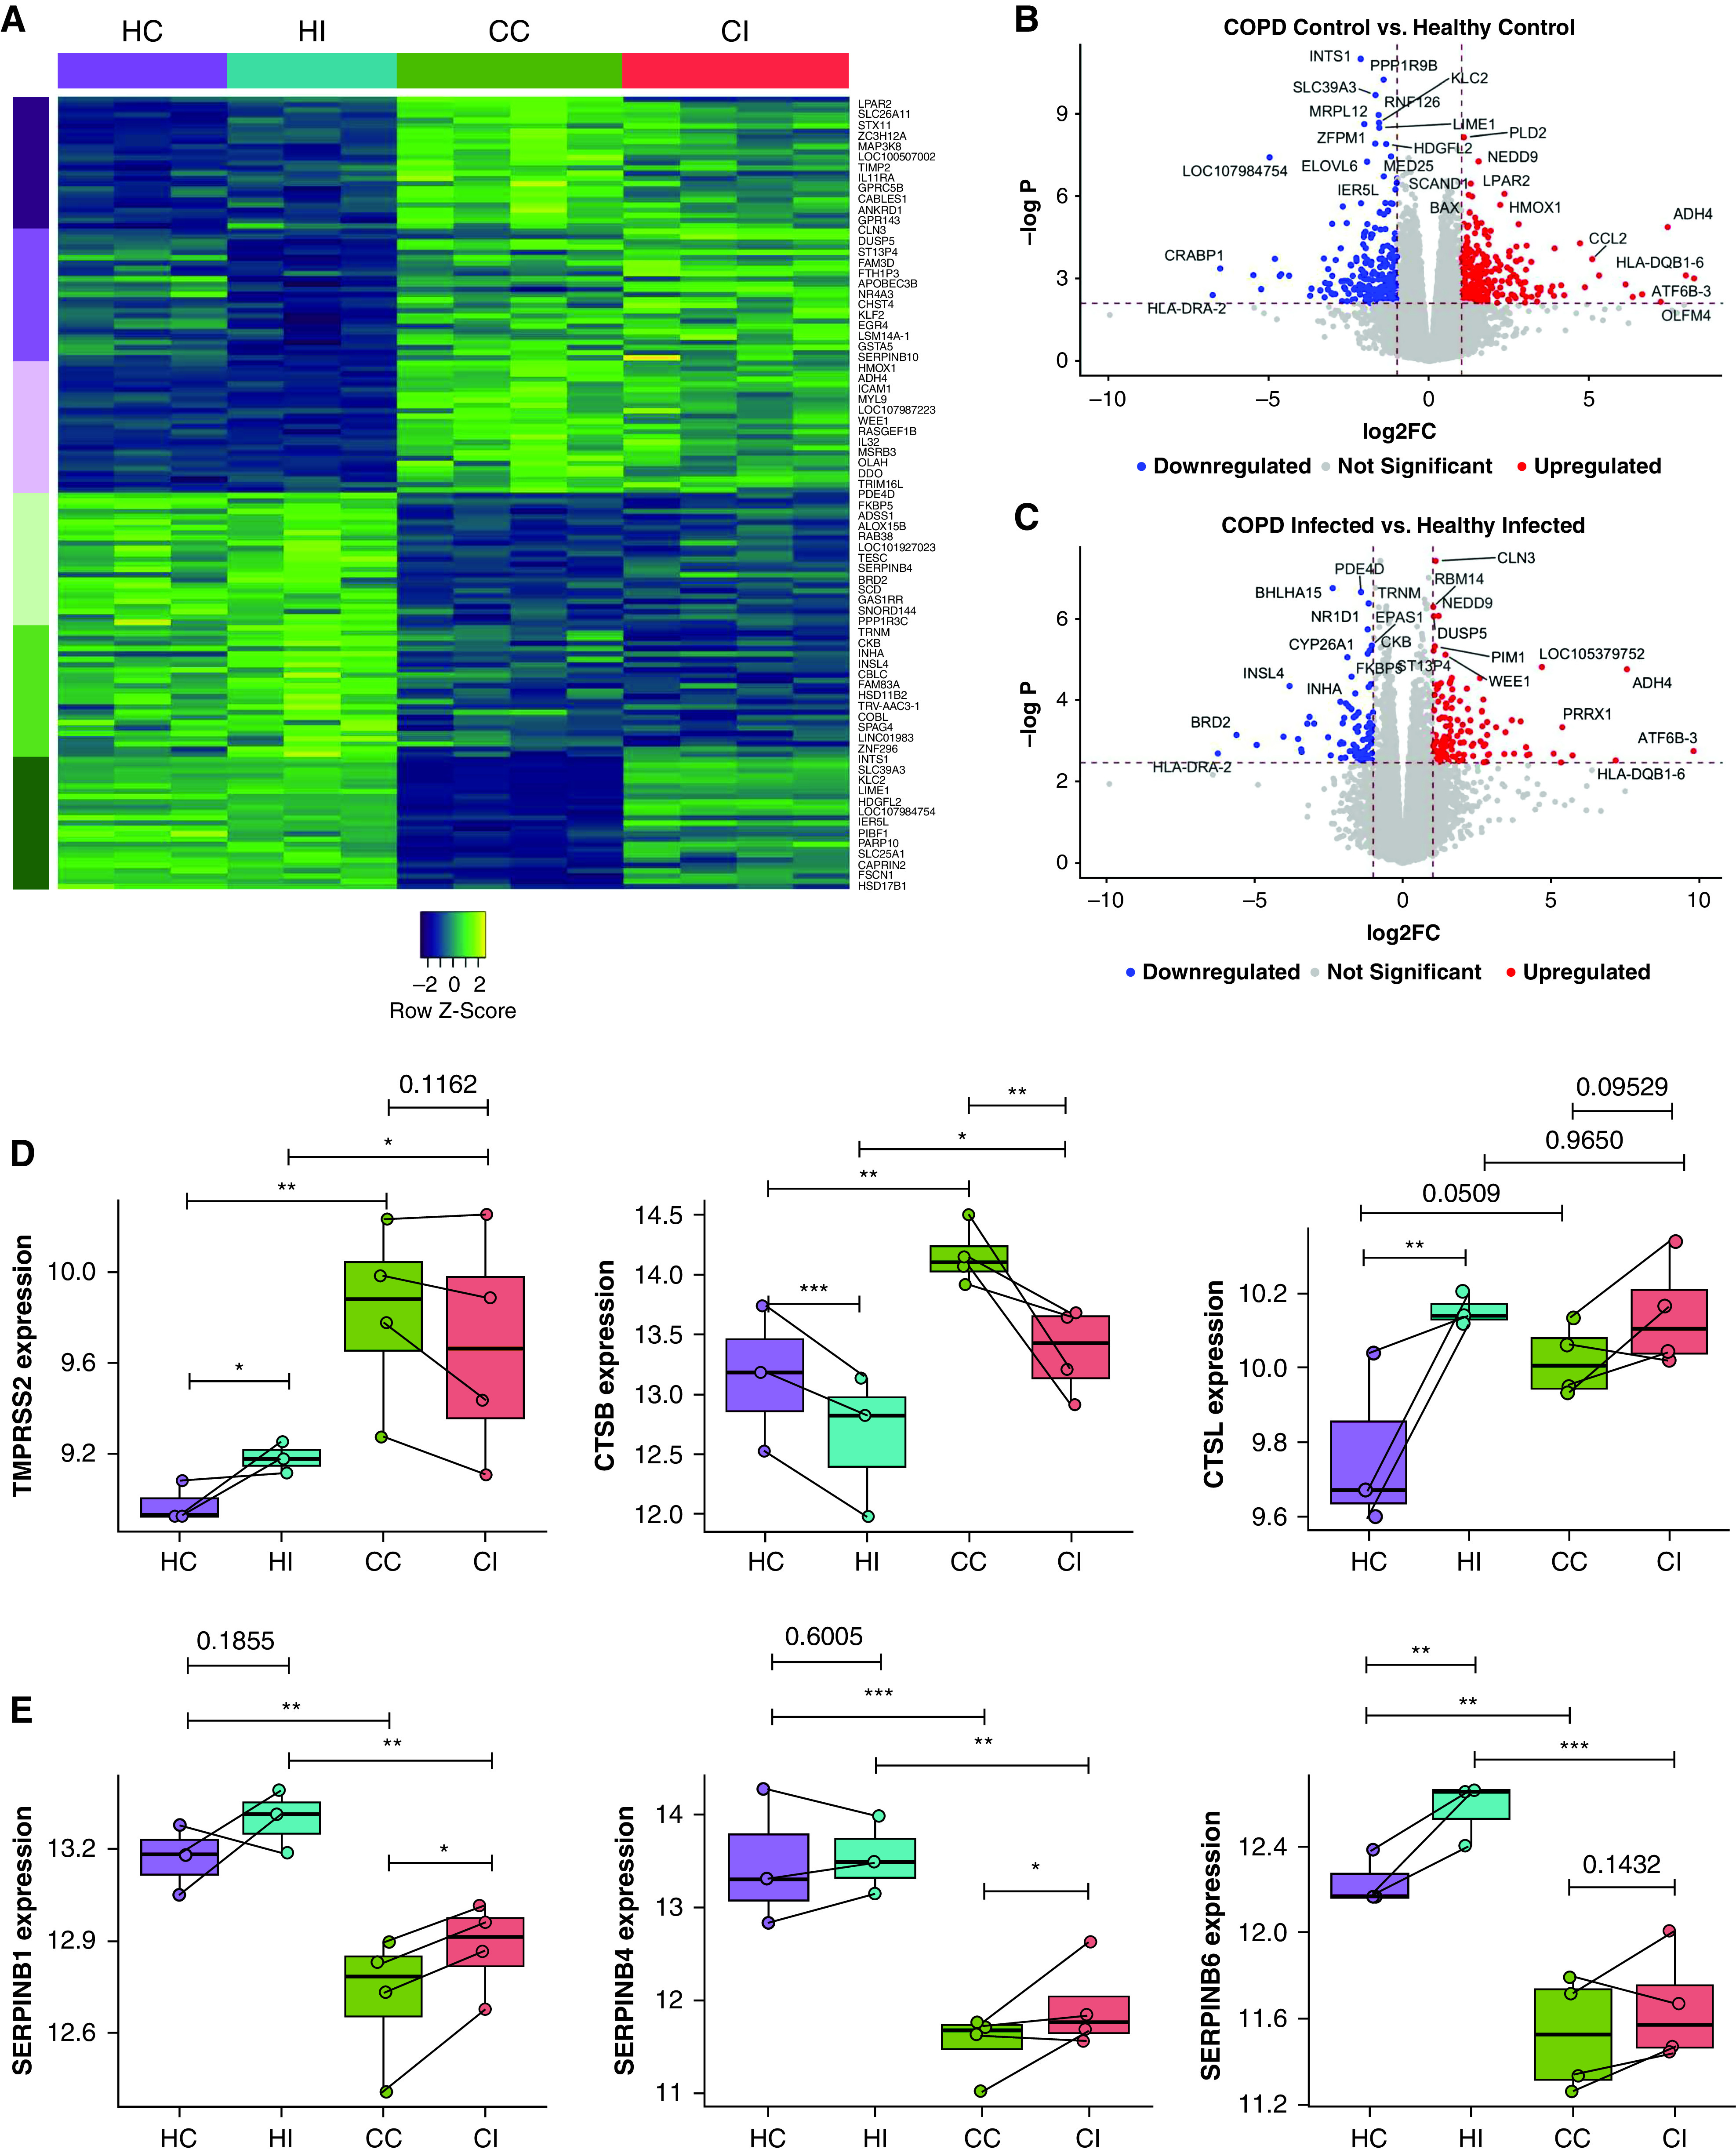
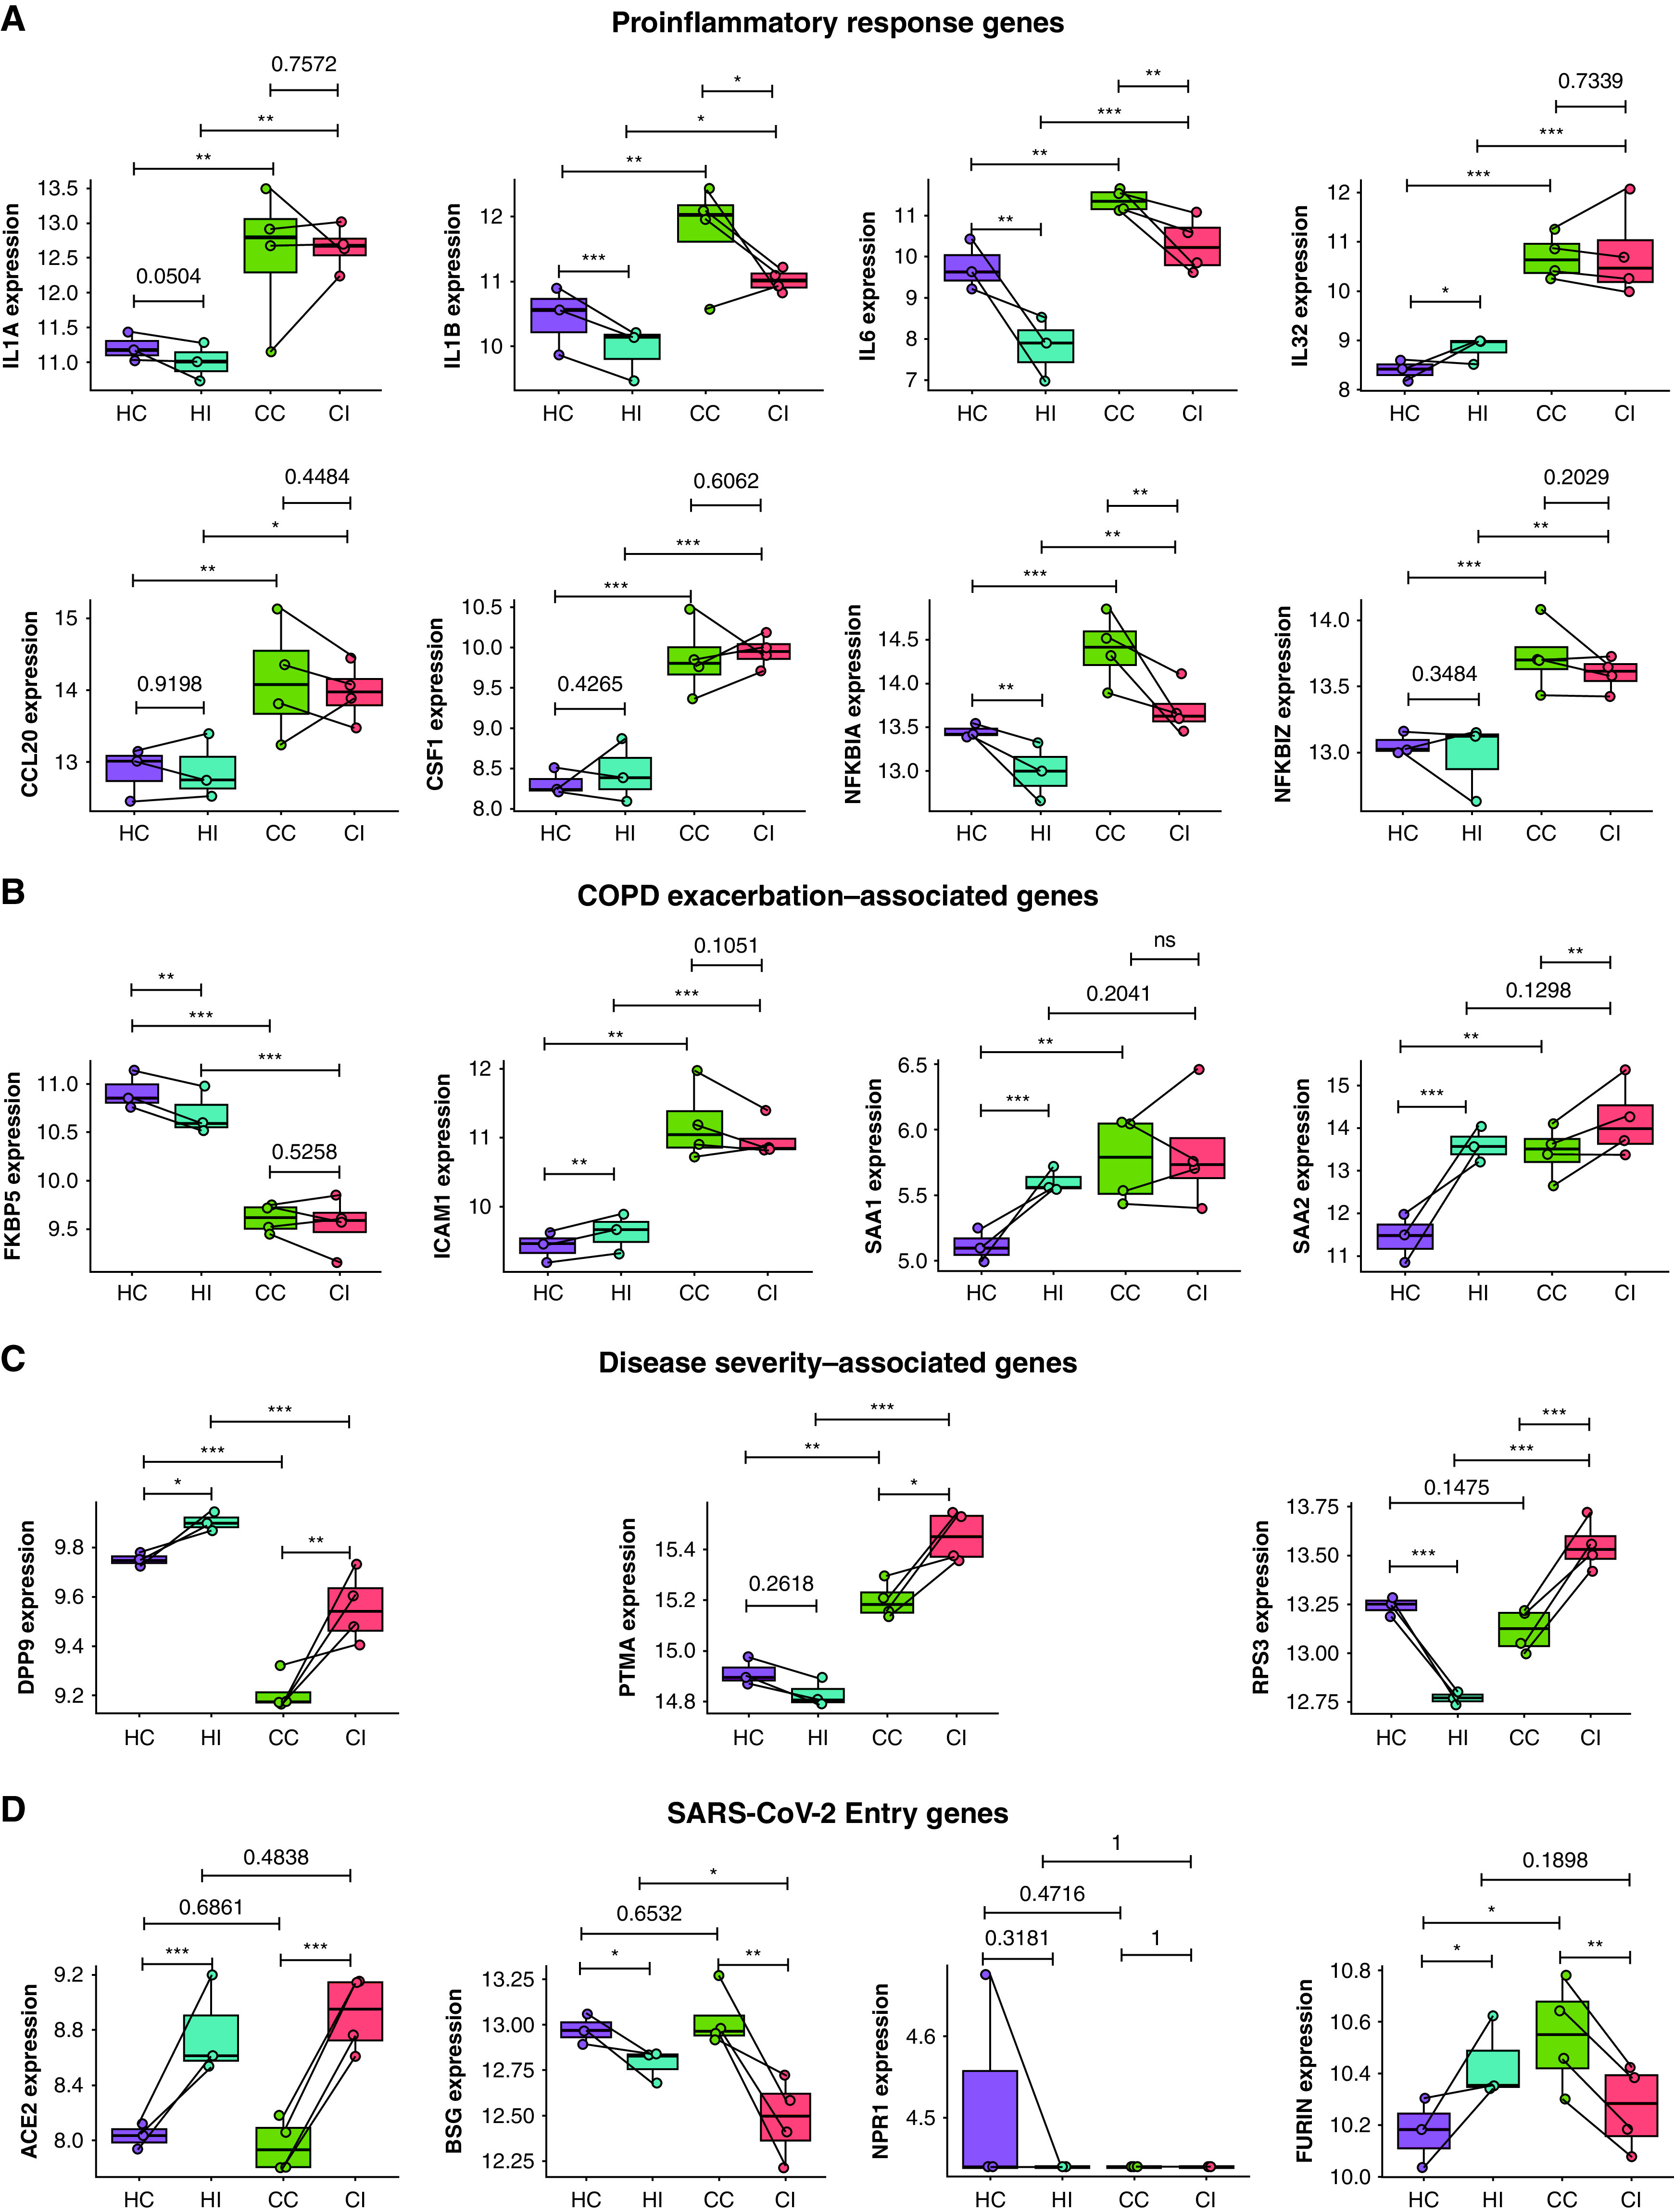
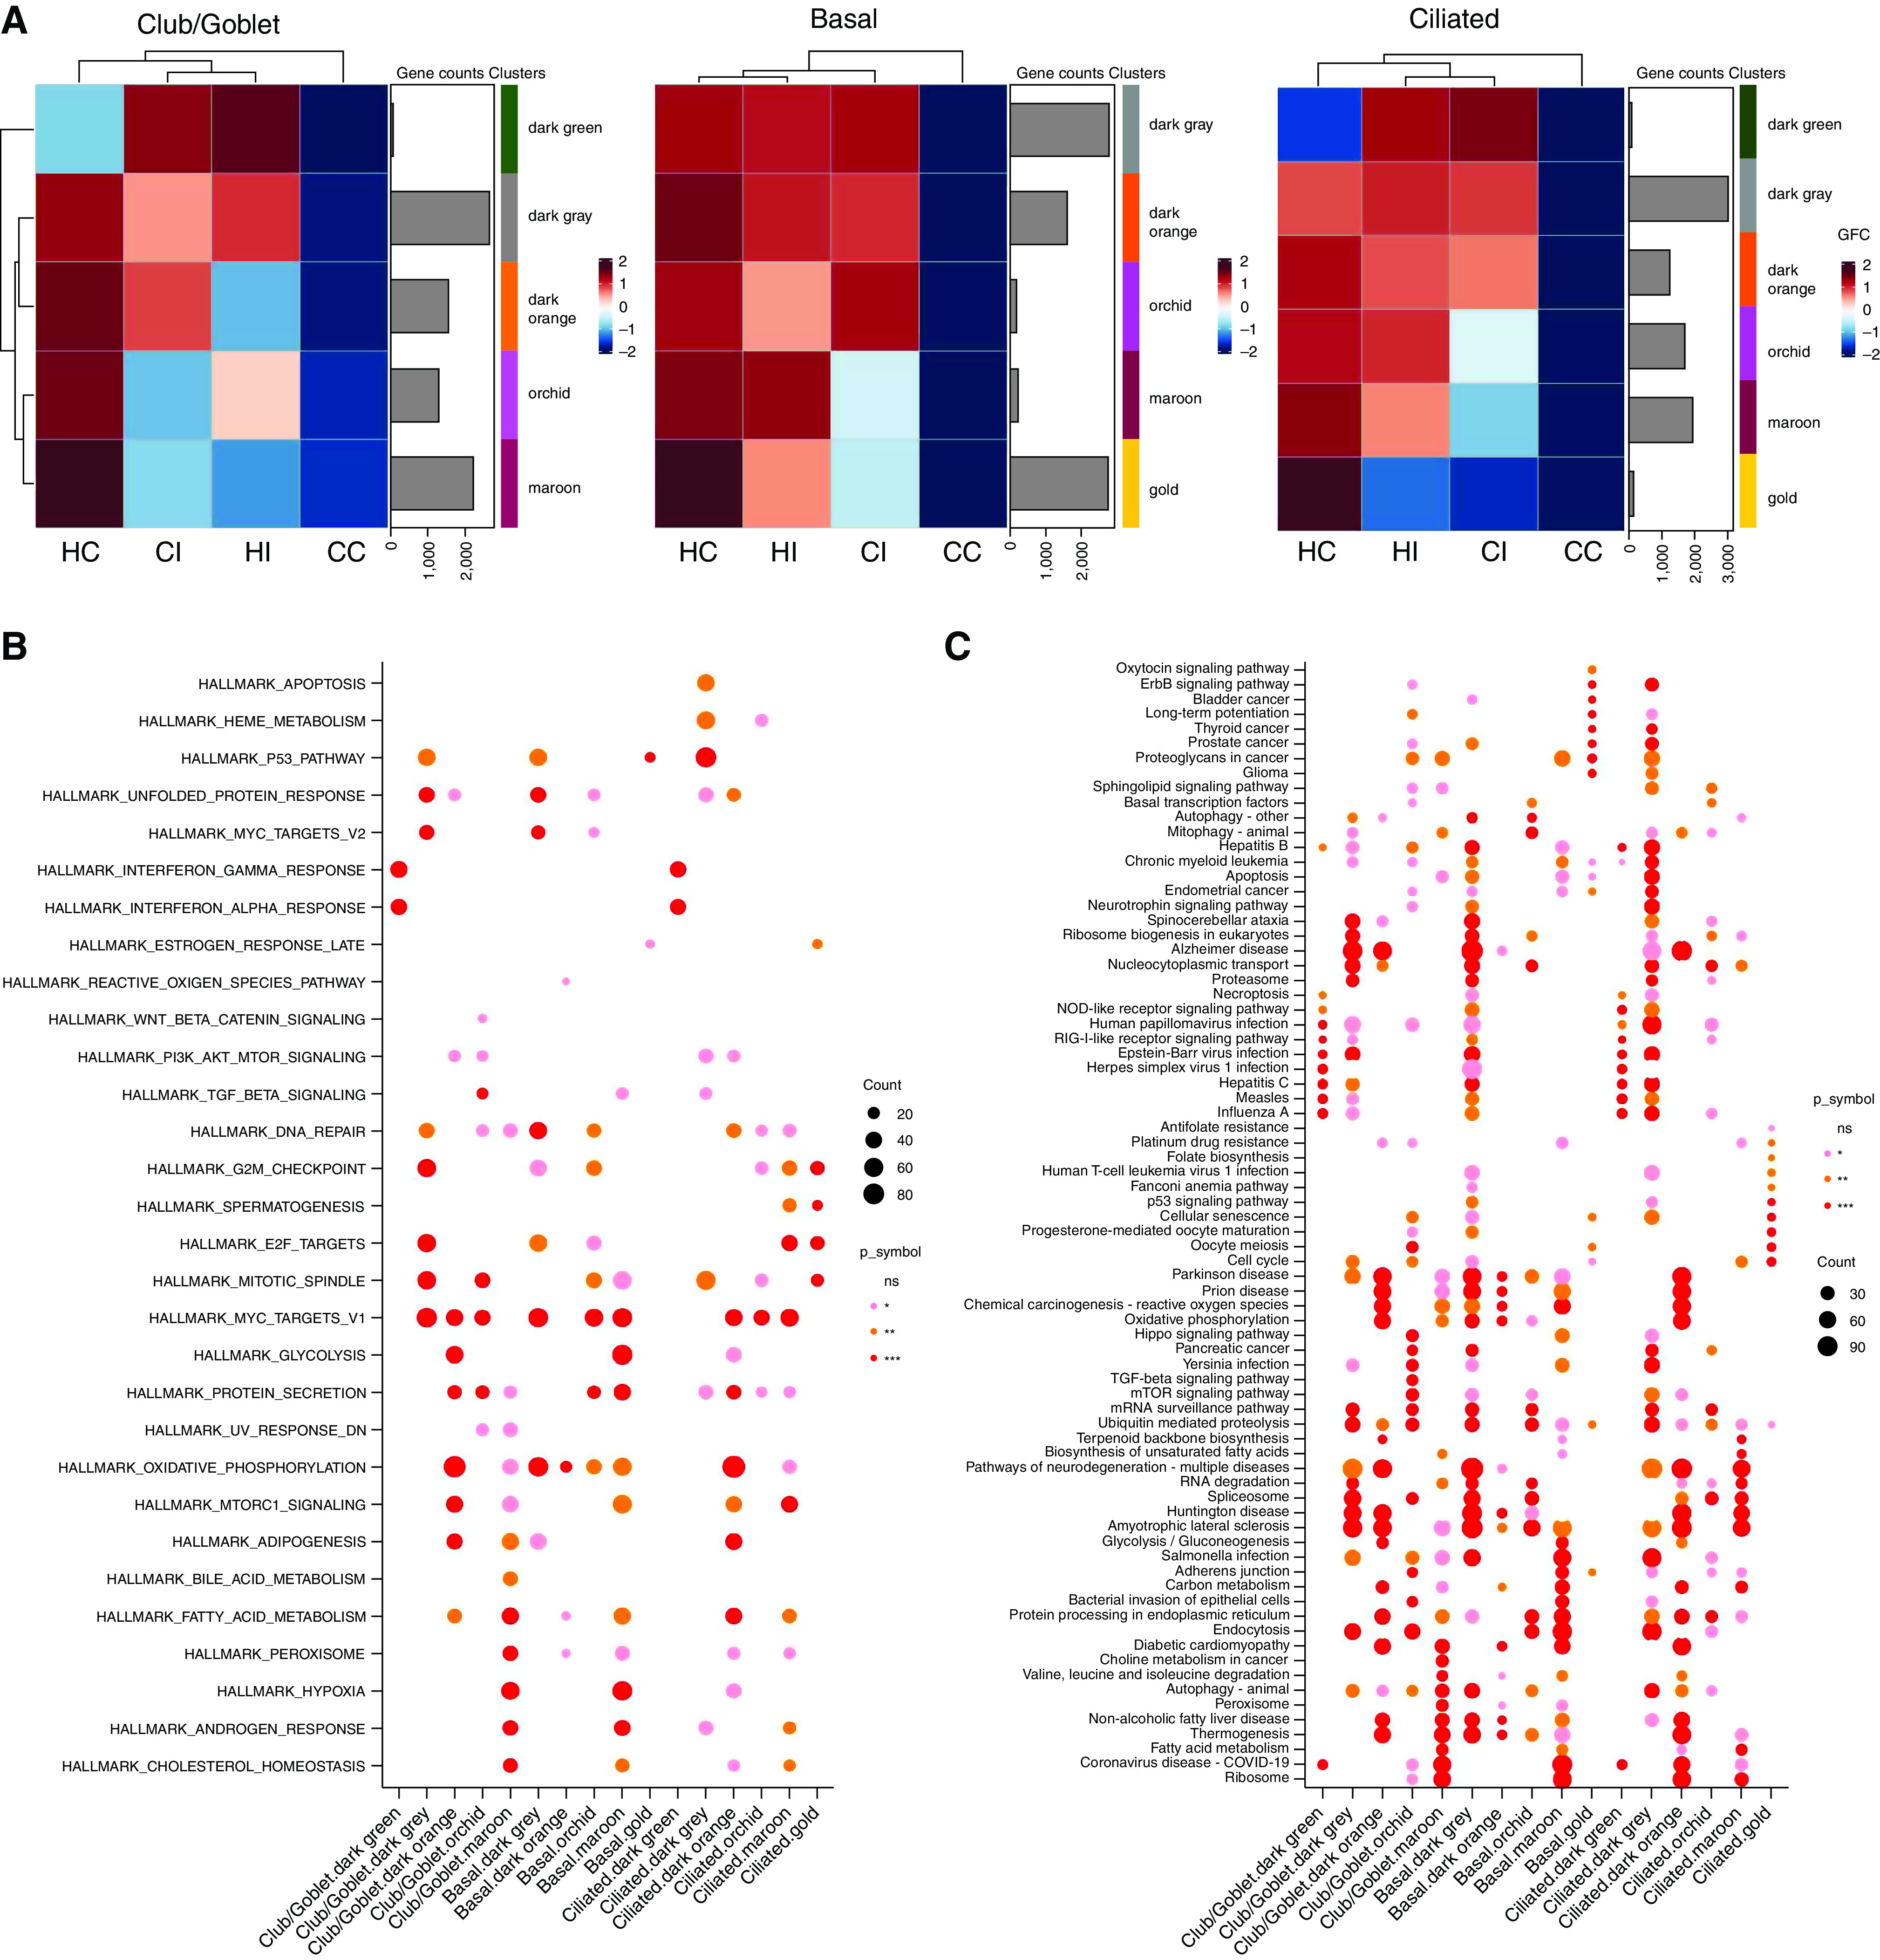
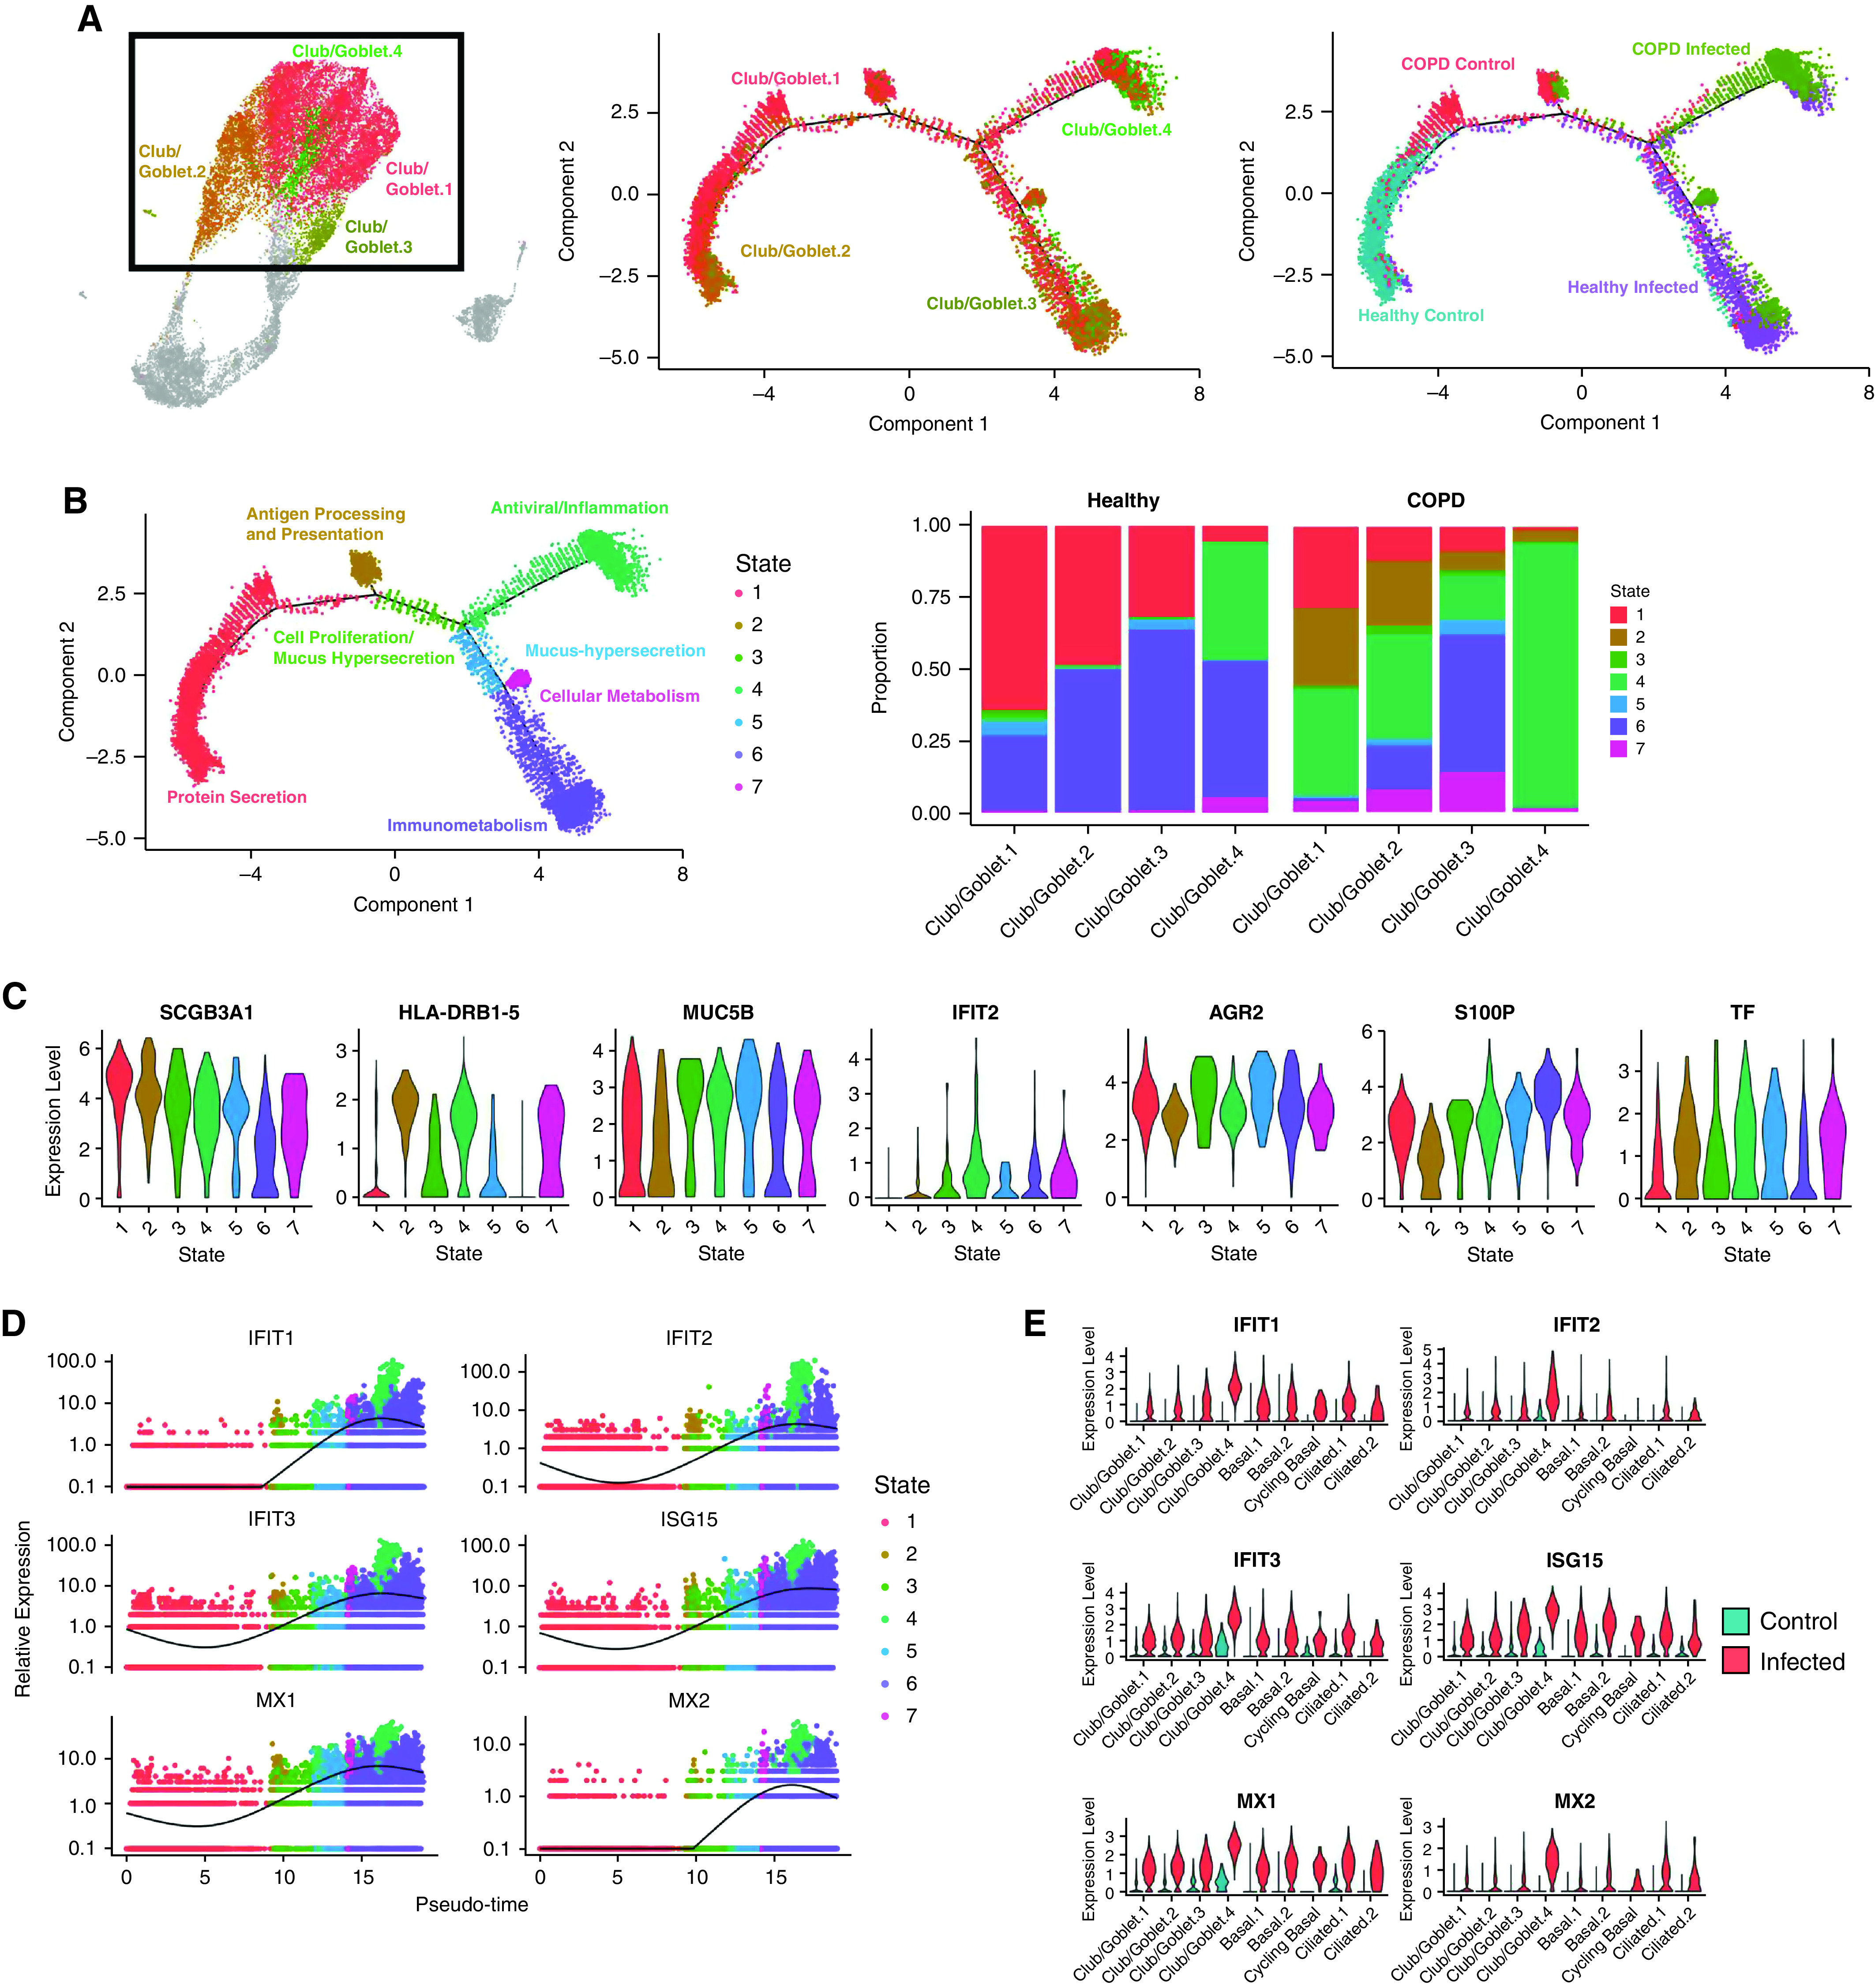
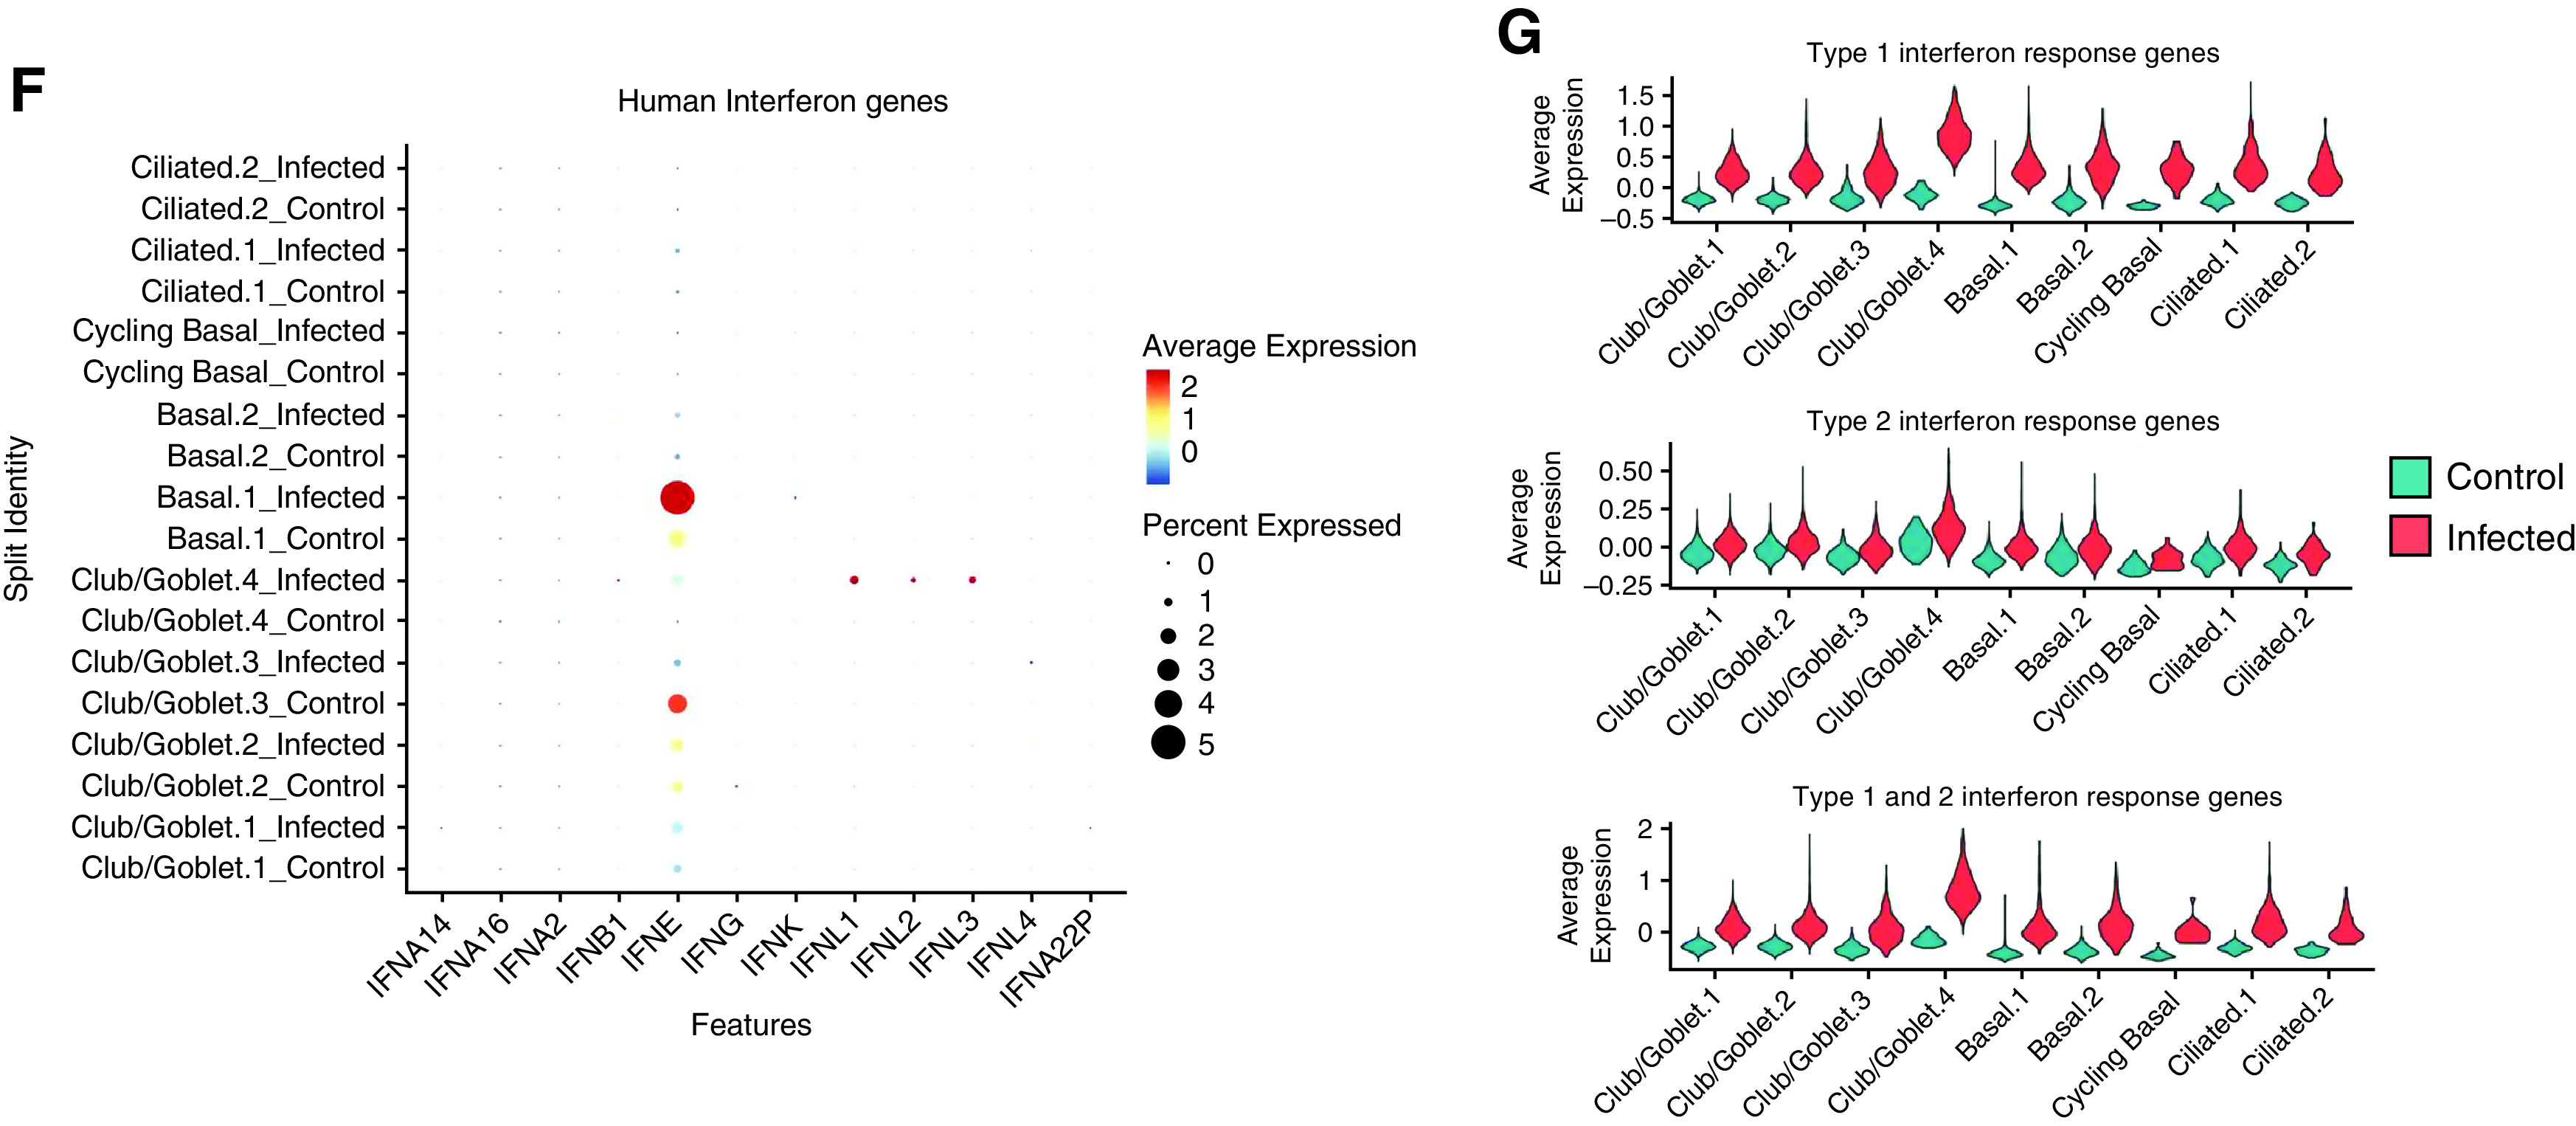
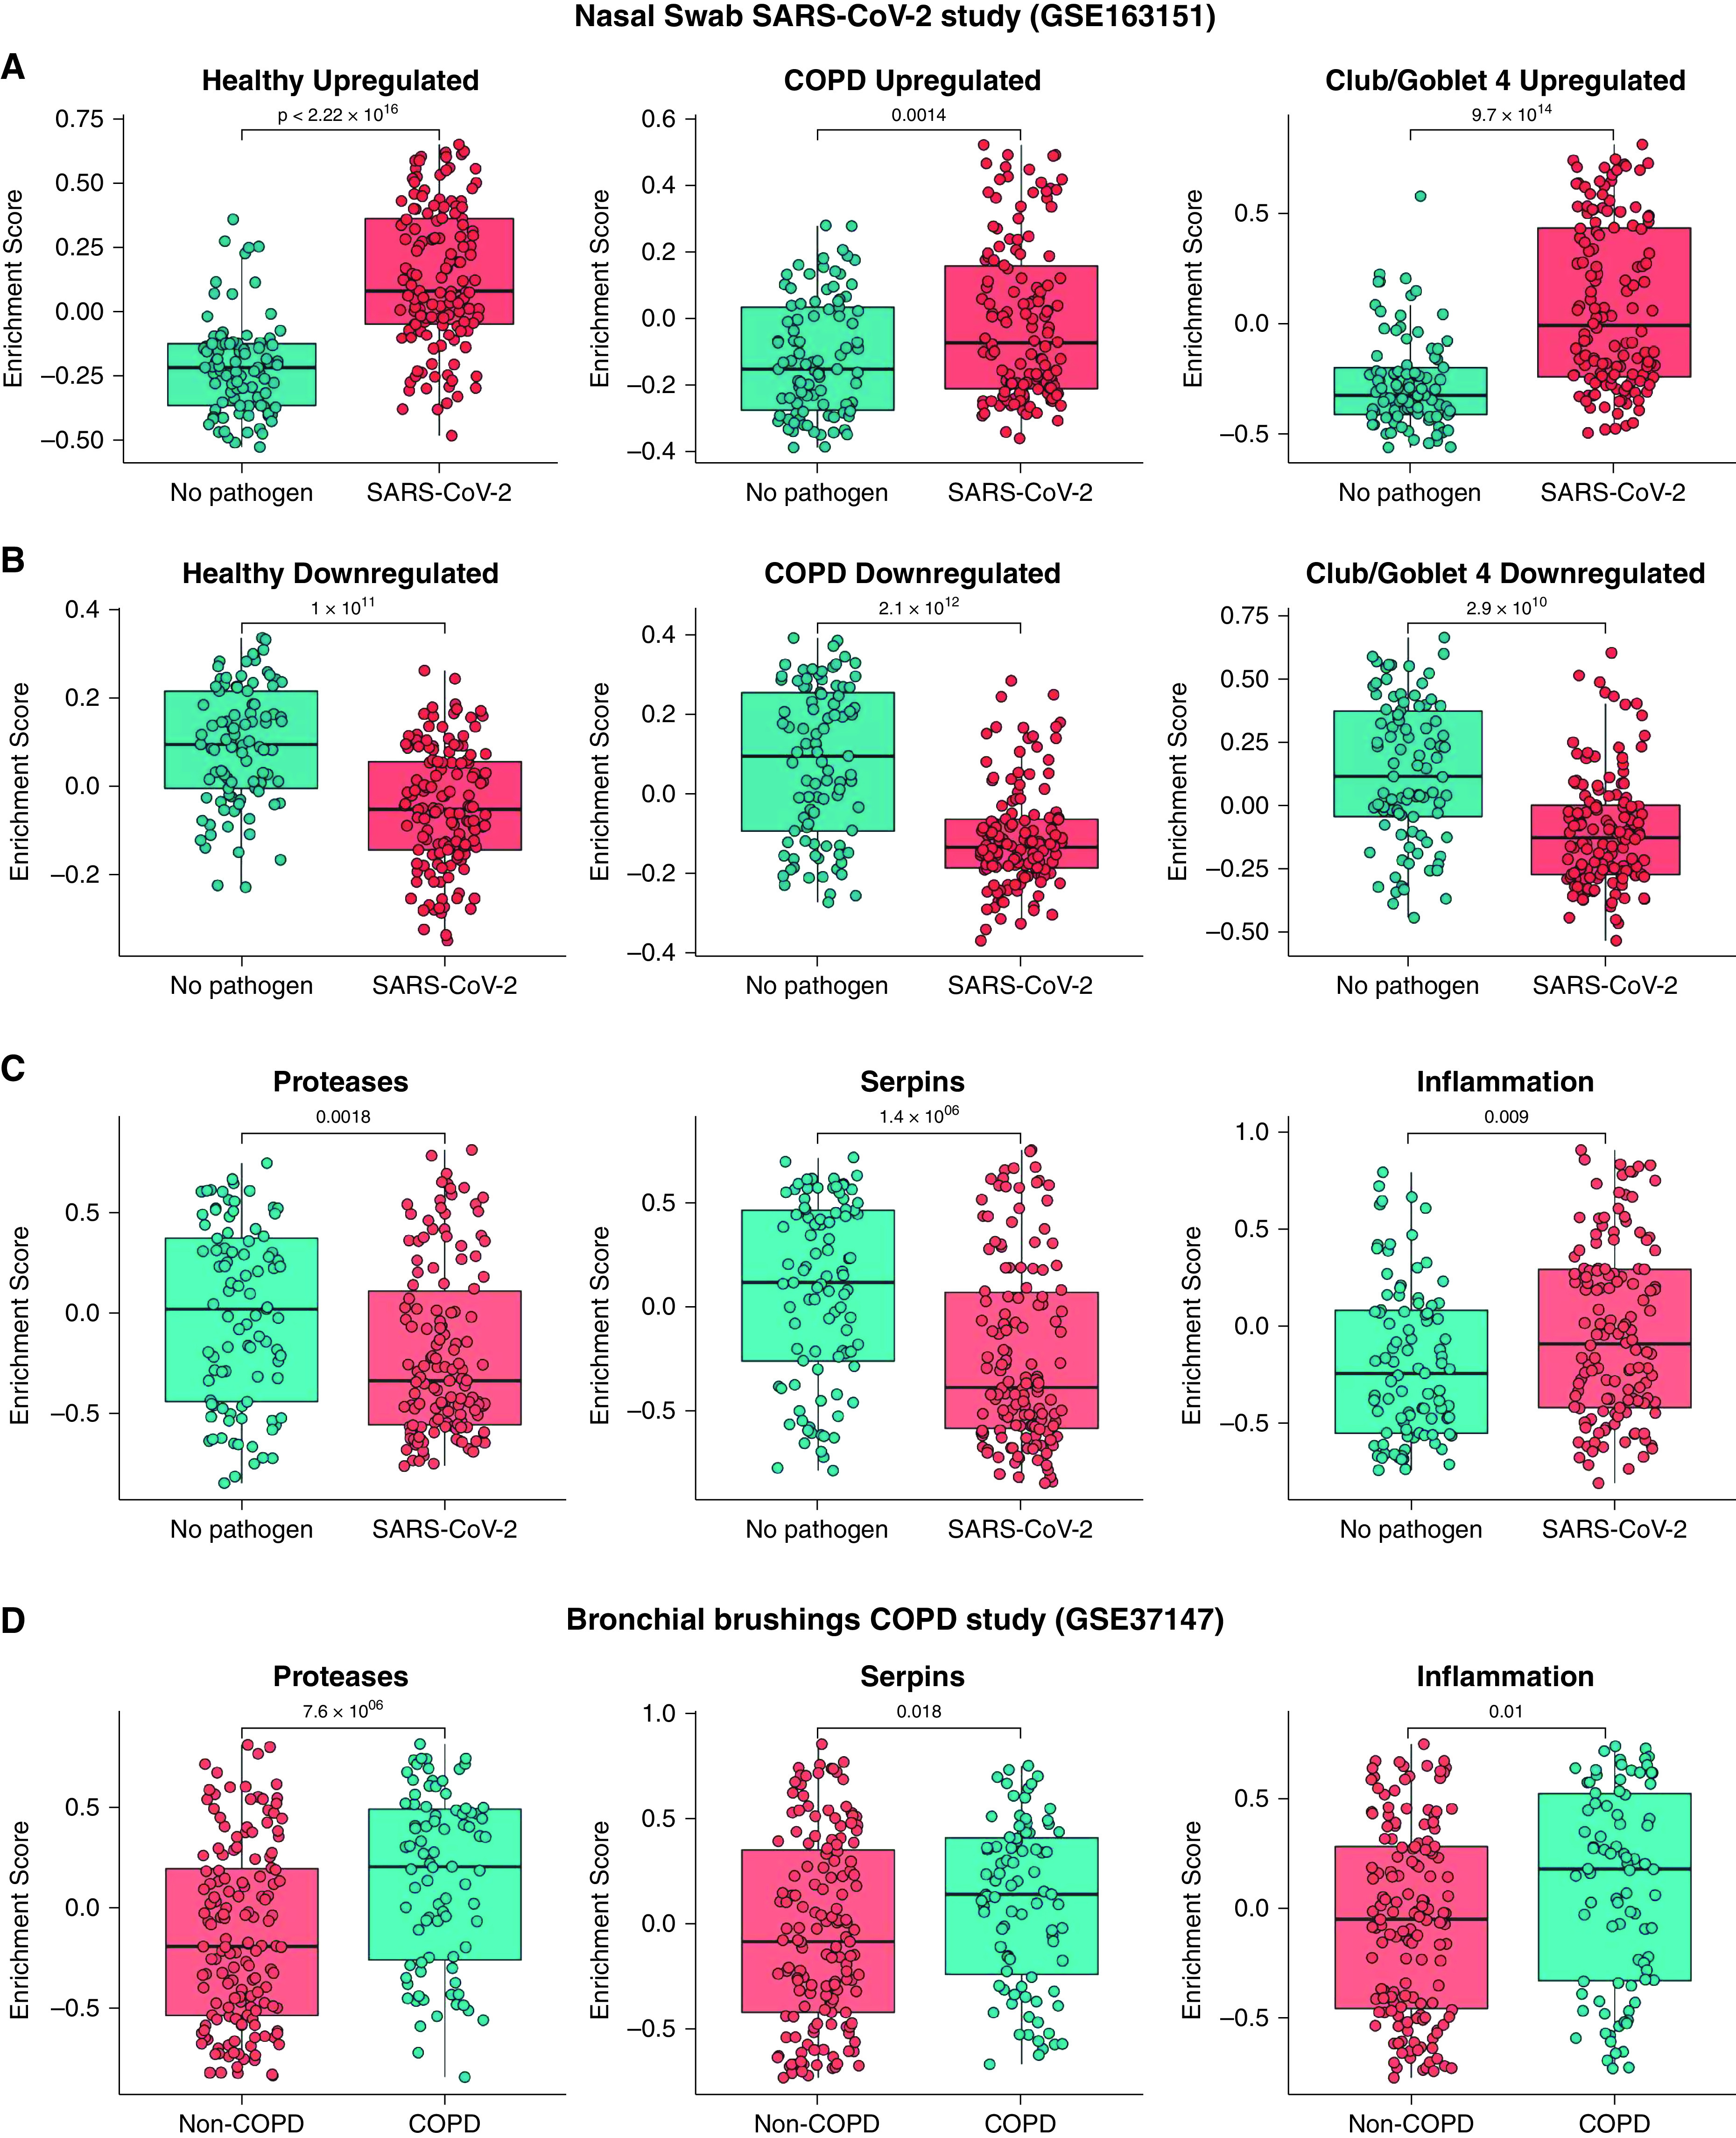
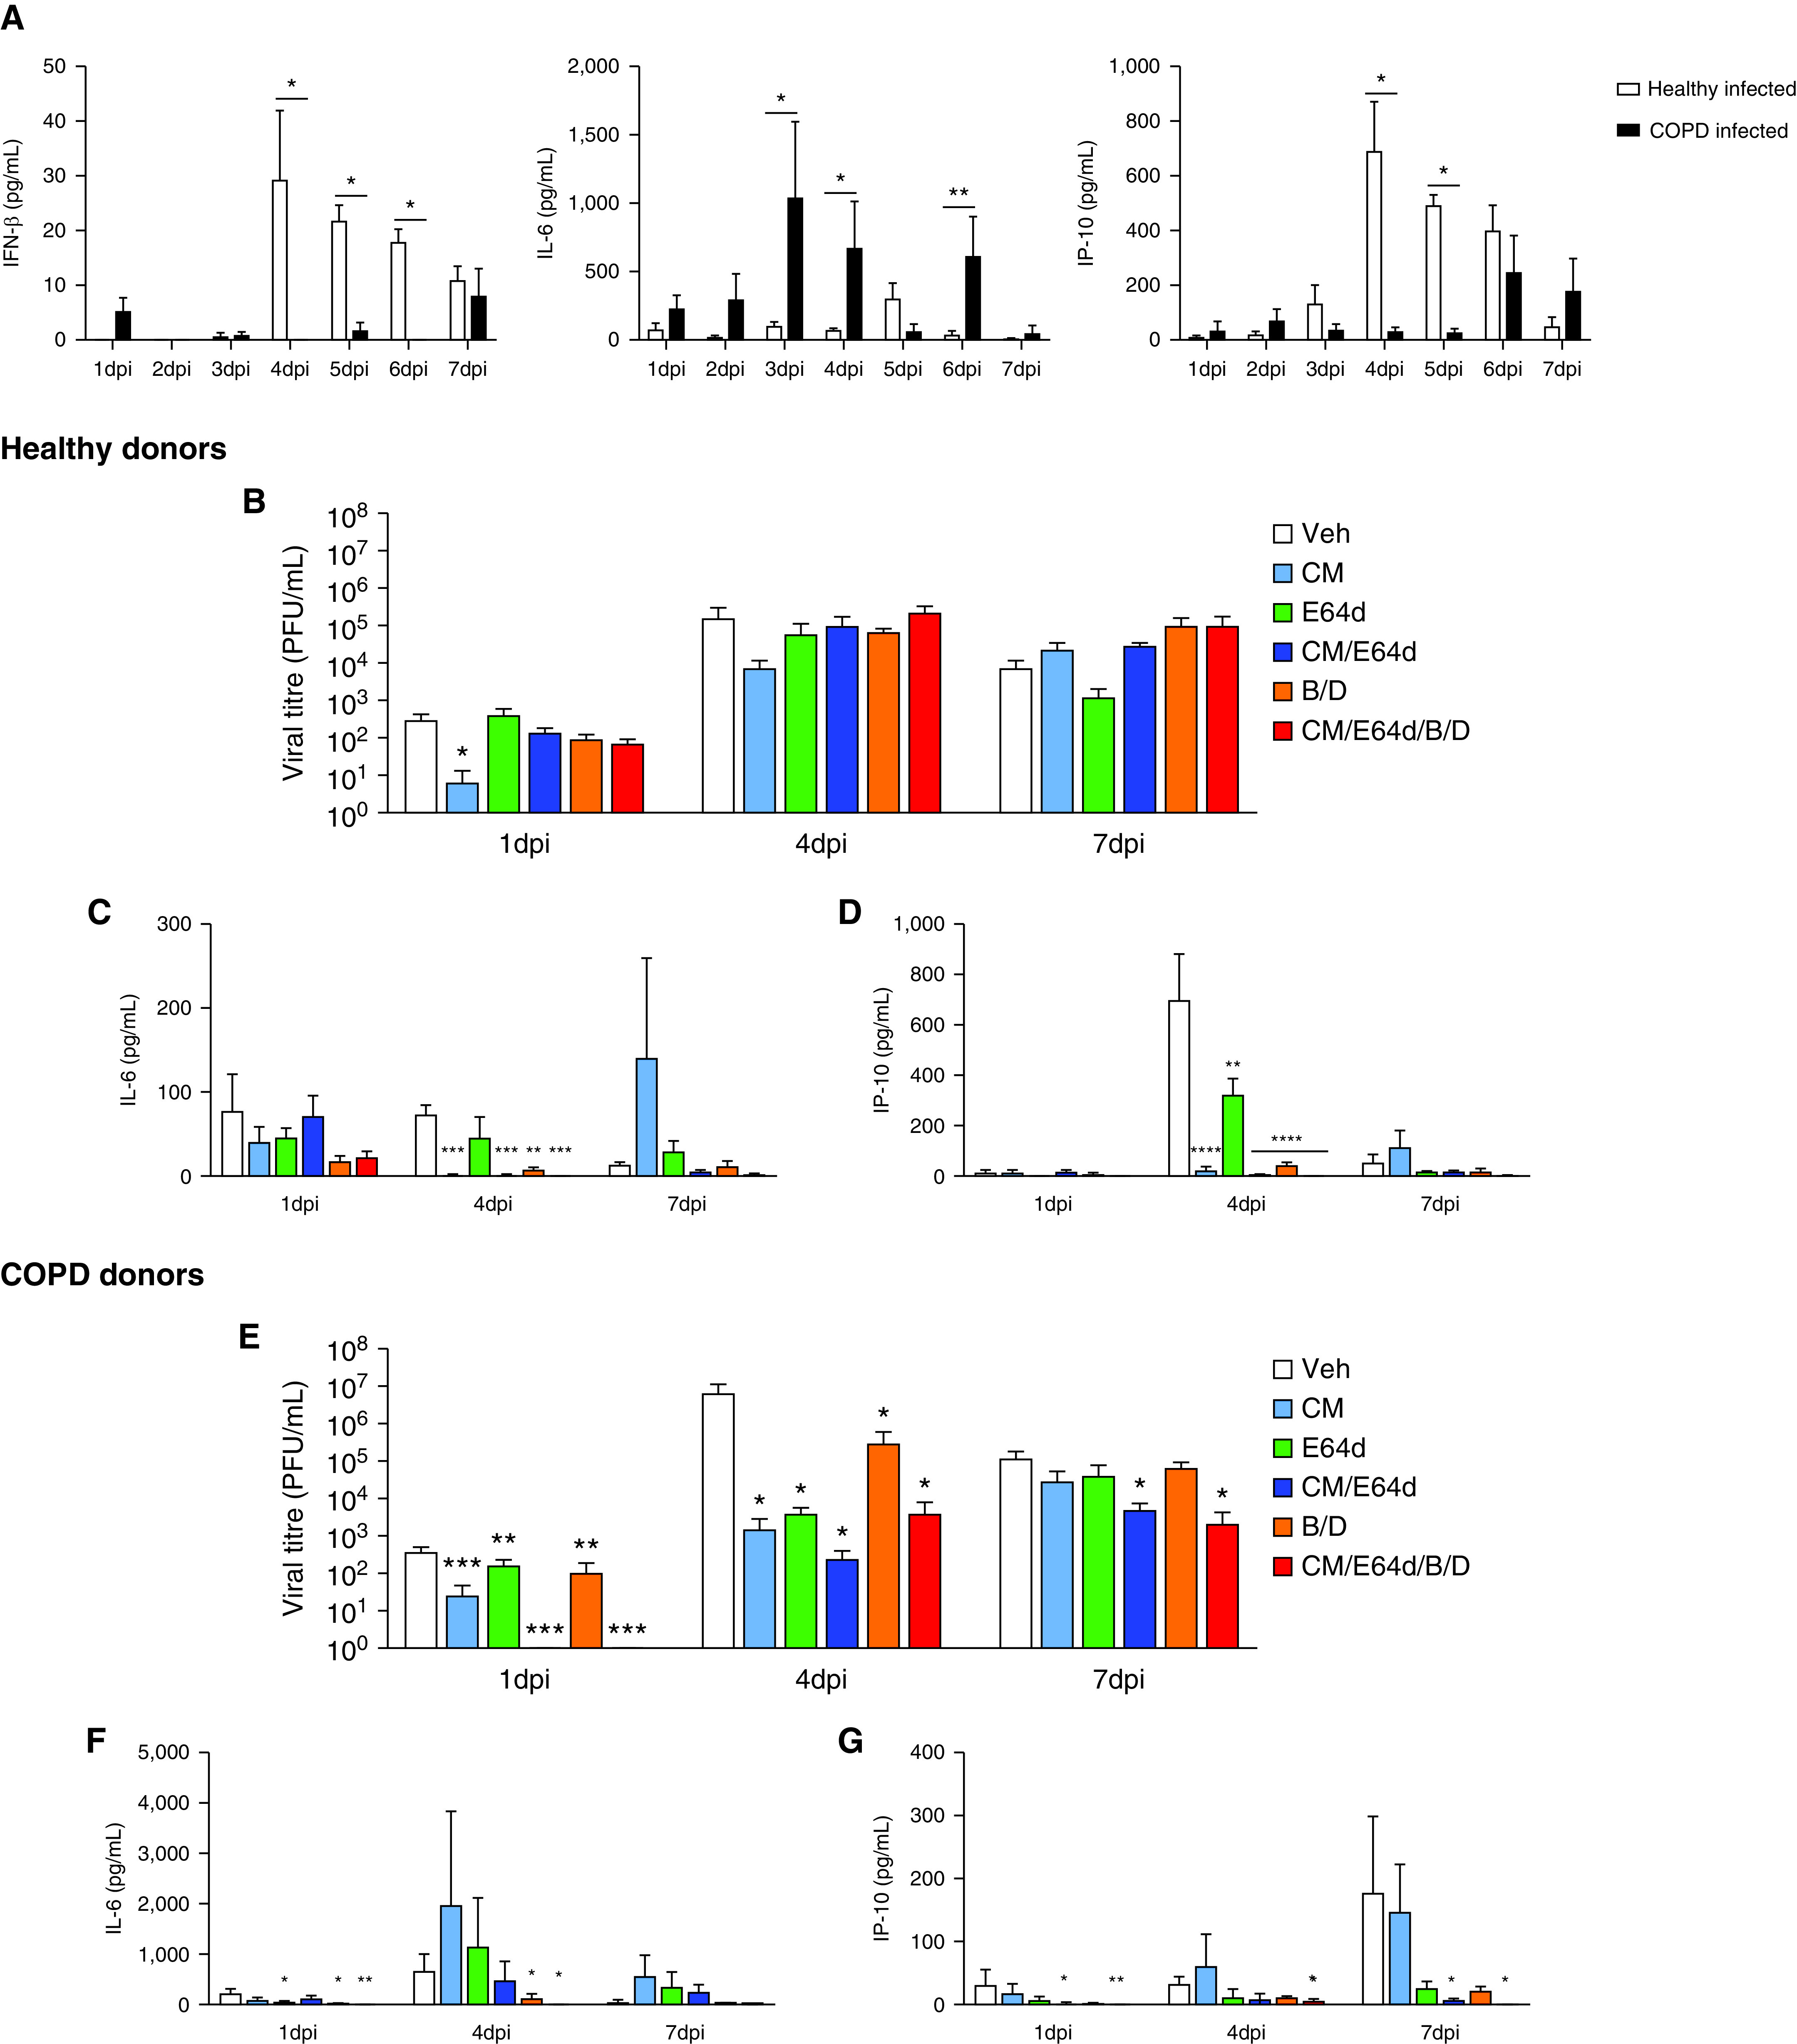
Rationale: Patients with chronic obstructive pulmonary disease (COPD) develop more severe coronavirus disease (COVID-19); however, it is unclear whether they are more susceptible to severe acute respiratory syndrome coronavirus 2 (SARS-CoV-2) infection and what mechanisms are responsible for severe disease. Objectives: To determine whether SARS-CoV-2 inoculated primary bronchial epithelial cells (pBECs) from patients with COPD support greater infection and elucidate the effects and mechanisms involved. Methods: We performed single-cell RNA sequencing analysis on differentiated pBECs from healthy subjects and patients with COPD 7 days after SARS-CoV-2 inoculation. We correlated changes with viral titers, proinflammatory responses, and IFN production. Measurements and Main Results: Single-cell RNA sequencing revealed that COPD pBECs had 24-fold greater infection than healthy cells, which was supported by plaque assays. Club/goblet and basal cells were the predominant populations infected and expressed mRNAs involved in viral replication. Proteases involved in SARS-CoV-2 entry/infection (TMPRSS2 and CTSB) were increased, and protease inhibitors (serpins) were downregulated more so in COPD. Inflammatory cytokines linked to COPD exacerbations and severe COVID-19 were increased, whereas IFN responses were blunted. Coexpression analysis revealed a prominent population of club/goblet cells with high type 1/2 IFN responses that were important drivers of immune responses to infection in both healthy and COPD pBECs. Therapeutic inhibition of proteases and inflammatory imbalances reduced viral titers and cytokine responses, particularly in COPD pBECs. Conclusions: COPD pBECs are more susceptible to SARS-CoV-2 infection because of increases in coreceptor expression and protease imbalances and have greater inflammatory responses. A prominent cluster of IFN-responsive club/goblet cells emerges during infection, which may be important drivers of immunity. Therapeutic interventions suppress SARS-CoV-2 replication and consequent inflammation.

Keywords: COPD; COVID-19; interferon; protease; single-cell RNA sequencing.


Figures

Figure 1.
Figure 1.
scRNAseq analysis of severe acute respiratory syndrome coronavirus 2 (SARS-CoV-2)-infected human primary bronchial epithelial cells (pBECs) differentiated at the air–liquid interface (ALI). (A) Experimental design of the SARS-CoV-2 infection of human pBECs differentiated ALI ex vivo. (B) Baseline characteristics of the samples showing cell numbers sequenced. (C) UMAP plot of the scRNAseq dataset identifying cell clusters. (D) Bar chart of proportions (in percentage) of major cell types (club/goblet, basal, and ciliated). (E) Cell proportions (in percentage) of control and infected healthy and chronic obstructive pulmonary disease (COPD) pBECs. (F) Average expression of the top five markers for each cluster. (G) Viral titers recovered from daily apical washes from COPD and healthy pBECs at ALI. Statistical differences between the groups are indicated whereby *P ⩽ 0.05 and **P ⩽ 0.01. HC = healthy control; scRNAseq = single-cell RNA sequencing; UMAP = uniform manifold approximation and projection.
Figure 2.
Figure 2.
Differential gene expression analysis between infected and bystander cells in infected chronic obstructive pulmonary disease (COPD) and healthy primary bronchial epithelial cells. (A) Signature plots of severe acute respiratory syndrome coronavirus 2 (SARS-CoV-2) markers. (B) Proportion of infected healthy (orange) and COPD (red) cells in each cell cluster. (C) Expression of SARS-CoV-2 markers in each of the different groups. (D) Volcano plot comparison of infected and bystander COPD cells. (E) Volcano plot comparison of infected and bystander healthy cells. (F) Heatmap of the top 25 genes in infected compared with bystander healthy and COPD cells. (G) Violin plots of three common upregulated and downregulated genes in infected healthy and COPD cells compared with their respective bystander cells. Statistical differences between the groups are indicated whereby *P ⩽ 0.05 and **P ⩽ 0.01. FC = fold change; UMAP = uniform manifold approximation and projection.
Figure 3.
Figure 3.
Differential gene expression analysis between infected chronic obstructive pulmonary disease (COPD) and healthy primary bronchial epithelial cells. (A) Heatmap of the top 50 differentially upregulated genes in infected COPD compared with healthy cells. Columns are grouped by samples, and rows represent genes grouped by the top upregulated (purple) and downregulated (green) in each or both COPD groups. (B) Volcano plot of differentially expressed genes in sham-infected COPD and healthy cells. (C) Volcano plot of differentially expressed genes in infected COPD and healthy cells. Average expression of (D) protease genes involved in severe acute respiratory syndrome coronavirus 2 (SARS-CoV-2) entry (TMPRSS2, CTSB, and CTSL) and (E) protease inhibitor genes (SERPINB1, SERPINB4, and SERPINB6). Each dot represents a donor. Statistical differences between the groups are indicated by asterisks, in which *P ⩽ 0.05, **P ⩽ 0.01, and ***P ⩽ 0.001. CC = COPD control; CI = COPD infected; FC = fold change; HC = healthy control; HI = healthy infected.
Figure 4.
Figure 4.
Elevated proinflammatory, exacerbation, and disease severity genes and severe acute respiratory syndrome coronavirus 2 (SARS-CoV-2) entry genes in chronic obstructive pulmonary disease (COPD) compared with healthy primary bronchial epithelial cells. Average expression of (A) proinflammatory response genes (IL1A, IL1B, IL6, IL32, CCL20, CSF1, NFKBIA, and NFKBIZ), (B) COPD exacerbation–associated genes (FKBP5, ICAM1, SAA1, and SAA2), (C) disease severity–associated genes (DPP9, PTMA, and RPS3), and (D) known SARS-CoV-2 entry genes (ACE2, BSG, NPR1, and FURIN). Each dot represents a donor. Statistical differences between groups are indicated whereby *P ⩽ 0.05, **P ⩽ 0.01, and ***P ⩽ 0.001. CC = COPD control; CI = COPD infected; HC = healthy control; HI = healthy infected; ns = not significant.
Figure 5.
Figure 5.
Coexpression network analysis using the CoCeNa2 pipeline. (A) Coexpression network analysis was performed on the basis of club/goblet, basal, and ciliated cells. Heatmaps for the samples are colored on the basis of the group fold change, which is the mean expression of each gene in the module. (B) Hallmark and (C) KEGG (Kyoto Encyclopedia of Genes and Genomes) pathway analysis using the CoCeNa2 pipeline for each module. Top pathways for each module are shown. Statistical differences between groups are indicated by different colored symbols, in which pink dots represent P ⩽ 0.05, orange dots represent P ⩽ 0.01, red dots represent P ⩽ 0.001, and the absence of a dot represents nonsignificant pathways. The size of dots is proportional to the number of gene counts that are associated with the respective pathway. CC = COPD control; CI = COPD infected; COPD = chronic obstructive pulmonary disease; GFC = group fold change; HC = healthy control; HI = healthy infected; ns = not significant.
Figure 6.
Figure 6.
Emergence of the Club/Goblet.4 cluster is driven by severe acute respiratory syndrome coronavirus 2 (SARS-CoV-2) infection. (A) Trajectory analysis in club/goblet cells colored by the four identified clusters, samples, and (B) cell states. The proportion of cell states in different cell types is shown in the barplot. (C) Violin plots of differentially expressed genes among cell states. (D) Pseudotime trajectory of IFN response genes (IRGs) colored by cell states. (E) Violin plots of IRGs in control and infected cells. (F) Average expression of human IFN genes. (G) Violin plots of type 1, type 2, and both type 1 and type 2 IRGs. COPD = chronic obstructive pulmonary disease.
Figure 6.
Figure 6.
Emergence of the Club/Goblet.4 cluster is driven by severe acute respiratory syndrome coronavirus 2 (SARS-CoV-2) infection. (A) Trajectory analysis in club/goblet cells colored by the four identified clusters, samples, and (B) cell states. The proportion of cell states in different cell types is shown in the barplot. (C) Violin plots of differentially expressed genes among cell states. (D) Pseudotime trajectory of IFN response genes (IRGs) colored by cell states. (E) Violin plots of IRGs in control and infected cells. (F) Average expression of human IFN genes. (G) Violin plots of type 1, type 2, and both type 1 and type 2 IRGs. COPD = chronic obstructive pulmonary disease.
Figure 7.
Figure 7.
Comparing ex vivo with publicly available severe acute respiratory syndrome coronavirus 2 (SARS-CoV-2) infection in vivo data. Gene set variation analysis (GSVA) was performed with bulk RNA sequencing dataset of in vivo SARS-CoV-2 nasal swabs (n = 231, GSE163151). GSVA of (A) up- and (B) downregulated genes in infected healthy and chronic obstructive pulmonary disease (COPD) samples compared with their control cells and Club/Goblet.4 cells compared with other cell types. (C) GSVA was performed for protease, serpin, and inflammatory genes with a nasal swab in vivo data. (D) GSVA of proteases, serpin, and inflammatory genes with bronchial brushing in vivo COPD data (n = 238, GSE37147). Statistical differences between the groups were accepted at P ⩽ 0.05.
Figure 8.
Figure 8.
Therapeutic interventions targeting protease imbalances and excessive proinflammatory responses limit severe acute respiratory syndrome coronavirus 2 (SARS-CoV-2) replication and blunt virally induced hyperinflammation. (A) Proinflammatory cytokines and IFN concentrations were quantified at the protein level using the LEGENDplex Human Anti-virus Response Panel in chronic obstructive pulmonary disease (COPD) and healthy infected samples across time. (B) Viral titers were quantified in daily apical washes from healthy infected samples after daily treatments with Camostat Mesylate (CM), E64d, CM/E64d, baricitinib/dexamethasone (B/D), or a combined therapy (CM/E64d/B/D). (C) IL-6 and IP-10 (CXCL10) were quantified in apical washes from healthy infected samples using the LEGENDplex Human Anti-virus Response Panel. (D) Viral titers were quantified in daily apical washes from COPD-infected samples after daily treatments. (E) IL-6 and IP-10 were quantified in the apical washes from COPD-infected samples. Statistical differences between the groups are indicated, whereby *P ⩽ 0.05, **P ⩽ 0.01, ***P ⩽ 0.001, and ****P ⩽ 0.0001. In BG, statistical differences shown are relative to their respective vehicle control at each time point examined. PFU = plaque-forming unit; Veh = vehicle.

Comment in

References

    1. O’Driscoll M, Ribeiro Dos Santos G, Wang L, Cummings DAT, Azman AS, Paireau J, et al. Age-specific mortality and immunity patterns of SARS-CoV-2. Nature . 2021;590:140–145. - PubMed
    1. Johansen MD, Irving A, Montagutelli X, Tate MD, Rudloff I, Nold MF, et al. Animal and translational models of SARS-CoV-2 infection and COVID-19. Mucosal Immunol . 2020;13:877–891. - PMC - PubMed
    1. Wark PAB, Pathinayake PS, Kaiko G, Nichol K, Ali A, Chen L, et al. ACE2 expression is elevated in airway epithelial cells from older and male healthy individuals but reduced in asthma. Respirology . 2021;26:442–451. - PMC - PubMed
    1. Zhang H, Penninger JM, Li Y, Zhong N, Slutsky AS. Angiotensin-converting enzyme 2 (ACE2) as a SARS-CoV-2 receptor: molecular mechanisms and potential therapeutic target. Intensive Care Med . 2020;46:586–590. - PMC - PubMed
    1. Jia HP, Look DC, Shi L, Hickey M, Pewe L, Netland J, et al. ACE2 receptor expression and severe acute respiratory syndrome coronavirus infection depend on differentiation of human airway epithelia. J Virol . 2005;79:14614–14621. - PMC - PubMed

Publication types