

Nanomolar EP4 receptor potency and expression of eicosanoid-related enzymes in normal appearing colonic mucosa from patients with colorectal neoplasia
- PMID: 35549670
- PMCID: PMC9097415
- DOI: 10.1186/s12876-022-02311-z
Nanomolar EP4 receptor potency and expression of eicosanoid-related enzymes in normal appearing colonic mucosa from patients with colorectal neoplasia
Erratum in
-
Correction: Nanomolar EP4 receptor potency and expression of eicosanoid-related enzymes in normal appearing colonic mucosa from patients with colorectal neoplasia.BMC Gastroenterol. 2022 Jun 17;22(1):298. doi: 10.1186/s12876-022-02339-1. BMC Gastroenterol. 2022. PMID: 35715746 Free PMC article. No abstract available.
Abstract
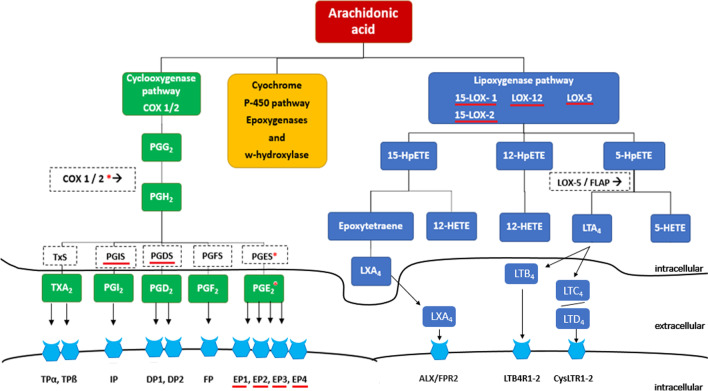
Background: Aberrations in cyclooxygenase and lipoxygenase (LOX) pathways in non-neoplastic, normal appearing mucosa from patients with colorectal neoplasia (CRN), could hypothetically qualify as predisposing CRN-markers.
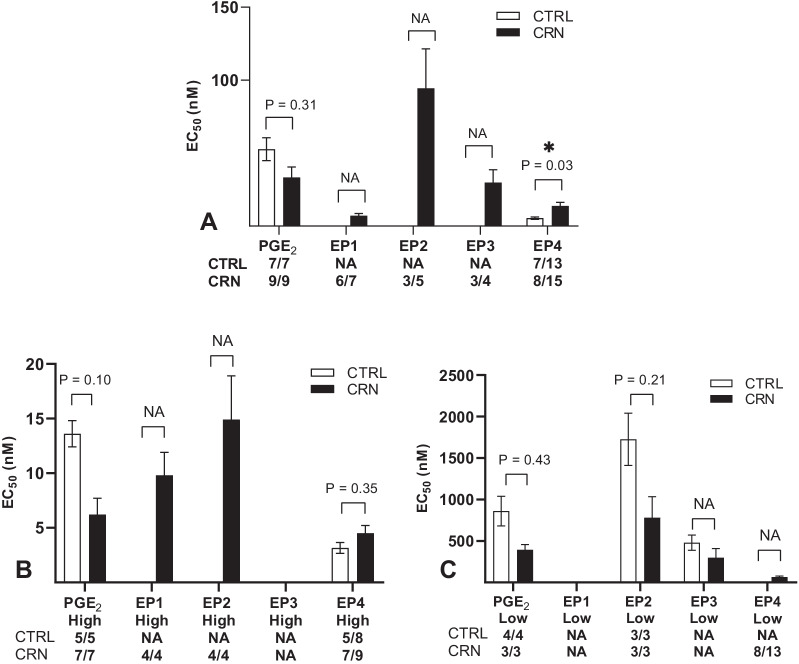
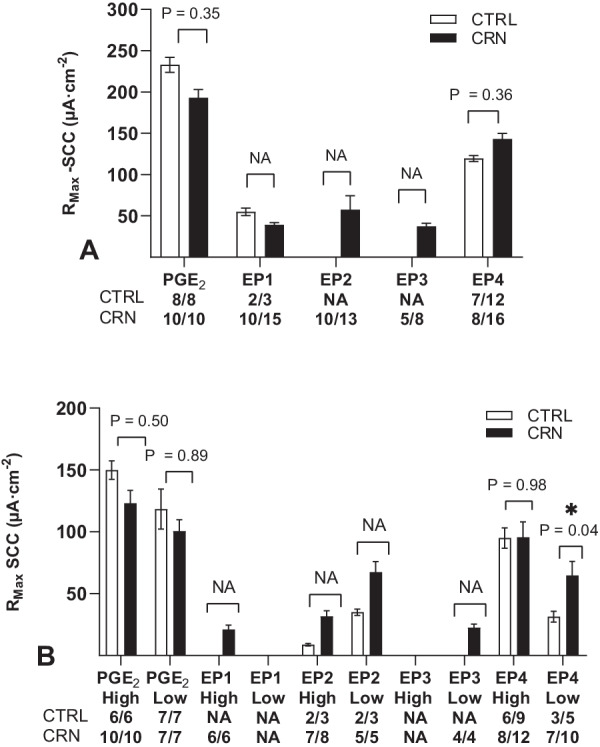
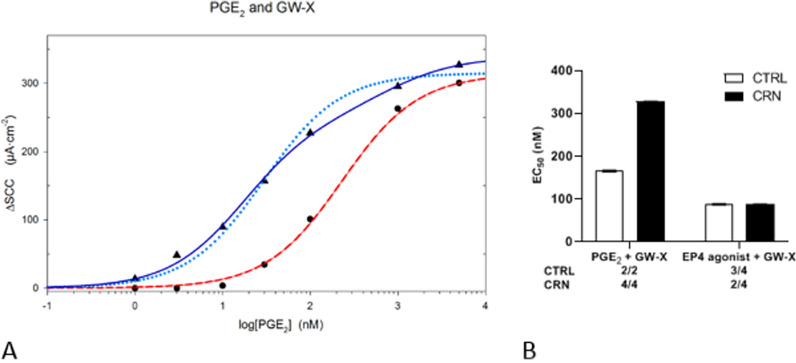
Methods: To test this hypothesis, biopsies were obtained during colonoscopy from macroscopically normal colonic mucosa from patients with and without CRN. Prostaglandin E2 (PGE2) receptors, EP1-4, were examined in Ussing-chambers by exposing biopsies to selective EP receptor agonists, antagonists and PGE2. Furthermore, mRNA expression of EP receptors, prostanoid synthases and LOX enzymes were evaluated with qPCR.
Results: Data suggest that PGE2 binds to both high and low affinity EP receptors. In particular, PGE2 demonstrated EP4 receptor potency in the low nanomolar range. Similar results were detected using EP2 and EP4 agonists. In CRN patients, mRNA-levels were higher for EP1 and EP2 receptors and for enzymes prostaglandin-I synthase, 5-LOX, 12-LOX and 15-LOX.
Conclusions: In conclusion, normal appearing colonic mucosa from CRN patients demonstrates deviating expression in eicosanoid pathways, which might indicate a likely predisposition for early CRN development and furthermore that PGE2 potently activates high affinity EP4 receptor subtypes, supporting relevance of testing EP4 antagonists in colorectal neoplasia management.
Keywords: Colorectal cancer; EP receptors; Lipoxygenase; Short circuit current; mRNA expression.
© 2022. The Author(s).
Conflict of interest statement
Mark Berner-Hansen is also a present employee of Zealand Pharma, Denmark. The present work was not related to this affiliation. All authors declare no competing interests.
Figures


Similar articles
-
Differential expression of E-type prostanoid receptors 2 and 4 in microglia stimulated with lipopolysaccharide.J Neuroinflammation. 2017 Jan 5;14(1):3. doi: 10.1186/s12974-016-0780-7. J Neuroinflammation. 2017. PMID: 28086956 Free PMC article.
-
Prostaglandin E2-induced colonic secretion in patients with and without colorectal neoplasia.BMC Gastroenterol. 2010 Jan 26;10:9. doi: 10.1186/1471-230X-10-9. BMC Gastroenterol. 2010. PMID: 20100359 Free PMC article.
-
Possible predisposition for colorectal carcinogenesis due to altered gene expressions in normal appearing mucosa from patients with colorectal neoplasia.BMC Cancer. 2019 Jun 28;19(1):643. doi: 10.1186/s12885-019-5833-8. BMC Cancer. 2019. PMID: 31253108 Free PMC article.
-
EP4 receptor as a novel promising therapeutic target in colon cancer.Pathol Res Pract. 2020 Dec;216(12):153247. doi: 10.1016/j.prp.2020.153247. Epub 2020 Oct 19. Pathol Res Pract. 2020. PMID: 33190014 Review.
-
[Cooperation of two subtypes of PGE2 receptor, Gi coupled EP3 and Gs coupled EP2 or EP4 subtype].Yakugaku Zasshi. 2003 Oct;123(10):837-43. doi: 10.1248/yakushi.123.837. Yakugaku Zasshi. 2003. PMID: 14577329 Review. Japanese.
Cited by
-
In vitro models and ex vivo systems used in inflammatory bowel disease.In Vitro Model. 2022;1(3):213-227. doi: 10.1007/s44164-022-00017-w. Epub 2022 Apr 25. In Vitro Model. 2022. PMID: 37519330 Free PMC article. Review.
-
Butyrate, IL-4, and EP4 Receptors: A Triad of Colorectal Homeostasis, Protecting Against Onset of Cancer and IBD?Bioessays. 2025 Sep;47(9):e70046. doi: 10.1002/bies.70046. Epub 2025 Jul 23. Bioessays. 2025. PMID: 40697058 Free PMC article. Review.
-
Correction: Nanomolar EP4 receptor potency and expression of eicosanoid-related enzymes in normal appearing colonic mucosa from patients with colorectal neoplasia.BMC Gastroenterol. 2022 Jun 17;22(1):298. doi: 10.1186/s12876-022-02339-1. BMC Gastroenterol. 2022. PMID: 35715746 Free PMC article. No abstract available.
References
-
- Bray F, Ferlay J, Soerjomataram I, Siegel RL, Torre LA, Jemal A. Global cancer statistics 2018: GLOBOCAN estimates of incidence and mortality worldwide for 36 cancers in 185 countries. CA: Cancer J Clin. 2018;68(6):394–424. - PubMed
MeSH terms
Substances
Grants and funding
LinkOut - more resources
Full Text Sources
Medical
Miscellaneous
