. 2022 May 12;41(1):173.
doi: 10.1186/s13046-022-02382-6.

GABPA-activated TGFBR2 transcription inhibits aggressiveness but is epigenetically erased by oncometabolites in renal cell carcinoma

Affiliations

GABPA-activated TGFBR2 transcription inhibits aggressiveness but is epigenetically erased by oncometabolites in renal cell carcinoma

Zhiqing Fang et al. J Exp Clin Cancer Res. .

Abstract

Background: The ETS transcription factor GABPA has long been thought of as an oncogenic factor and recently suggested as a target for cancer therapy due to its critical effect on telomerase activation, but the role of GABPA in clear cell renal cell carcinoma (ccRCC) is unclear. In addition, ccRCC is characterized by metabolic reprograming with aberrant accumulation of L-2-hydroxyglurate (L-2HG), an oncometabolite that has been shown to promote ccRCC development and progression by inducing DNA methylation, however, its downstream effectors remain poorly defined.

Methods: siRNAs and expression vectors were used to manipulate the expression of GABPA and other factors and to determine cellular/molecular and phenotypic alterations. RNA sequencing and ChIP assays were performed to identify GABPA target genes. A human ccRCC xenograft model in mice was used to evaluate the effect of GABPA overexpression on in vivo tumorigenesis and metastasis. ccRCC cells were incubated with L-2-HG to analyze GABPA expression and methylation. We carried out immunohistochemistry on patient specimens and TCGA dataset analyses to assess the effect of GABPA on ccRCC survival.

Results: GABPA depletion, although inhibiting telomerase expression, robustly enhanced proliferation, invasion and stemness of ccRCC cells, whereas GABPA overexpression exhibited opposite effects, strongly inhibiting in vivo metastasis and carcinogenesis. TGFBR2 was identified as the GABPA target gene through which GABPA governed the TGFβ signaling to dictate ccRCC phenotypes. GABPA and TGFBR2 phenocopies each other in ccRCC cells. Higher GABPA or TGFBR2 expression predicted longer survival in patients with ccRCC. Incubation of ccRCC cells with L-2-HG mimics GABPA-knockdown-mediated phenotypic alterations. L-2-HG silenced the expression of GABPA in ccRCC cells by increasing its methylation.

Conclusions: GABPA acts as a tumor suppressor by stimulating TGFBR2 expression and TGFβ signaling, while L-2-HG epigenetically inhibits GABPA expression, disrupting the GABPA-TGFβ loop to drive ccRCC aggressiveness. These results exemplify how oncometabolites erase tumor suppressive function for cancer development/progression. Restoring GABPA expression using DNA methylation inhibitors or other approaches, rather than targeting it, may be a novel strategy for ccRCC therapy.

Keywords: GABPA; L-2-HG; Oncometabolite; TGFBR2; ccRCC.


Conflict of interest statement

The authors declare that they have no competing interests.

Figures
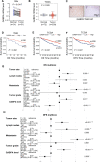
Fig. 1
Fig. 1
GABPA is downregulated in ccRCC tumors and is associated with patient survival. A GABPA expression in tumors and matched noncancerous adjacent renal tissues (NTs) from 31 ccRCC patients. GABPA mRNA expression was determined using qPCR. B GABPA mRNA expression in ccRCC tumors and NTs from the TCGA cohort of patients. C The representative IHC staining images showed diminished GABPA expression at protein levels in the tumor (T) compared that in matched NT. Scale bar: 100 µm. D Higher GABPA expression is associated with longer overall survival (OS) in the TMA cohort of ccRCC patients. E and F Higher GABPA mRNA expression predicts longer OS and DFS in the TCGA cohort of ccRCC patients. G and H Multivariate analyses show the impacts of GABPA mRNA expression on OS and DFS in the TCGA cohort of ccRCC patients, respectively
Fig. 2
Fig. 2
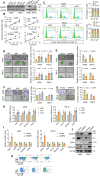
GABPA regulates proliferation, stemness and invasion of ccRCC cells. A GABPA-specific siRNAs and its expression vectors efficiently inhibit and overexpress GABPA in A498 and 786-O cells, respectively, as determined using immunoblotting. B GABPA depletion promotes while its overexpression inhibits cell proliferation. IncuCyte S3 Live-Cell Analysis System was employed to measure cell proliferation rate. C GABPA depletion increases while its overexpression reduces cells at S phase, as assessed using flow cytometry. D and E GABPA depletion increases while its overexpression reduces the stemness of A498 and 786-O cells. Scale bars: 200 µm. F and G GABPA depletion increases while its overexpression reduces the invasive capacity of A498 and 786-O cells. Scale bars: 100 µm. (H-J) GABPA regulates the expression of proliferation-, stemness- and EMT-related genes. (K) ccRCC stem cell (CD44 and CD105) and mesenchymal stem cell markers (CD90) are upregulated in GABPA-depleted cells. Three independent experiments were performed. *, ** and *** denote P < 0.05, 0.01 and 0.001, respectively
Fig. 3
Fig. 3
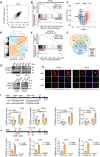
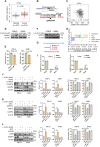
TGFBR2 is the GABPA target gene. A GABPA and TGFBR2 expression is highly correlated with each other in the TCGA ccRCC tumors. B The GSEA analysis reveals that the TGFβ signaling is enriched in ccRCC tumors expressing higher GABPA in the TCGA cohort of ccRCC. C The volcano plot shows TGFBR2 among the top downregulated genes in GABPA-depleted cells, as determined using RNA seq derived from 3 independent experiments (Exp). D The heatmap of RNA seq results illustrates significantly downregulated expression of the TGFβ pathway factors. E The GSEA analysis of RNA seq results shows the diminished TGFβ pathway enrichment in GABPA-depleted cells. F Venn diagram reveals five overlapped genes based on the integrated analyses of TCGA, RNA seq and GABPA ChIP-seq of leukemic and liver cancer cells. G GABPA knockdown downregulates while its overexpression upregulates TGFBR2 expression. H Immunofluorescence results further reveal diminished TGFBR2 expression in GABPA-depleted cells. Scale bars: 10 µm. I Top panel: The schematic drawing shows the GABPA binding motifs on the TGFBR2 promoter and mutated nucleotides. Bottom panel: GABPA knockdown inhibits while its overexpression stimulates the TGFBR2 promoter activity. J Top panel: The schematic diagram shows the primer locations spanning GABPA sites for ChIP assay. Bottom panel: The enrichment of GABPA on the TGFBR2 promoter, as determined using ChIP assay. Three independent experiments were performed. *, ** and *** denote P < 0.05, 0.01 and 0.001, respectively
Fig. 4
Fig. 4
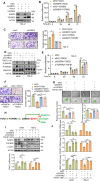
GABPA activates the TGFβ pathway to exert its effects on ccRCC cells. A and B The accelerated cell proliferation resulting from GABPA knockdown is abolished by TGFBR2 overexpression. C The enhanced cell invasion resulting from GABPA knockdown is abolished by TGFBR2 overexpression. Scale bars: 100 µm. D TGFβ-mediated SMAD2/3 phosphorylation is abolished by knockdown of either GABPA or TGFBR2. E The inhibition of cell proliferation mediated by TGFβ is significantly attenuated by knockdown of GABPA or TGFBR2. F The inhibition of cell invasion mediated by TGFβ is significantly attenuated by knockdown of either GABPA or TGFBR2. Scale bars: 100 µm. G The stemness or self-renewal inhibition mediated by TGFβ is abolished by knockdown of either GABPA or TGFBR2. Scale bars: 200 µm. H The schematic illustration for TGFβ and cMYC targets. I TGFβ-mediated downregulation of cMYC is abolished by knockdown of either GABPA or TGFBR2. J The expression of TGFβ and/or cMYC target genes are altered in response to TGFβ treatment and knockdown of GABPA or TGFBR2. Three independent experiments were performed. *, ** and *** denote P < 0.05, 0.01 and 0.001, respectively
Fig. 5
Fig. 5
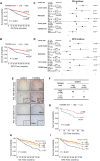
TGFBR2 serves as a prognostic factor for ccRCCs. A and B Higher TGFBR2 expression predicts longer OS and DFS in the TCGA cohort of ccRCC patients. C and D Multivariate analyses show the impacts of TGFBR2 on OS and DFS in the TCGA cohort of ccRCC patients, respectively. E-G Higher TGFBR2 expression is associated with longer overall survival (OS) in the TMA cohort of ccRCC patients. The representative immunohistochemical results of GABPA-strong and weak tumors and correlation with TGFBR2 (E and F). Scale bars: 100 µm. (H and I) Patients with both lower GABPA and TGFBR2 had shortest OS and DFS in the TCGA ccRCC cohort
Fig. 6
Fig. 6
L-2-HG accumulation induces epigenetic silence of GABPA expression. A GABPA methylation is significantly higher in ccRCC tumors than in corresponding renal tissues in the TCGA cohort. B The schematic illustration of the CpG cg08521263 at the GABPA promoter. C The inverse correlation between the methylation of cg08521263 and GABPA mRNA levels in the TCGA cohort. D and E 5-AZA-treatment of A498 and 786-O cells upregulates GABPA expression coupled with the reduced methylation of cg08521263. Immunoblotting and pyrosequencing were used to assess GABPA expression and methylation, respectively. Three independent experiments were performed. F L-2-HG-treatment of A498 and 786-O cells inhibits GABPA expression. G The schematic illustration of conversion between L-2-HG and a-KG and related enzymes. H The genetic alterations in L2HGDH, MDH1/2, and LDHA/LDHB in tumors and from the TCGA ccRCC cohort and their correlation with GABPA expression. I The reduced 5-hmC accumulation in the GABPA sequence spanning cg08521263. Cells were treated with L-2-HG and ChIP assays were then carried out. J The restoration of L2HGDH expression upregulates GABPA expression coupled with increased 5-hmc and reduced methylation of cg08521263. All these effects are attenuated by addition of L-2-HG. K MDH2 depletion upregulates GABPA expression coupled with increased 5-hmc and reduced methylation of cg08521263. All these effects are attenuated by addition of L-2-HG. L LDHB depletion upregulates GABPA expression coupled with increased 5-hmc and reduced methylation of cg08521263. All these effects are attenuated by addition of L-2-HG. Three independent experiments were performed. *, ** and *** denote P < 0.05, 0.01 and 0.001, respectively
Fig. 7
Fig. 7
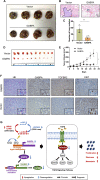
GABPA over-expression inhibits in vivo ccRCC metastasis and growth in xenograft mouse models. 786-O/GABPA and 786-O/Control cells were injected into nude mice via the tail vein and subcutaneously, respectively. Lungs and tumors were examined for metastasis and growth, respectively. (A-C) Significantly reduced numbers of tumor foci in lungs from mice injected with 786-O/GABPA cells via vein tail. A Tumor foci indicated by yellow arrows. B H & E staining of metastatic tumors in lungs from 786/control and 786/GABPA cells, respectively. Shown are representative images. Scale bars: 50 µm. C The number of tumors in lungs from two groups. D and E Defective tumor growth in mice subcutaneously injected with 786-O/GABPA cells. F IHC analyses of GABPA, TGFBR2 and Ki67 expression in tumors derived from 786-O/control and 786-O/GABPA cells. The images in insets were with bigger magnifications. Scale bars: 50 µm. G The work model for the GABPA-TGFβ signaling and relationship with oncometabolites during ccRCC development and progression

Similar articles

Cited by

References

    1. Znaor A, Lortet-Tieulent J, Laversanne M, Jemal A, Bray F. International variations and trends in renal cell carcinoma incidence and mortality. Eur Urol. 2015;67(3):519–530. doi: 10.1016/j.eururo.2014.10.002. - DOI - PubMed
    1. Chow WH, Dong LM, Devesa SS. Epidemiology and risk factors for kidney cancer. Nat Rev Urol. 2010;7(5):245–257. doi: 10.1038/nrurol.2010.46. - DOI - PMC - PubMed
    1. Siegel RL, Miller KD, Jemal A. Cancer statistics, 2020. CA Cancer J Clin. 2020;70(1):7–30. doi: 10.3322/caac.21590. - DOI - PubMed
    1. Mitchell TJ, Turajlic S, Rowan A, Nicol D, Farmery JHR, O'Brien T, et al. Timing the Landmark Events in the Evolution of Clear Cell Renal Cell Cancer: TRACERx Renal. Cell. 2018;173(3):611–623. doi: 10.1016/j.cell.2018.02.020. - DOI - PMC - PubMed
    1. Hsieh JJ, Le VH, Oyama T, Ricketts CJ, Ho TH, Cheng EH. Chromosome 3p Loss-Orchestrated VHL, HIF, and Epigenetic Deregulation in Clear Cell Renal Cell Carcinoma. J Clin Oncol. 2018;36(36):JCO2018792549. doi: 10.1200/JCO.2018.79.2549. - DOI - PMC - PubMed

MeSH terms

Substances