. 2022 May;13(5):12193-12210.
doi: 10.1080/21655979.2022.2073943.

A novel hypoxia-driven gene signature that can predict the prognosis of hepatocellular carcinoma

Affiliations

A novel hypoxia-driven gene signature that can predict the prognosis of hepatocellular carcinoma

Zhirui Zeng et al. Bioengineered. 2022 May.

Abstract

Hypoxia environment exists in already started hepatocellular carcinoma (HCC) and promotes its progression by driving changes in the gene expression profiles of cells. However, the status of hypoxia-driven genes in HCC is largely unknown. In the present study, 368 HCC tissues from The Cancer Genome Atlas were divided into high and low hypoxia groups according to their hypoxia signatures. A total of 1,142 differentially expressed genes (DEGs) were identified between the two groups, and 34 of these DEGs were highly expressed in HCC tissues compared with adjacent tissues, especially in HCC tissues from patients with stage III-IV HCC. After constructing a protein-protein interaction network and applying the least absolute shrinkage and selection operator Cox regression method for 34 DEGs, a three-gene signature (complement factor H related 3 [CFHR3], egl-9 family hypoxia inducible factor 3 [EGLN3], and chromogranin A [CHGA]) was constructed and had prognostic value to predicted outcome of patients with HCC. This three-gene signature was suitable for classifying patients with HCC in the International Cancer Genome Consortium. CFHR3 shows remarkable diagnostic value in HCC. Hypoxia decreased CFHR3 expression, but increased HCC cell proliferation and motility. Overexpression of CFHR3 in HCC cells under hypoxia reversed the stimulatory effects of hypoxia and suppressed cell proliferation and metastasis in vivo. In conclusion, we identified a novel hypoxia-driven gene signature (CFHR3, EGLN3, and CHGA) for reliable prognostic prediction of HCC, and demonstrated that overexpression of CFHR3 may be a potential strategy to overcome hypoxia and treat HCC.

Keywords: CFHR3; HCC; Hypoxia-driven gene; prognostic prediction.


Conflict of interest statement

No potential conflict of interest was reported by the author(s).

Figures

None
Graphical abstract
Figure 1.
Figure 1.
Analysis of the landscape between high- and low-hypoxia hepatocellular carcinoma (HCC). (a) Kaplan–Meier plot analysis for the overall survival of patients with high- and low-hypoxia HCC. (b) Volcano plot exhibiting changes in differentially expressed genes (DEGs) between high- and low-hypoxia HCC. (c) Heatmap plots exhibiting DEGs in high- and low-hypoxia HCC. (d) Gene set enrichment analysis (GSEA) analysis for the enrichment of hallmark terms between high- and low-hypoxia HCC.
Figure 2.
Figure 2.
Screening of important hypoxia-driven DEGs in HCC tissues. (a) Volcano plot showing changes in DEGs between HCC tissues and adjacent non-tumor tissues. (b) Volcano plot exhibiting DEGs between HCC tissues from stage III–IV patients and stage I–II patients. (c) Exploration of DEGs that are highly expressed in HCC tissues compared with adjacent non-tumor tissues, especially in HCC with high-hypoxia levels and in patients with stage III–IV HCC. (d) Exploration of DEGs that are poorly expressed in HCC tissues compared with adjacent non-tumor tissues, especially in those with high-hypoxia levels and in patients with stage III–IV HCC. (e) Biological process analysis for the 34-candidate important hypoxia-driven DEGs. (f) Construction of a protein–protein interaction (PPI) network using the 34-candidate important hypoxia-driven DEGs, and 27 of them interacted with each other.
Figure 3.
Figure 3.
Univariate Cox regression analysis and least absolute shrinkage and selector operation (LASSO) penalized Cox regression analysis for the important hypoxia-driven DEGs in HCC tissues. (a) Univariate Cox regression analysis for the 27 important hypoxia-driven DEGs. Red indicates that the genes act as predictors of an unfavorable prognosis, while blue indicates that they act as predictors of a favorable prognosis in The Cancer Genome Atlas (TCGA) training cohort. (b,c) LASSO penalized Cox regression analysis exhibiting the seven important hypoxia-driven genes.
Figure 4.
Figure 4.
Construction and examination of the risk model in TCGA training cohort. (a) Multivariate COX regression analysis for egl-9 family hypoxia inducible factor 3 (EGLN3), chromogranin A (CHGA), and chromogranin A (CFHR3). Red indicates that the genes act as predictors of an unfavorable prognosis, while blue indicates that they act as predictors of a favorable prognosis in TCGA training cohort. The risk model was constructed by these three genes. (b) HCC samples in TCGA were divided into low-risk and high-risk groups. (c) Kaplan–Meier plot analysis of the overall survival rate in low-risk and high-risk patients with HCC in TCGA. (d, e) Receiver operating characteristic (ROC) curves showing the diagnostic value of the risk model for the 3-year and 5-year survival rates of patients with HCC in TCGA. (f) Survival time and status of each HCC patient in TCGA cohort. (g) Expression levels of CHGA, EGLN3 and CFHHR3 in HCC tissues from patients with high-risk and low-risk scores in TCGA.
Figure 5.
Figure 5.
Examination of the risk model in the test cohort of the International Cancer Genome Consortium (ICGC). (a) Univariate Cox regression analysis for EGLN3, CHGA and CFHR3 in patients with HCC in the ICGC. Red indicates that the genes act as predictors of an unfavorable prognosis, while blue indicates that act as predictors of a favorable prognosis in the test cohort ICGC. (b) HCC samples in the ICGC were divided into low-risk and high-risk groups. (c) Kaplan–Meier plot analysis of the overall survival rate of low-risk and high-risk group patients with HCC in the ICGC. (d,e) ROC curves showing the diagnostic value of the risk model for the 3-year and 5-year survival rates of Patients with HCC in the ICGC. (f) Survival time and status of each HCC patient in the ICGC cohort. (g) Expression levels of CHGA, EGLN3, and CFHHR3 in HCC tissues from patients with high-risk and low-risk scores in the ICGC.
Figure 6.
Figure 6.
GSEA analysis of target genes in TCGA. GSEA of (a) CFHR3, (b) CHGA, (c) EGLN3.
Figure 7.
Figure 7.
Diagnostic value of target genes (CFHR3, EGLN3, and CHGA) to distinguish the serum samples from patients with HCC and those from healthy controls.
Figure 8.
Figure 8.
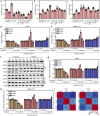
Analysis of the expression model of CFHR3, EGLN3 and CHGA under hypoxia. qRT-PCR was performed to detect the mRNA levels of CFHR3 (a), EGLN3 (b) and CHGA (c) in HCC cells lines. (d, e) qRT-PCR was performed to detect the mRNA levels OF CFHR3, EGLN3 and CHGA under normoxia and hypoxia for 0 h, 12 h, 24 h, 36 h and 48 h. (F, G and H) Western blot was performed to detect the protein levels OF CFHR3, EGLN3 and CHGA under normoxia and hypoxia for 0 h, 12 h, 24 h, 36 h and 48 h. (i) The co-expression relationship between CFHR3, EGLN3 and CHGA in HCC tissues in both TCGA and ICGC database.
Figure 9.
Figure 9.
Exploration of the biological functions of CFHR3 in HCC cells in vitro. (a) Immunohistochemical staining demonstrates that CFHR3 expression is decreased in HCC tissues with high expression levels of hypoxia inducible factor 1 subunit alpha (HIF1A) and carbonic anhydrase 9 (CA9). (b-c) Western blot was used to detect the expression of CFHR3 in HCC cells in the blank control group (BC, without any treatment; cultured under normoxia and hypoxia), in the negative control group (NC, transfected with vector; cultured under normoxia and hypoxia) and in the CFHR3 overexpressing group (CFHR3-OE; cultured under hypoxia). (d-e) 5-ethynyl-2’-deoxyuridine (EdU) assays were used to detect the effects of CFHR3 on HCC cell proliferation under hypoxia. (f-g) Colony formation assays were used to detect the effects of CFHR3 on HCC cell colony formation under hypoxia. (h-i) Transwell assays were used to detect the effects of CFHR3 on HCC cell invasiveness under hypoxia. **P < 0.01.
Figure 10.
Figure 10.
Exploration of the biological functions of CFHR3 in HCC cells in vivo. (a, b) The proliferation of HepG2 cells with CFHR3 overexpression and NC cells in vivo. (c) Expression levels of HIF1α, CA9, CFHR3, and proliferating cell nuclear antigen (PCNA) in tumor tissues derived from HepG2 cells with CFHR3 overexpression and NC cells. (d, e) Metastatic foci in the lungs from mice injected with SMMC-7721 cells with CFHR3 overexpression and NC cells. **P < 0.01.

References

    1. Serper M, Parikh ND, Thiele G, et al. Patient-reported outcomes in HCC: a scoping review by the practice metrics committee of the American association for the study of liver diseases. Hepatology. 2022; DOI:10.1002/hep.32313. - DOI - PMC - PubMed
    1. Llovet JM, Montal R, Sia D, et al. Molecular therapies and precision medicine for hepatocellular carcinoma. Nat Rev Clin Oncol. 2018;15(10):599–616. - PubMed
    1. Huang A, Yang XR, Chung WY, et al. Targeted therapy for hepatocellular carcinoma. Signal Transduct Target Ther. 2020;5(1):146. - PMC - PubMed
    1. Wang T, Zhang KH.. New blood biomarkers for the diagnosis of AFP-negative hepatocellular carcinoma. Front Oncol. 2020;10:1316. - PMC - PubMed
    1. Jing X, Yang F, Shao C, et al. Role of hypoxia in cancer therapy by regulating the tumor microenvironment. Mol Cancer. 2019;18(1):157. - PMC - PubMed

Substances