

Biomarker interaction selection and disease detection based on multivariate gain ratio
- PMID: 35550010
- PMCID: PMC9103137
- DOI: 10.1186/s12859-022-04699-7
Biomarker interaction selection and disease detection based on multivariate gain ratio
Abstract
Background: Disease detection is an important aspect of biotherapy. With the development of biotechnology and computer technology, there are many methods to detect disease based on single biomarker. However, biomarker does not influence disease alone in some cases. It's the interaction between biomarkers that determines disease status. The existing influence measure I-score is used to evaluate the importance of interaction in determining disease status, but there is a deviation about the number of variables in interaction when applying I-score. To solve the problem, we propose a new influence measure Multivariate Gain Ratio (MGR) based on Gain Ratio (GR) of single-variate, which provides us with multivariate combination called interaction.
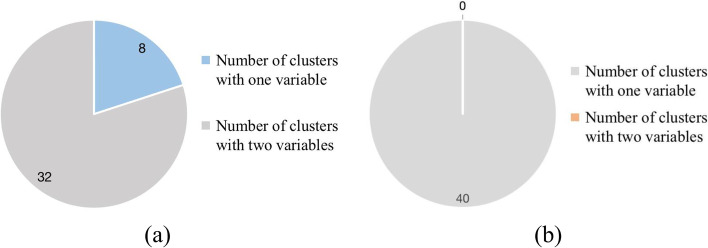
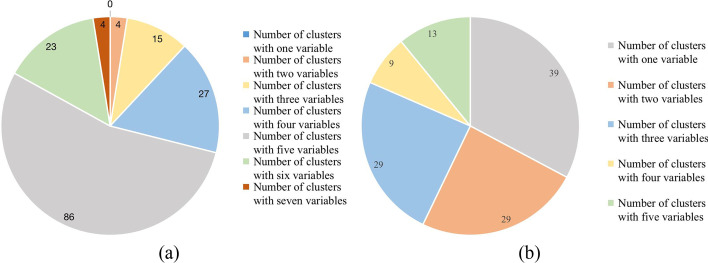
Results: We propose a preprocessing verification algorithm based on partial predictor variables to select an appropriate preprocessing method. In this paper, an algorithm for selecting key interactions of biomarkers and applying key interactions to construct a disease detection model is provided. MGR is more credible than I-score in the case of interaction containing small number of variables. Our method behaves better with average accuracy [Formula: see text] than I-score of [Formula: see text] in Breast Cancer Wisconsin (Diagnostic) Dataset. Compared to the classification results [Formula: see text] based on all predictor variables, MGR identifies the true main biomarkers and realizes the dimension reduction. In Leukemia Dataset, the experiment results show the effectiveness of MGR with the accuracy of [Formula: see text] compared to I-score with accuracy [Formula: see text]. The results can be explained by the nature of MGR and I-score mentioned above because every key interaction contains a small number of variables in Leukemia Dataset.
Conclusions: MGR is effective for selecting important biomarkers and biomarker interactions even in high-dimension feature space in which the interaction could contain more than two biomarkers. The prediction ability of interactions selected by MGR is better than I-score in the case of interaction containing small number of variables. MGR is generally applicable to various types of biomarker datasets including cell nuclei, gene, SNPs and protein datasets.
Keywords: Biomarker interaction; Disease detection; Multivariate gain ratio.
© 2022. The Author(s).
Conflict of interest statement
The authors declare that they have no competing interests.
Figures
Similar articles
-
A deterministic equation to predict the accuracy of multi-population genomic prediction with multiple genomic relationship matrices.Genet Sel Evol. 2020 Apr 28;52(1):21. doi: 10.1186/s12711-020-00540-y. Genet Sel Evol. 2020. PMID: 32345213 Free PMC article.
-
Interpreting comprehensive two-dimensional gas chromatography using peak topography maps with application to petroleum forensics.Chem Cent J. 2016 Nov 28;10:75. doi: 10.1186/s13065-016-0211-y. eCollection 2016. Chem Cent J. 2016. PMID: 27994639 Free PMC article.
-
Simulation Study of Novel Charge-Plasma Based ArcTFET for Sensing the Breast Cancer Biomarker (C-erbB-2) in Serum.IEEE Trans Nanobioscience. 2023 Jul;22(3):554-561. doi: 10.1109/TNB.2022.3216505. Epub 2023 Jun 29. IEEE Trans Nanobioscience. 2023. PMID: 36269918
-
Sufficient dimension reduction with additional information.Biostatistics. 2016 Jul;17(3):405-21. doi: 10.1093/biostatistics/kxv051. Epub 2015 Dec 24. Biostatistics. 2016. PMID: 26704765
-
Efficacy of Hypochlorite as a Disinfestant Against Fungal Pathogens in Agricultural and Horticultural Plant Production: A Systematic Review and Meta-Analysis.Phytopathology. 2021 Aug;111(8):1369-1379. doi: 10.1094/PHYTO-05-20-0201-R. Epub 2021 Sep 11. Phytopathology. 2021. PMID: 33369479
Cited by
-
GOAT: Gene-level biomarker discovery from multi-Omics data using graph ATtention neural network for eosinophilic asthma subtype.Bioinformatics. 2023 Oct 3;39(10):btad582. doi: 10.1093/bioinformatics/btad582. Bioinformatics. 2023. PMID: 37740295 Free PMC article.
References
-
- Shao H, Burrage LC, Sinasac DS, Hill AE, Ernest SR, O’Brien W, Courtland H-W, Jepsen KJ, Kirby A, Kulbokas E, et al. Genetic architecture of complex traits: large phenotypic effects and pervasive epistasis. Proc Natl Acad Sci. 2008;105(50):19910–19914. doi: 10.1073/pnas.0810388105. - DOI - PMC - PubMed
MeSH terms
Substances
LinkOut - more resources
Full Text Sources
Medical
