. 2022 May 12:11:e73223.
doi: 10.7554/eLife.73223.

CREB5 reprograms FOXA1 nuclear interactions to promote resistance to androgen receptor-targeting therapies

Affiliations

CREB5 reprograms FOXA1 nuclear interactions to promote resistance to androgen receptor-targeting therapies

Justin H Hwang et al. Elife. .

Abstract

Metastatic castration-resistant prostate cancers (mCRPCs) are treated with therapies that antagonize the androgen receptor (AR). Nearly all patients develop resistance to AR-targeted therapies (ARTs). Our previous work identified CREB5 as an upregulated target gene in human mCRPC that promoted resistance to all clinically approved ART. The mechanisms by which CREB5 promotes progression of mCRPC or other cancers remains elusive. Integrating ChIP-seq and rapid immunoprecipitation and mass spectroscopy of endogenous proteins, we report that cells overexpressing CREB5 demonstrate extensive reprogramming of nuclear protein-protein interactions in response to the ART agent enzalutamide. Specifically, CREB5 physically interacts with AR, the pioneering actor FOXA1, and other known co-factors of AR and FOXA1 at transcription regulatory elements recently found to be active in mCRPC patients. We identified a subset of CREB5/FOXA1 co-interacting nuclear factors that have critical functions for AR transcription (GRHL2, HOXB13) while others (TBX3, NFIC) regulated cell viability and ART resistance and were amplified or overexpressed in mCRPC. Upon examining the nuclear protein interactions and the impact of CREB5 expression on the mCRPC patient transcriptome, we found that CREB5 was associated with Wnt signaling and epithelial to mesenchymal transitions, implicating these pathways in CREB5/FOXA1-mediated ART resistance. Overall, these observations define the molecular interactions among CREB5, FOXA1, and pathways that promote ART resistance.

Keywords: CREB5; FOXA1; RIME; cancer biology; chromosomes; gene expression; human; prostate cancer; therapy resistance; transcription reprogramming.


Conflict of interest statement

JH is a consultant for Astrin Biosciences, Principal Investigator for Caris Life Sciences Genitourinary disease working group, RA, JS, SB, ML, TA, LS, CR, ST, HB, SM, JR, SK, AC, JK, JS, SK, JD, MF No competing interests declared, EV serves as Advisory/Consulting for Tango Therapeutics, Genome Medical, Invitae, Enara Bio, Janssen, Manifold Bio, Monte Rosa, received research support from Novartis, BMS, has equity with Tango Therapeutics, Genome Medical, Syapse, Enara Bio, Manifold Bio, Microsoft, Monte Rosa, receives travel reimbursement from Roche/Genentech, and holds patents including Institutional patents filed on chromatin mutations and immunotherapy response, and methods for clinical interpretation, WH Reviewing editor, eLife

Figures

Figure 1.
Figure 1.. CREB5 overexpression and nuclear interactions that are reprogrammed upon androgen receptor-targeted therapy (ART) treatments.
(A) Analysis of enzalutamide resistance genes in LNCaP cells based on a genome-scale screen, including 17,255 open reading frames (ORFs). Z-scores are displayed for the experimental arms conducted in either standard culture (FCS, x-axis) or treatment (enzalutamide +CSS, y-axis) conditions. CREB5 and other enzalutamide -specific hits (Z > 3) and their proliferation scores are highlighted in red. (B) A model that depicts changes in chromatin -associated interactions of CREB5 that occur post enzalutamide treatment. Bottom,: CREB5 ChIP-seq data is presented in accordance to three categories of CREB5 binding behavior. Categories are grouped by significant changes by enzalutamide treatments. (C) GIGGLE analyses predicts transcription factors that are CREB5-bound based on the ChIP-seq experiments as categorized in B. (D) Rapid immunoprecipitation and mass spectroscopy of endogenous proteins (RIME) experiments were performed to identify CREB5 interaction profiles in control or enzalutamide -treated cultures. The common proteins identified by both RIME and GIGGLE are highlighted for the retained and gained groups.
Figure 1—figure supplement 1.
Figure 1—figure supplement 1.. LNCaP cells overexpressing CREB5 or luciferase negative control (LUC) were transduced with lentivirus with shRNAs that target a GFP sequence or three distinct regions of androgen receptor (AR).
Cell viability was determined with standard error of the mean displayed (left). The degree of AR suppression is shown in immunoblots (right). V5 indicates expression of CREB5 or luciferase and tubulin is a loading control.
Figure 2.
Figure 2.. CREB5 and FOXA1 share chromatin-associated functions in metastatic castration-resistant prostate cancer (mCRPC) based on binding sequences and rapid immunoprecipitation and mass spectroscopy of endogenous proteins (RIME) interaction profiles.
(A) RIME analysis depicting the interaction profiles of FOXA1 (greay), CREB5 (red), and CREB3 (blue). Proteins that interact with FOXA1 and CREB5 are also shown. The Pearson correlation coefficients (R) are shownn. (B) Venn diagram depicting unique peptide interactions that are either independent or shared between CREB5 (red), CREB3 (blue), and FOXA1 (greay). Peptides identified to be induced by enzalutamide are highlighted as Retained/Gained. (C) ChIP-seq experiments were used to examine CREB5 and FOXA1 interactions in LNCaP cells with or without enzalutamide treatments. The Venn diagram depicts total binding sites in each condition and the overlapping sites and percentage of shared transcription regulatory elements. (D) CREB5 -bound sites are analyzed and represented as AR binding sites (ARBS) observed in clinical samples. This includes ARBS exclusive in normal (NARBS), tumor (TARBS), mCRPC (metARBS), all tissues (UARBS), as well as all non -ARBS (OTHER). E. CREB5 -bound ARBs are further classified and depicted as % of FOXA1 sites observed in mCRPC (y-axis). The colors represent the overall percentage of FOXA1 sites while the black represents non -FOXA1 sites.
Figure 3.
Figure 3.. A loss of resistant CREB5 mutant was identified and determines transcription co-regulators associated with androgen receptor-targeted therapy (ART)-resistant proliferation.
(A) Alignment of CREB5 sequence with ATF2, ATF7, and CREB3, highlighting the DNA binding domains (blue), CRCT2 binding domains (red), and JUN/ATF binding domains (yellow). (B) Population doubling (y-axis) of LNCaP cells overexpressing wild-type CREB5 variants (red), CREB5 JUN/FOS-binding mutants (purple), and a luciferase negative control (green) in 10 μM enzalutamide. V5 expression represents V5-tagged CREB5 protein levels. Actin is a loading control. (C) Rapid immunoprecipitation and mass spectroscopy of endogenous proteins (RIME) analysis depicting the interaction profiles of wild-type CREB5 (red), CREB5 L434P (orange), and CREB3 (blue). CREB5 interactions that were reduced, retained, or gained upon enzalutamide treatments are depicted. The Pearson correlation coefficients (R) are shown. (D) A heatmap depicts the RIME interactions of luciferase control, wild-type CREB5, L434P CREB5, and CREB3. Several canonical AR co-factors (AR, FOXA1, HOXB13) interact with both CREB5 and CREB5 L434P and are shown.
Figure 4.
Figure 4.. TBX3 and NFIC are key regulators in prostate cancer cells including those that are enzalutamide resistant.
(A) Analysis of genome-scale RNAi screening data ranking the average dependency of 16,869 genes (x-axis) in androgen receptor (AR)-positive (Lleft) and AR-negative (Rrightt.) prostate cancer cell lines (Project Achilles 2.20.1). Average DEMETER score (y-axis) indicates the dependency correlations of FOXA1 and CREB5-interacting proteins. A negative DEMTER score indicates gene dependency in these specific PC cell lines. (B) Average ranks and percentiles based on DEMETER dependency scores are shown for selected genes in AR-positive, AR-negative, and non-PC cell lines. (C). shRNA was utilized to deplete experimental (NFIC, TBX3), negative (GFP) or positive controls (FOXA1) genes in LNCaP cells overexpressing CREB5. The overall cell numbers are depicted post -perturbation. A representative immunoblots depicts depletion of proteins from the proliferation experiments. Tubulin was used as a loading control. The relative depletion is quantified based on the average of all experiments after normalizing to tubulin. (D) CRISPR-Cas9 was utilized to deplete experimental (NFIC, TBX3), negative (GFP) or positive controls (FOXA1) genes in LNCaP cells that spontaneously developed resistance to enzalutamide. The overall cell numbers are depicted post -perturbation. A representative immunoblots depicts depletion of proteins from (C, upper panel) in proliferation experiments. Tubulin was used as a loading control. The relative depletion is quantified based on the average of all experiments after normalizing to tubulin. (E) ChIP-seq data from NFIC and TBX3 was analyzed to predict interaction with CREB5 or FOXA1 motifs. Enriched motifs, the targeted cell lines, and significance levels are depicted.
Figure 5.
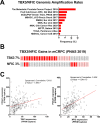
Figure 5.. TBX3 and NFIC are amplified in prostate cancer cells.
(A) The genomic amplification rates of TBX3 and NFIC are examined in various prostate cancer studies. (B) In one metastatic castration-resistant prostate cancer (mCRPC) study, the rates of TBX3, NFIC, and FOXA1 gains are depicted. (C and D). The expression of TBX and NFIC are compared in one mCRPC study in which the regression line, Spearman’s correlation coefficients, and q-values are depicted.
Figure 6.
Figure 6.. Integrative analysis of CREB5 activity.
(A) A workflow of the informatics analysis of CREB5 using in vitro and metastatic castration-resistant prostate cancer (mCRPC) data. (B) Spectrum of shared CREB5 and FOXA1 protein interactions identified by rapid immunoprecipitation and mass spectroscopy of endogenous proteins (RIME) are analyzed. The enriched pathways and statistical significance are presented for specific pathways. (C) Gene Set Enrichment Analysis (GSEA) analysis of RNA-seq data from CREB5 or luciferase overexpressing androgen receptor (AR)-positive (LNCaP and LAPC-4) and AR-negative (PC3, DU145) prostate cancer cells. (D) Based on RNA-seq from clinical mCRPC, Spearman’s correlation coefficients compare CREB5 expression with EMT, betaβ-catenin, and G2/M signaling. Correlation coefficient values (Rho, σ, x-axis) for CREB5 against each gene, as represented by a single dot, and the statistical significance (negative log of p-value, y-axis) areis displayed. Pp-vValue is marked (red dotted line).
Figure 7.
Figure 7.. A molecular model of the CREB5 complex and transcription promoting androgen receptor-targeted therapy (ART) resistance.
Author response image 1.
Author response image 1.. A.
Figure adapted from He et al. (He et al., Nat Med, 2021). Single cells from a mCRPC patient pre- and post-treatment were examined based on single cell RNA-seq approach and the most enriched pathway was EMT after enzalutamide treatment. B. AR expression levels were examined in the sample tumor cells, which increased with statistical significance (Student’s t-test).
Author response image 2.
Author response image 2.. Left.
V5-tagged CREB5 was targeted for immunoprecipitation in cell lysates in vehicle control (DMSO) or enzalutamide treated (ENZ) LNCaP cells. TBX3 and NFIC were detected in the total lysate (input) and precipitates (IP) using immunoblots. IgG was used as a negative precipitation control. Right. FOXA1 was targeted in enzalutamide treated cells in a Co-IP experiment. CREB5 and FOXA1 were detected in the total lysate (input) and precipitates (IP) using immunoblots. IgG was used as a negative precipitation control.
Author response image 3.
Author response image 3.. CREB5 amplifications (red) and deletions (blue) are examined and displayed across prostate cancer cohorts as of 12.2.2021.
In total, there were variable amplification rates and we only detected one homozygous deletion in a primary prostate tumor in the 2018 study that included 680 primary prostate cancer samples and 333 mCRPC. Adapted from cBioportal.

Similar articles

Cited by

References

    1. Abida W, Cyrta J, Heller G, Prandi D, Armenia J, Coleman I, Cieslik M, Benelli M, Robinson D, Van Allen EM, Sboner A, Fedrizzi T, Mosquera JM, Robinson BD, De Sarkar N, Kunju LP, Tomlins S, Wu YM, Nava Rodrigues D, Loda M, Gopalan A, Reuter VE, Pritchard CC, Mateo J, Bianchini D, Miranda S, Carreira S, Rescigno P, Filipenko J, Vinson J, Montgomery RB, Beltran H, Heath EI, Scher HI, Kantoff PW, Taplin ME, Schultz N, deBono JS, Demichelis F, Nelson PS, Rubin MA, Chinnaiyan AM, Sawyers CL. Genomic correlates of clinical outcome in advanced prostate cancer. PNAS. 2019;116:11428–11436. doi: 10.1073/pnas.1902651116. - DOI - PMC - PubMed
    1. Adams EJ, Karthaus WR, Hoover E, Liu D, Gruet A, Zhang Z, Cho H, DiLoreto R, Chhangawala S, Liu Y, Watson PA, Davicioni E, Sboner A, Barbieri CE, Bose R, Leslie CS, Sawyers CL. FOXA1 mutations alter pioneering activity, differentiation and prostate cancer phenotypes. Nature. 2019;571:408–412. doi: 10.1038/s41586-019-1318-9. - DOI - PMC - PubMed
    1. Alumkal JJ, Sun D, Lu E, Beer TM, Thomas GV, Latour E, Aggarwal R, Cetnar J, Ryan CJ, Tabatabaei S, Bailey S, Turina CB, Quigley DA, Guan X, Foye A, Youngren JF, Urrutia J, Huang J, Weinstein AS, Friedl V, Rettig M, Reiter RE, Spratt DE, Gleave M, Evans CP, Stuart JM, Chen Y, Feng FY, Small EJ, Witte ON, Xia Z. Transcriptional profiling identifies an androgen receptor activity-low, stemness program associated with enzalutamide resistance. PNAS. 2020;117:12315–12323. doi: 10.1073/pnas.1922207117. - DOI - PMC - PubMed
    1. Amir S, Simion C, Umeh-Garcia M, Krig S, Moss T, Carraway KL, Sweeney C. Regulation of the T-box transcription factor Tbx3 by the tumour suppressor microRNA-206 in breast cancer. British Journal of Cancer. 2016;114:1125–1134. doi: 10.1038/bjc.2016.73. - DOI - PMC - PubMed
    1. Armenia J, Wankowicz SAM, Liu D, Gao J, Kundra R, Reznik E, Chatila WK, Chakravarty D, Han GC, Coleman I, Montgomery B, Pritchard C, Morrissey C, Barbieri CE, Beltran H, Sboner A, Zafeiriou Z, Miranda S, Bielski CM, Penson AV, Tolonen C, Huang FW, Robinson D, Wu YM, Lonigro R, Garraway LA, Demichelis F, Kantoff PW, Taplin M-E, Abida W, Taylor BS, Scher HI, Nelson PS, de Bono JS, Rubin MA, Sawyers CL, Chinnaiyan AM, PCF/SU2C International Prostate Cancer Dream Team. Schultz N, Van Allen EM. The long tail of oncogenic drivers in prostate cancer. Nature Genetics. 2018;50:645–651. doi: 10.1038/s41588-018-0078-z. - DOI - PMC - PubMed

Publication types

MeSH terms

Substances

Associated data