

The severity of portal hypertension by a non-invasive assessment: acoustic structure quantification analysis of liver parenchyma
- PMID: 35550032
- PMCID: PMC9097305
- DOI: 10.1186/s12880-022-00817-2
The severity of portal hypertension by a non-invasive assessment: acoustic structure quantification analysis of liver parenchyma
Abstract
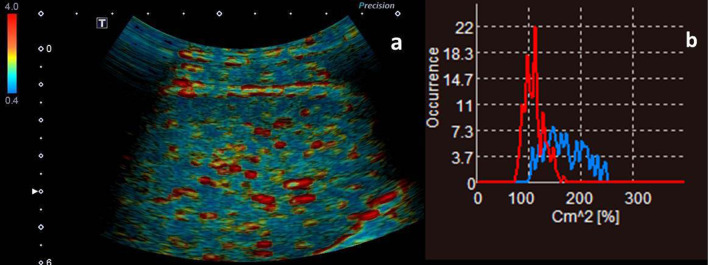
Background: Acoustic structure quantification (ASQ) has been applied to evaluate liver histologic changes by analyzing the speckle pattern seen on B-mode ultrasound. We aimed to assess the severity of portal hypertension (PHT) through hepatic ultrasonography.
Methods: Sixty patients diagnosed with PHT and underwent surgical treatment with portosystemic shunts were enrolled. Portal pressure (PP) was measured intraoperatively. Patients were divided into subgroups according to the severity of gastroesophageal varices and Child-Pugh class. Three difference ratio (Cm2) values on ASQ histogram mode were analyzed for their relationships with PP, degree of gastroesophageal varices and Child-Pugh liver function. Thirty healthy volunteers matched with the patients for gender and age were enrolled as controls. Comparisons among groups and correlation of the parameters with PP were analyzed. Area under the receive operating characteristic curve was used to evaluate the predicting value of ASQ parameters.
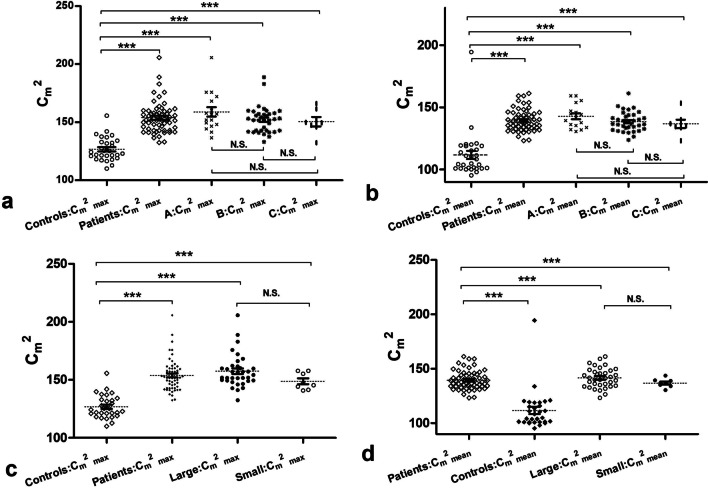
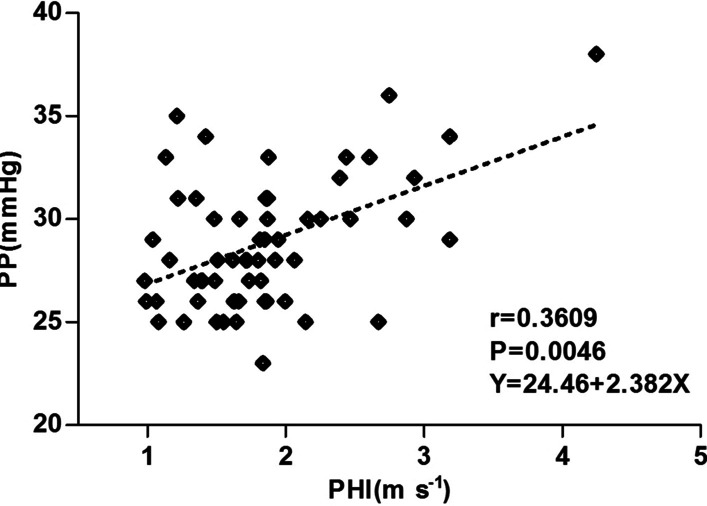
Results: In the patients, the ASQ parameters peak Cm2 (Cm2max), mean Cm2 (Cm2mean) and the highest occurred Cm2 value of the obtained red curve (RmaxCm2) were all greatly increased (P < 0.0001, P < 0.0001, P = 0.027). Multiple comparisons indicated that, regardless of Child-Pugh class and degree of gastroesophageal varices, the patients had significantly increased Cm2max and Cm2mean compared with the controls (all P < 0.0001). No differences among subgroups were observed. Cm2max was significantly statistically correlated with PP (r = 0.3505, P < 0.01), degree of varices (r = 0.4998, P < 0.0001). Youden's index for Cm2max with a cut-off value of 140.3 for predicting the presence of PHT, gastroesophageal varices and liver function equal to or worse than Child-Pugh class B were 0.8, 0.91 and 0.84, respectively.
Conclusions: ASQ analysis of ultrasonographic images may have a role in the evaluation of the severity of PHT by detecting liver histologic changes in the speckle pattern caused by cirrhosis.
Keywords: Acoustic; Gastroesophageal varices; Noninvasive; Portal hypertension; Ultrasound.
© 2022. The Author(s).
Conflict of interest statement
The authors declare that they have no competing interests.
Figures


References
-
- Shao R, Li Z, Wang J, Qi R, Liu Q, Zhang W, Mao X, Song X, Li L, Liu Y, et al. Hepatic venous pressure gradient-guided laparoscopic splenectomy and pericardial devascularisation versus endoscopic therapy for secondary prophylaxis for variceal rebleeding in portal hypertension (CHESS1803): study protocol of a multicenter randomised controlled trial in China. BMJ Open. 2020;10(6):e030960. doi: 10.1136/bmjopen-2019-030960. - DOI - PMC - PubMed
Publication types
MeSH terms
LinkOut - more resources
Full Text Sources
Medical
Miscellaneous
