. 2022 May 13;20(1):112.
doi: 10.1186/s12915-022-01309-z.

Comparative whole-genome transcriptome analysis in renal cell populations reveals high tissue specificity of MAPK/ERK targets in embryonic kidney

Affiliations

Comparative whole-genome transcriptome analysis in renal cell populations reveals high tissue specificity of MAPK/ERK targets in embryonic kidney

Kristen Kurtzeborn et al. BMC Biol. .

Abstract

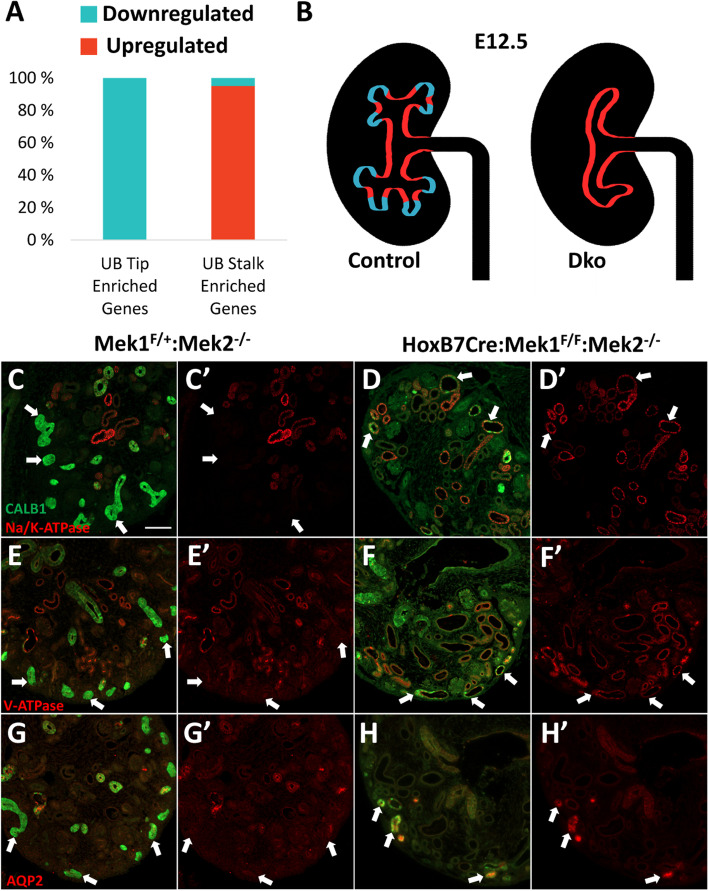
Background: MAPK/ERK signaling is a well-known mediator of extracellular stimuli controlling intracellular responses to growth factors and mechanical cues. The critical requirement of MAPK/ERK signaling for embryonic stem cell maintenance is demonstrated, but specific functions in progenitor regulation during embryonic development, and in particular kidney development remain largely unexplored. We previously demonstrated MAPK/ERK signaling as a key regulator of kidney growth through branching morphogenesis and normal nephrogenesis where it also regulates progenitor expansion. Here, we performed RNA sequencing-based whole-genome expression analysis to identify transcriptional MAPK/ERK targets in two distinct renal populations: the ureteric bud epithelium and the nephron progenitors.

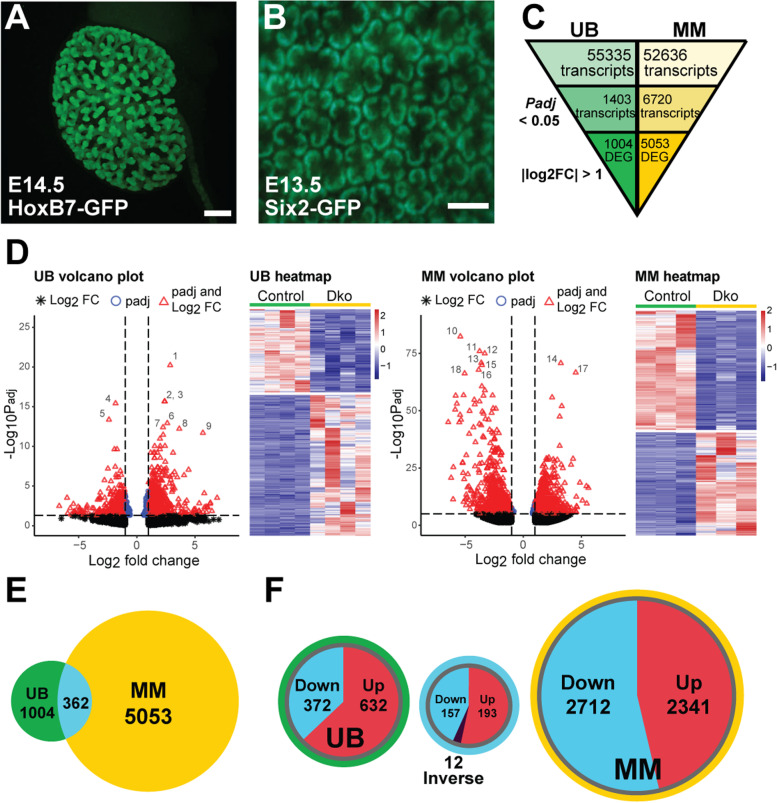
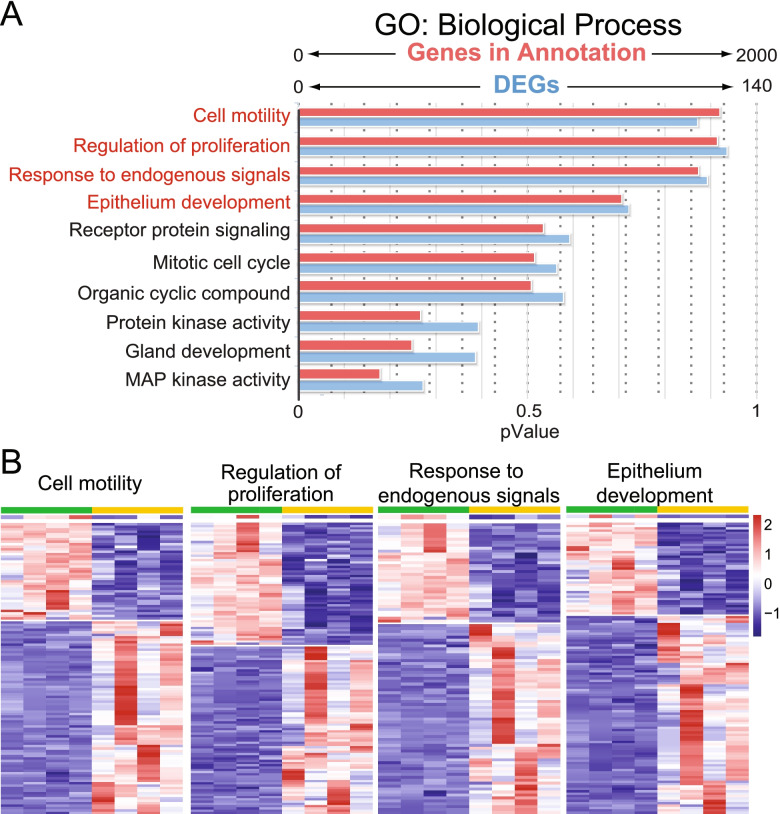
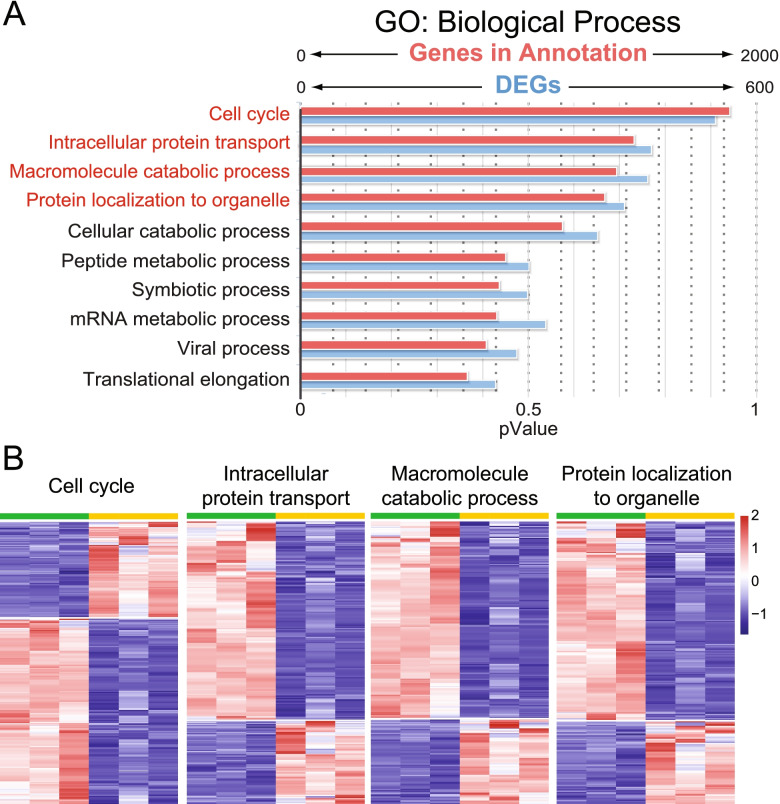
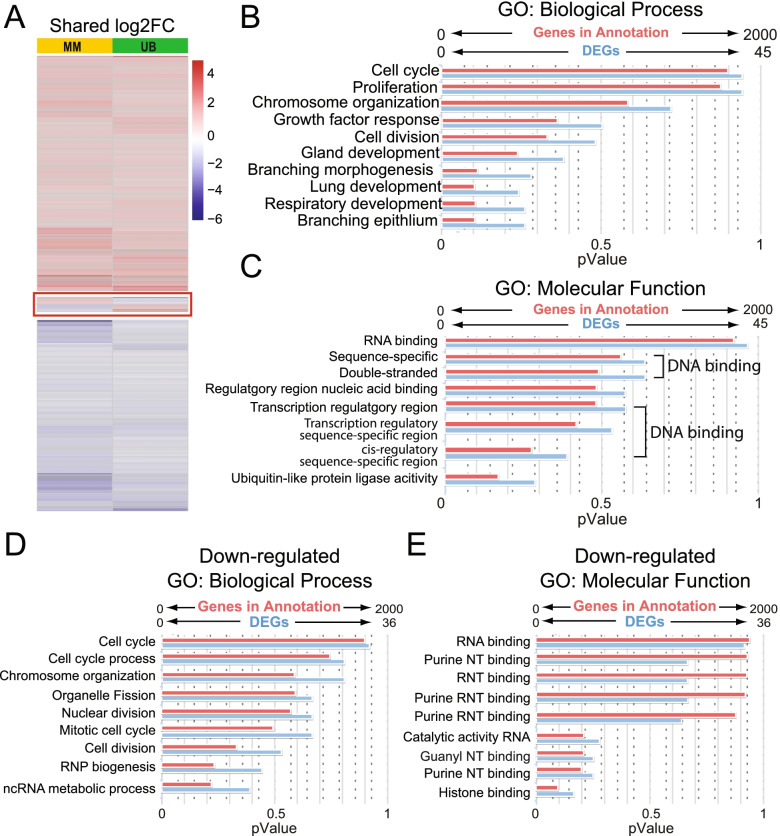
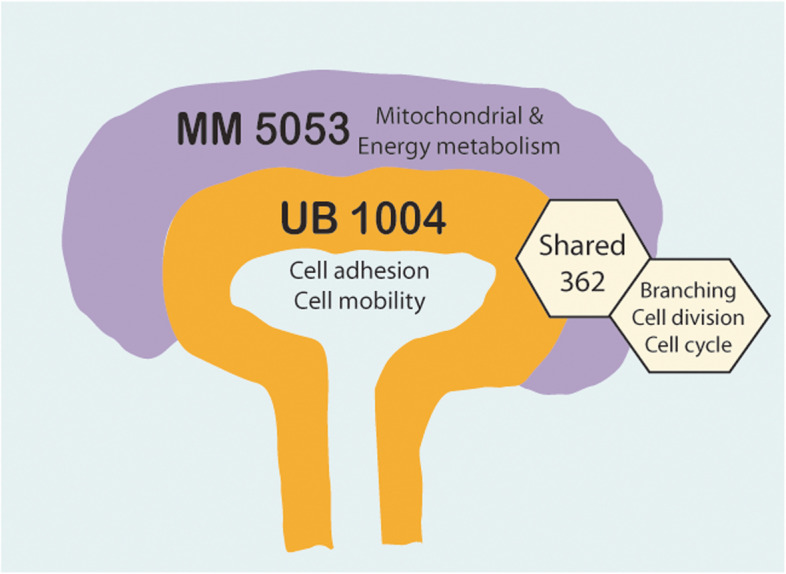
Results: Our analysis revealed a large number (5053) of differentially expressed genes (DEGs) in nephron progenitors and significantly less (1004) in ureteric bud epithelium, reflecting likely heterogenicity of cell types. The data analysis identified high tissue-specificity, as only a fraction (362) of MAPK/ERK targets are shared between the two tissues. Tissue-specific MAPK/ERK targets participate in the regulation of mitochondrial energy metabolism in nephron progenitors, which fail to maintain normal mitochondria numbers in the MAPK/ERK-deficient tissue. In the ureteric bud epithelium, a dramatic decline in progenitor-specific gene expression was detected with a simultaneous increase in differentiation-associated genes, which was not observed in nephron progenitors. Our experiments in the genetic model of MAPK/ERK deficiency provide evidence that MAPK/ERK signaling in the ureteric bud maintains epithelial cells in an undifferentiated state. Interestingly, the transcriptional targets shared between the two tissues studied are over-represented by histone genes, suggesting that MAPK/ERK signaling regulates cell cycle progression and stem cell maintenance through chromosome condensation and nucleosome assembly.

Conclusions: Using tissue-specific MAPK/ERK inactivation and RNA sequencing in combination with experimentation in embryonic kidneys, we demonstrate here that MAPK/ERK signaling maintains ureteric bud tip cells, suggesting a regulatory role in collecting duct progenitors. We additionally deliver new mechanistic information on how MAPK/ERK signaling regulates progenitor maintenance through its effects on chromatin accessibility and energy metabolism.


Conflict of interest statement

The authors declare that they have no competing interests.

Figures

Fig. 1
Fig. 1
Tissue-specific bulk RNA sequencing of MAPK/ERK-deficient renal progenitor populations. A Whole mount image example of a mouse kidney expressing HoxB7Cre-GFP in the ureteric bud (UB) epithelium and collecting ducts at E14.5. White scale bar represents 300 μm. B Example whole mount image of the cortical surface of a mouse kidney expressing Six2-TGC-GFP in the nephron progenitor/metanephric mesenchyme (MM) population at E13.5. White scale bar represents 150 um. C RNA-Seq was separately performed on E12.5 control (n = 4 kidneys) and MAPK/ERK-deficient UB (HoxB7Cre-GFP;Mek1fl/fl/;Mek2−/−, n = 4 kidneys) and E13.5 control (n = 3 kidneys) and MAPK/ERK-deficient nephron progenitors (Six2-TGC-GFP; Mek1fl/fl/;Mek2−/−; n = 3 kidneys). Among the total reads of 55,335 and 52,636 in UB and MM, respectively, 1403 genes in the UB and 6720 in the MM were identified to be significantly differentially expressed with a cutoff of Padj < 0.05. Further filtering with │log2fold change│≥ 1 revealed 1004 differentially expressed genes (DEGs) for UB and 5053 for MM. D Volcano plot and heatmap for DEGs between wildtype and dko populations in the UB (left). Similar to the UB, the volcano plot and heatmap for MM (right) demonstrate clear segregation of the control samples from those lacking MAPK/ERK (dko) activity in UB and MM populations. The most prominent DEGs are numbered in the plots and represent the following genes: 1, Ccdc141; 2, Ifgbp5; 3, Slc40a1; 4, Ccnd1; 5, Etv5; 6, Atp2b4; 7, Samd9I; 8, Scn3b; 9, Xkr4; 10, Hist1h3c; 11, Rpl19; 12, Hist1h1a; 13, Rpl41; 14, mt-Rnr2; 15, Rpsa; 16, Rpl8; 17, Gm28439; and 18, Hist1h4d. Significant DEGs in the volcano plots are marked as red dots with a statistical cutoff of Padj < 0.05 and a magnitude threshold of │log2fold change│≥ 1. Heatmaps show downregulated genes in blue and upregulated genes in red; color intensity corresponds to the degree of differential expression. E Venn diagram shows 362 shared genes with differentially regulated expression in both UB and MM datasets. F Venn diagrams depicting up-/downregulated DEGs in UB and MM populations. Among the 1004 UB DEGs, we identified 372 genes (37%) whose expression was downregulated and 632 genes (63%) which were upregulated. Among the 362 shared DEGs between UB and MM, 157 genes (43%) were downregulated, and 193 genes (53%) were upregulated. Interestingly, 12 genes (3%) were inversely expressed, with six genes upregulated and six genes downregulated. Out of 5053 MM DEGs, 2712 genes (54%) were downregulated, and 2341 genes (46%) were upregulated
Fig. 2
Fig. 2
GO biological analysis of UB dataset. A GO biological process analysis of UB RNA-Seq data (n = 4 kidneys/genotype) was carried out with the ToppFun tool (application of ToppGene Suite). The figure shows the genes identified in our dataset in blue (0–140) and those within annotated functions in ToppFun in red (0–2000). B The heatmap analysis of the top four biological processes identified by ToppFun in the UB dataset reveals clear expressional changes, both down and up, between control (green) and MAPK/ERK-deficient UB (Dko, yellow) within the biological processes of cell motility, proliferation, response to stimulus, and epithelium development. Detailed lists of all biological processes and the genes that make them up are provided in Additional file 4: Table S3
Fig. 3
Fig. 3
GO biological analysis on MM dataset. A GO biological process analysis on MM RNA-Seq data (n = 3 kidneys/genotype) was carried out with the ToppFun tool (application of ToppGene Suite). The figure shows the genes identified in our dataset in blue (0–600) and those within annotated functions in ToppFun in red (0–2000). B Heatmap analysis of the top four biological processes of MM RNA-Seq data. Genes related to cell cycle, intracellular protein transport, macromolecule catabolic processes, and protein localization to organelle have mostly opposite expression between control (green) and MAPK/ERK-deficient nephron progenitors (Dko, yellow). Detailed lists of all biological processes and the genes that make them up are provided in Additional file 4: Table S3
Fig. 4
Fig. 4
Collecting duct and nephron progenitors share a minor pool of genes whose expression is regulated by MAPK/ERK in both tissues. A Heatmap analysis of 362 shared genes in UB and MM. Twelve inversely expressed genes are shown in the middle of the heatmap. B Gene Ontology (GO) biological process analysis of shared genes between UB and MM. C GO molecular function analysis of shared genes between UB and MM. D GO biological process analysis of downregulated shared genes. E GO molecular function analysis of downregulated shared genes. Blue bars represent input DEGs from our RNA-Seq, and red bars represent genes in annotation. Abbreviations: ncRNA; non-coding ribonucleic acid, NT; nucleotide, RNP; ribonucleoprotein, RNT; ribonucleotide.  Detailed lists of all biological processes and the genes that make them up are provided in Additional file 6: Table S5
Fig. 5
Fig. 5
MAPK/ERK-deficient UB tips prematurely differentiate into UB stalk-like cells. A Comparison of differentially expressed genes in UBdko to a published dataset of genes with enriched expression in either the UB tip or UB stalk (Rutledge et al.) revealed that of the previously identified UB tip-enriched genes that are differentially expressed in the UBdko, all (39/39 genes) are downregulated (blue). Of the UB stalk-enriched genes differentially expressed in the UBdko, 95% (78/82 genes) are upregulated (red). B Schematic representation of the gene expression changes between the UBs of wildtype (control) and HoxB7Cre-GFP;Mek1fl/fl;Mek2/− (dko) kidneys at E12.5. It is known that the control kidney has distinct gene expression signatures in the UB tips (blue) compared to the UB stalks (red). Additionally, the control kidney exhibits a stereotypic branching pattern. We have shown previously that in the absence of MAPK/ERK activation, the UB has a noticeable branching defect. Our analysis here revealed that MAPK/ERK-deficient UB epithelium loses the expression of tip specific genes and instead shows upregulation of stalk-enriched genes (n = 4 kidneys/genotype). C–H’ Immunofluorescent staining of the E16.5 kidney paraffin sections. Calbindin-1 (CALB1) labels UB epithelium (green), and arrows indicate CALB1-positive cortical UB epithelium. C-D’ Na/K-ATPase (red), a marker of principal cells in the mature collecting duct, is absent in the cortical UB tips of C, C’ control kidneys but is detected in CALB1-positive cortical UB epithelium in D, D’ UBdko. Similarly, V-ATPase-B1/2 (red), a marker of intercalated cells in the mature collecting duct, is absent in the cortical epithelium of E, E’ control kidneys but localized to cortical epithelium of F, F’ UBdko. G, G’ Aquaporin-2 (AQP2), another marker of intercalated cells, is also absent from control but H, H’ detected in UBdko cortical epithelium. Scale bar, 100 μm
Fig. 6
Fig. 6
Gene expression changes in MAPK/ERK-deficient nephron progenitors suggest defects in mitochondrial functions. A Further heatmap analysis on the MM dataset revealed that mitochondria-related biological processes are affected in the absence of MAPK/ERK activation. The identified genes are listed in Additional file 9: Table S8. B Mitochondrial DNA copy number analysis was performed on control (DMSO, n = 9) and MEK1/2-inhibited (U0126, n = 9) E12.5 kidneys by real-time PCR. Mitochondrial DNA was measured by the analysis of its 12S expression against nuclear DNA quantification by Rbm expression. C Quantification of ATP from mK4 cell line derived from embryonic kidney mesenchyme by LC/MS (n = 4 replicates for each DMSO and U0126). ATP concentrations are normalized against total protein concentration (Additional file 10: Table S9). **p < 5 × 10⁻³, ***p < 5 × 10⁻⁶. D Oxygen consumption rate (OCR) of mK4 cell line was measured by a Seahorse XF analyzer. For the OCR measuring, ATP synthase inhibitor (oligomycin), protonophore uncoupler (FCCP), and ETC inhibitors (rotenone and antimycin A) were added at the indicated points (n = 4 replicates for each DMSO and U0126). E Basal respiration, ATP production, proton leak, maximal respiration, and spare capacity measures are shown in different samples. Error bars represent standard deviation (S.D.). NT, non-treated mK4 cells; DMSO, DMSO-treated mK4 cells as a control; U0126, MEK inhibitor U0126-treated mK4 cells
Fig. 7
Fig. 7
Schematic summary of MAPK/ERK functions in renal progenitor populations. With the help of RNA-Seq and tissue-specific Mek1/2 knockout, kidneys representing MAPK/ERK-deficient ureteric bud (UB) epithelium (orange) and nephron progenitor cells (purple), 1004 and 5053 differentially expressed genes were identified in MM and UB, respectively. Major changes in MM have a profound association with mitochondrial and energy metabolism. In the UB, the majority of changes correlate with cell adhesion and cell mobility functions which our further experimentation demonstrates to result in failure to maintain tip identity, resulting in the premature differentiation of the collecting duct epithelium (not shown here). Most of the changes in the 362 shared genes are related to branching, cell division, and cell cycle

Similar articles

Cited by

References

    1. Zhang W, Liu HT. MAPK signal pathways in the regulation of cell proliferation in mammalian cells. Cell Res. 2002;12(1):9–18. doi: 10.1038/sj.cr.7290105. - DOI - PubMed
    1. McKay MM, Morrison DK. Integrating signals from RTKs to ERK/MAPK. Oncogene. 2007;26(22):3113–3121. doi: 10.1038/sj.onc.1210394. - DOI - PubMed
    1. Roskoski R., Jr ERK1/2 MAP kinases: structure, function, and regulation. Pharmacol Res. 2012;66(2):105–143. doi: 10.1016/j.phrs.2012.04.005. - DOI - PubMed
    1. Miller AD, Curran T, Verma IM. c-fos protein can induce cellular transformation: a novel mechanism of activation of a cellular oncogene. Cell. 1984;36(1):51–60. doi: 10.1016/0092-8674(84)90073-4. - DOI - PubMed
    1. Guzowski JF, McNaughton BL, Barnes CA, Worley PF. Environment-specific expression of the immediate-early gene Arc in hippocampal neuronal ensembles. Nat Neurosci. 1999;2(12):1120–1124. doi: 10.1038/16046. - DOI - PubMed

Publication types