. 2022 Aug;163(2):449-465.
doi: 10.1053/j.gastro.2022.05.007. Epub 2022 May 10.

NOTCH-YAP1/TEAD-DNMT1 Axis Drives Hepatocyte Reprogramming Into Intrahepatic Cholangiocarcinoma

Affiliations

NOTCH-YAP1/TEAD-DNMT1 Axis Drives Hepatocyte Reprogramming Into Intrahepatic Cholangiocarcinoma

Shikai Hu et al. Gastroenterology. 2022 Aug.

Abstract

Background & aims: Intrahepatic cholangiocarcinoma (ICC) is a devastating liver cancer with extremely high intra- and inter-tumoral molecular heterogeneity, partly due to its diverse cellular origins. We investigated clinical relevance and the molecular mechanisms underlying hepatocyte (HC)-driven ICC development.

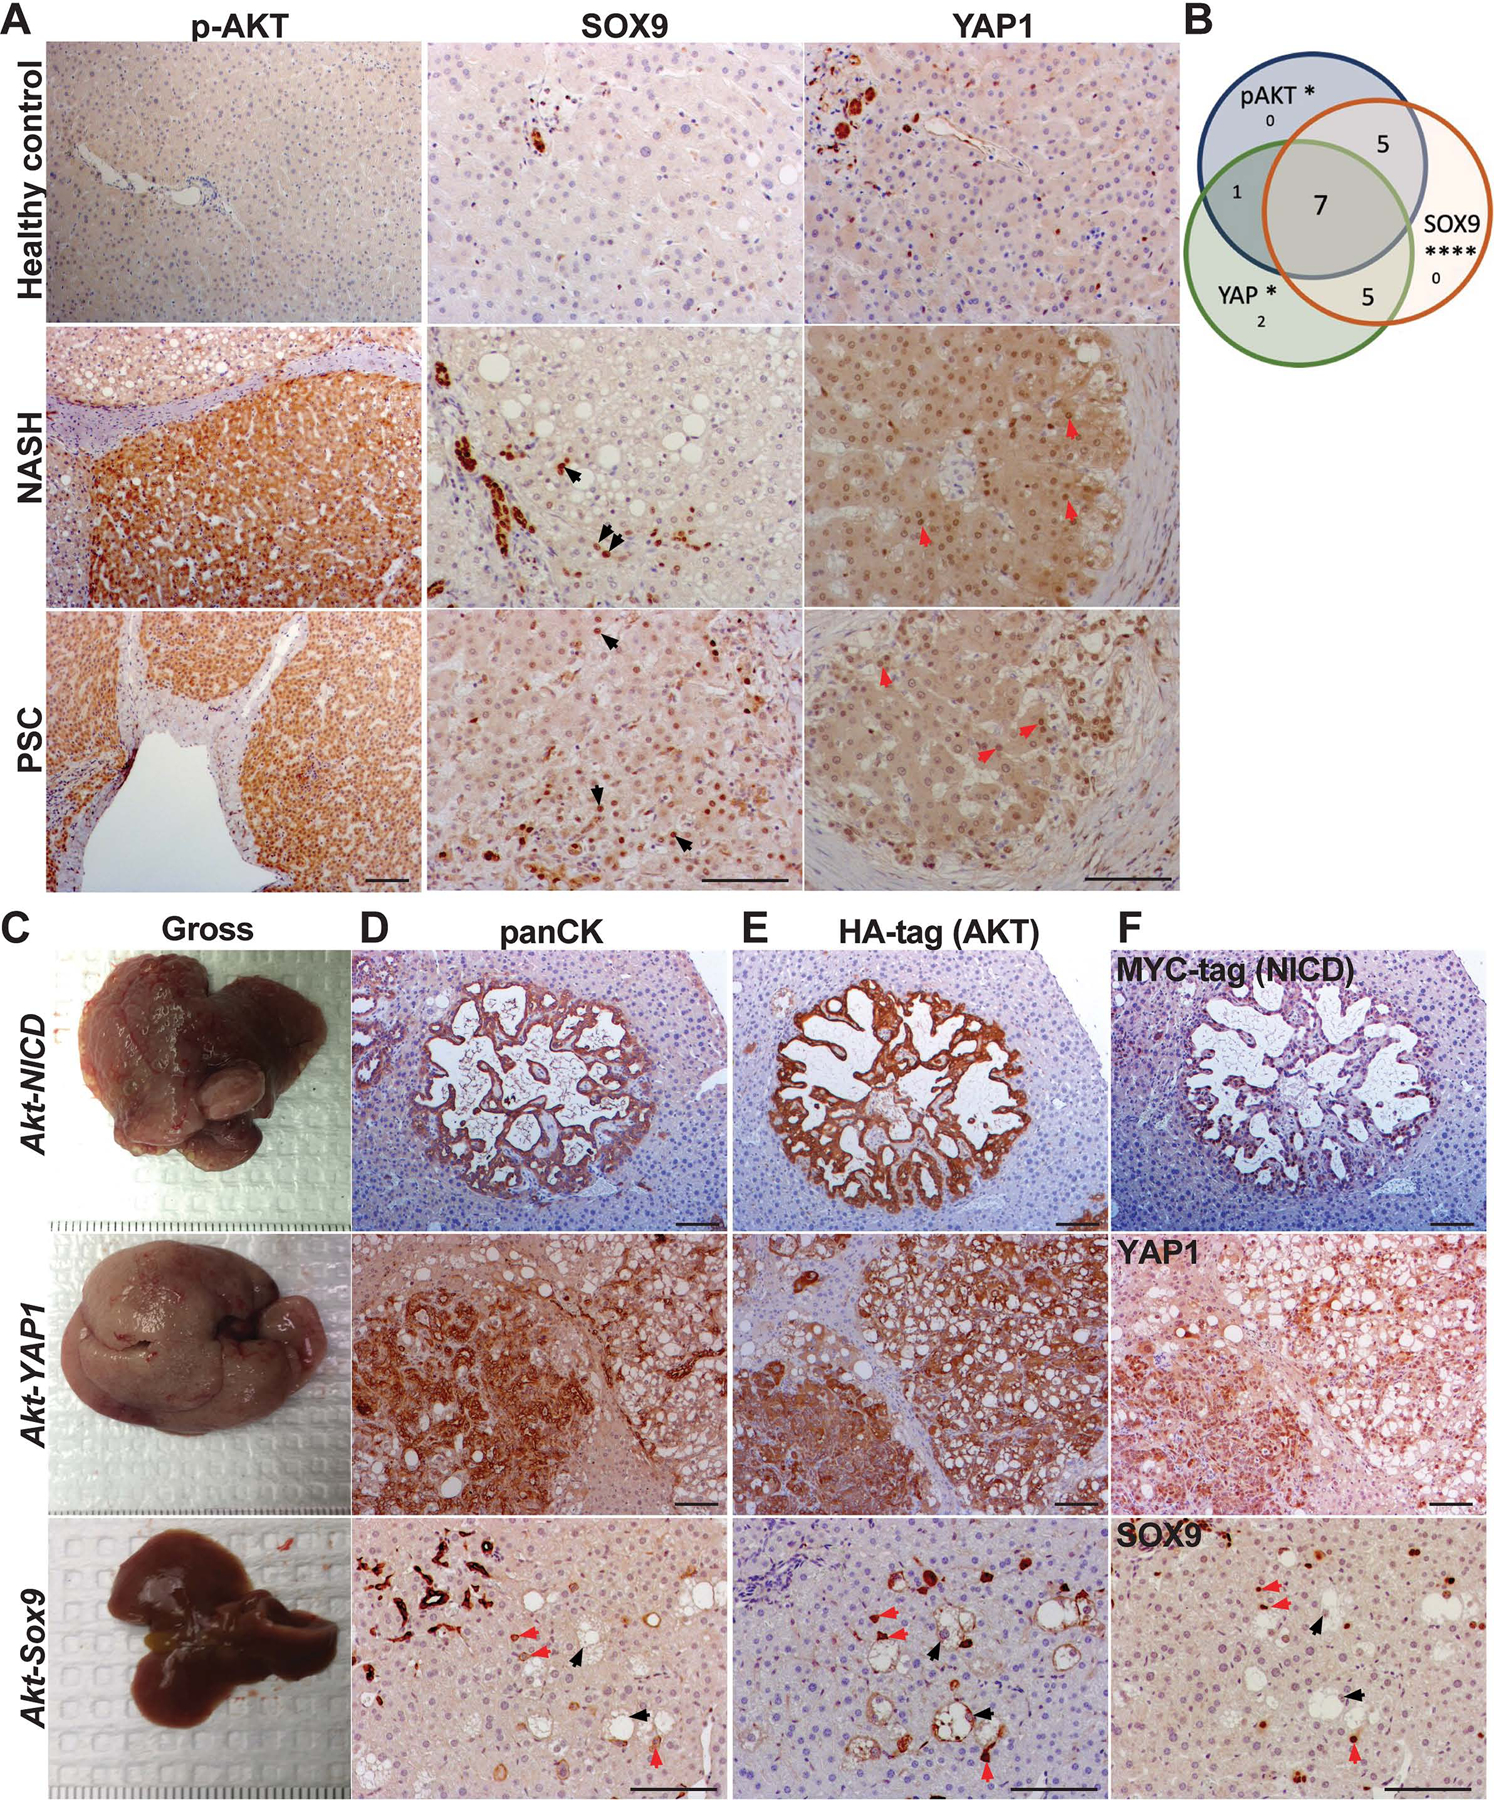
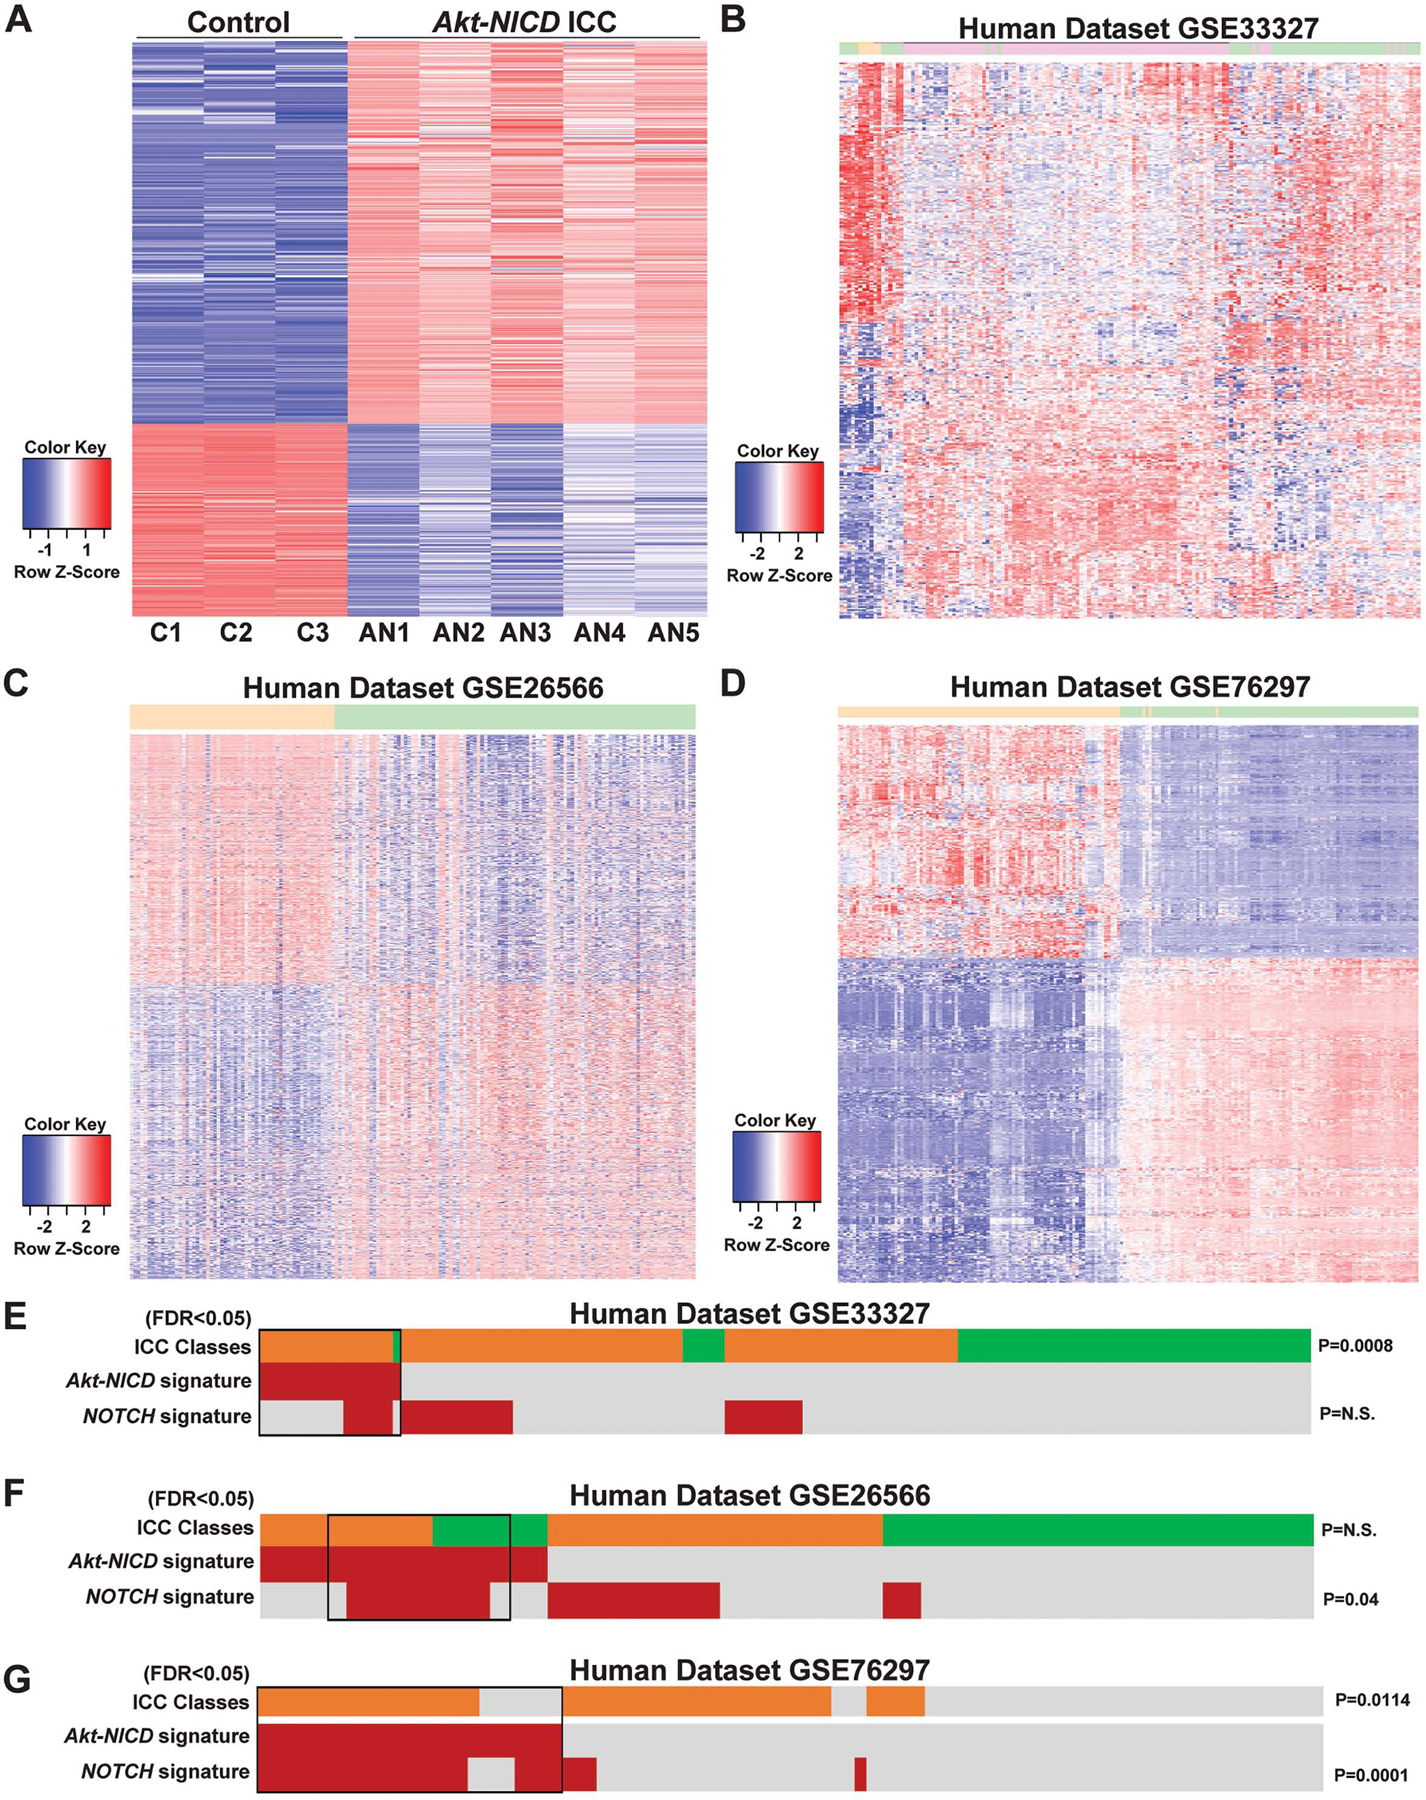
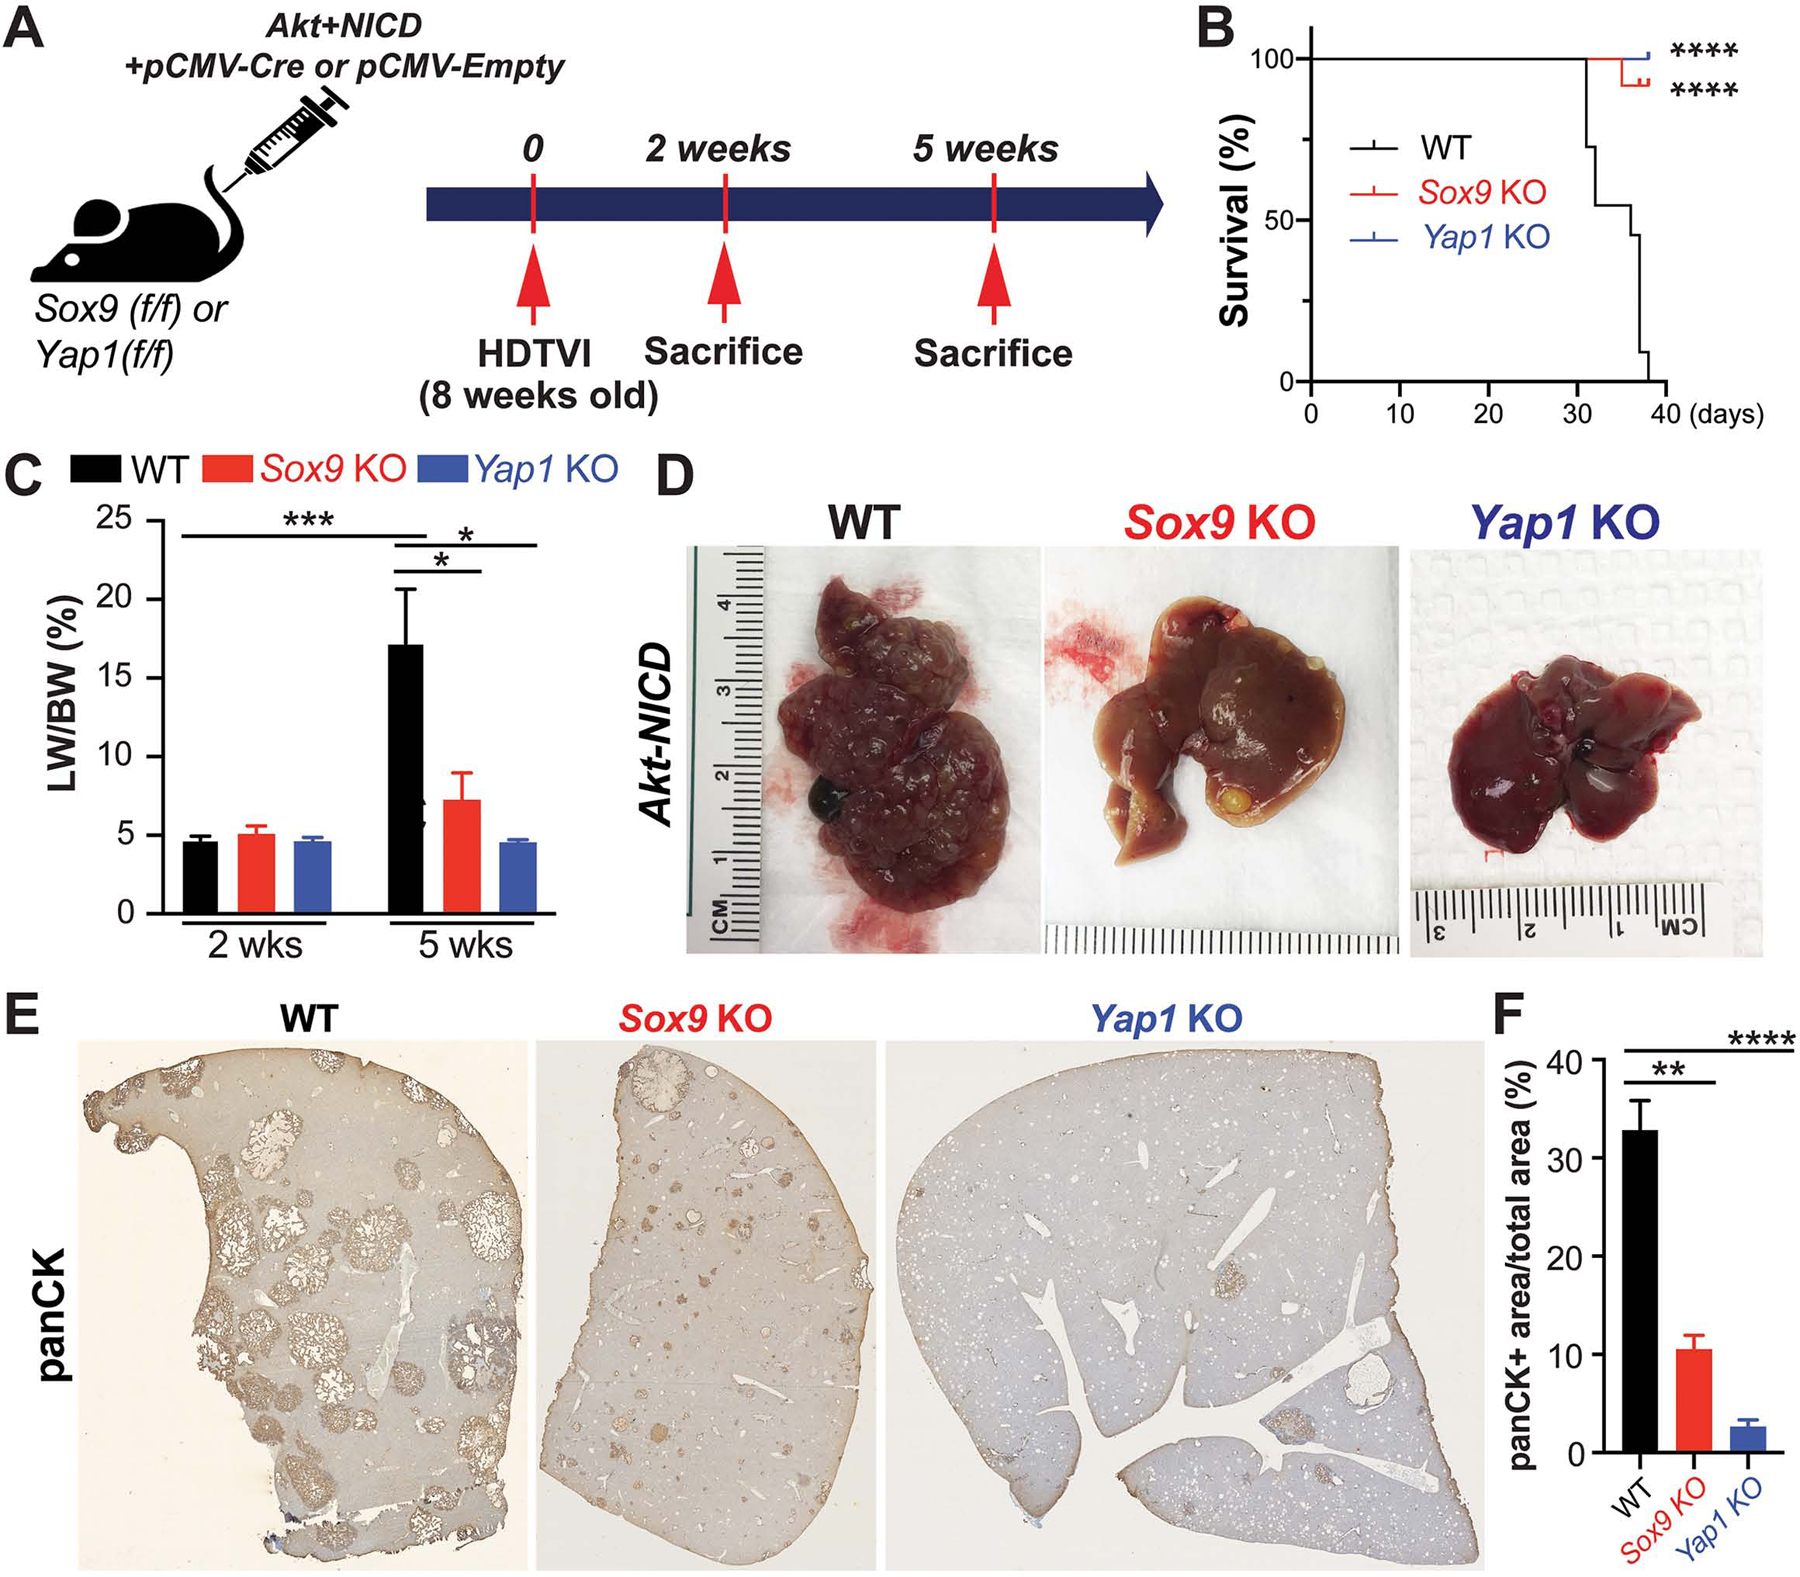
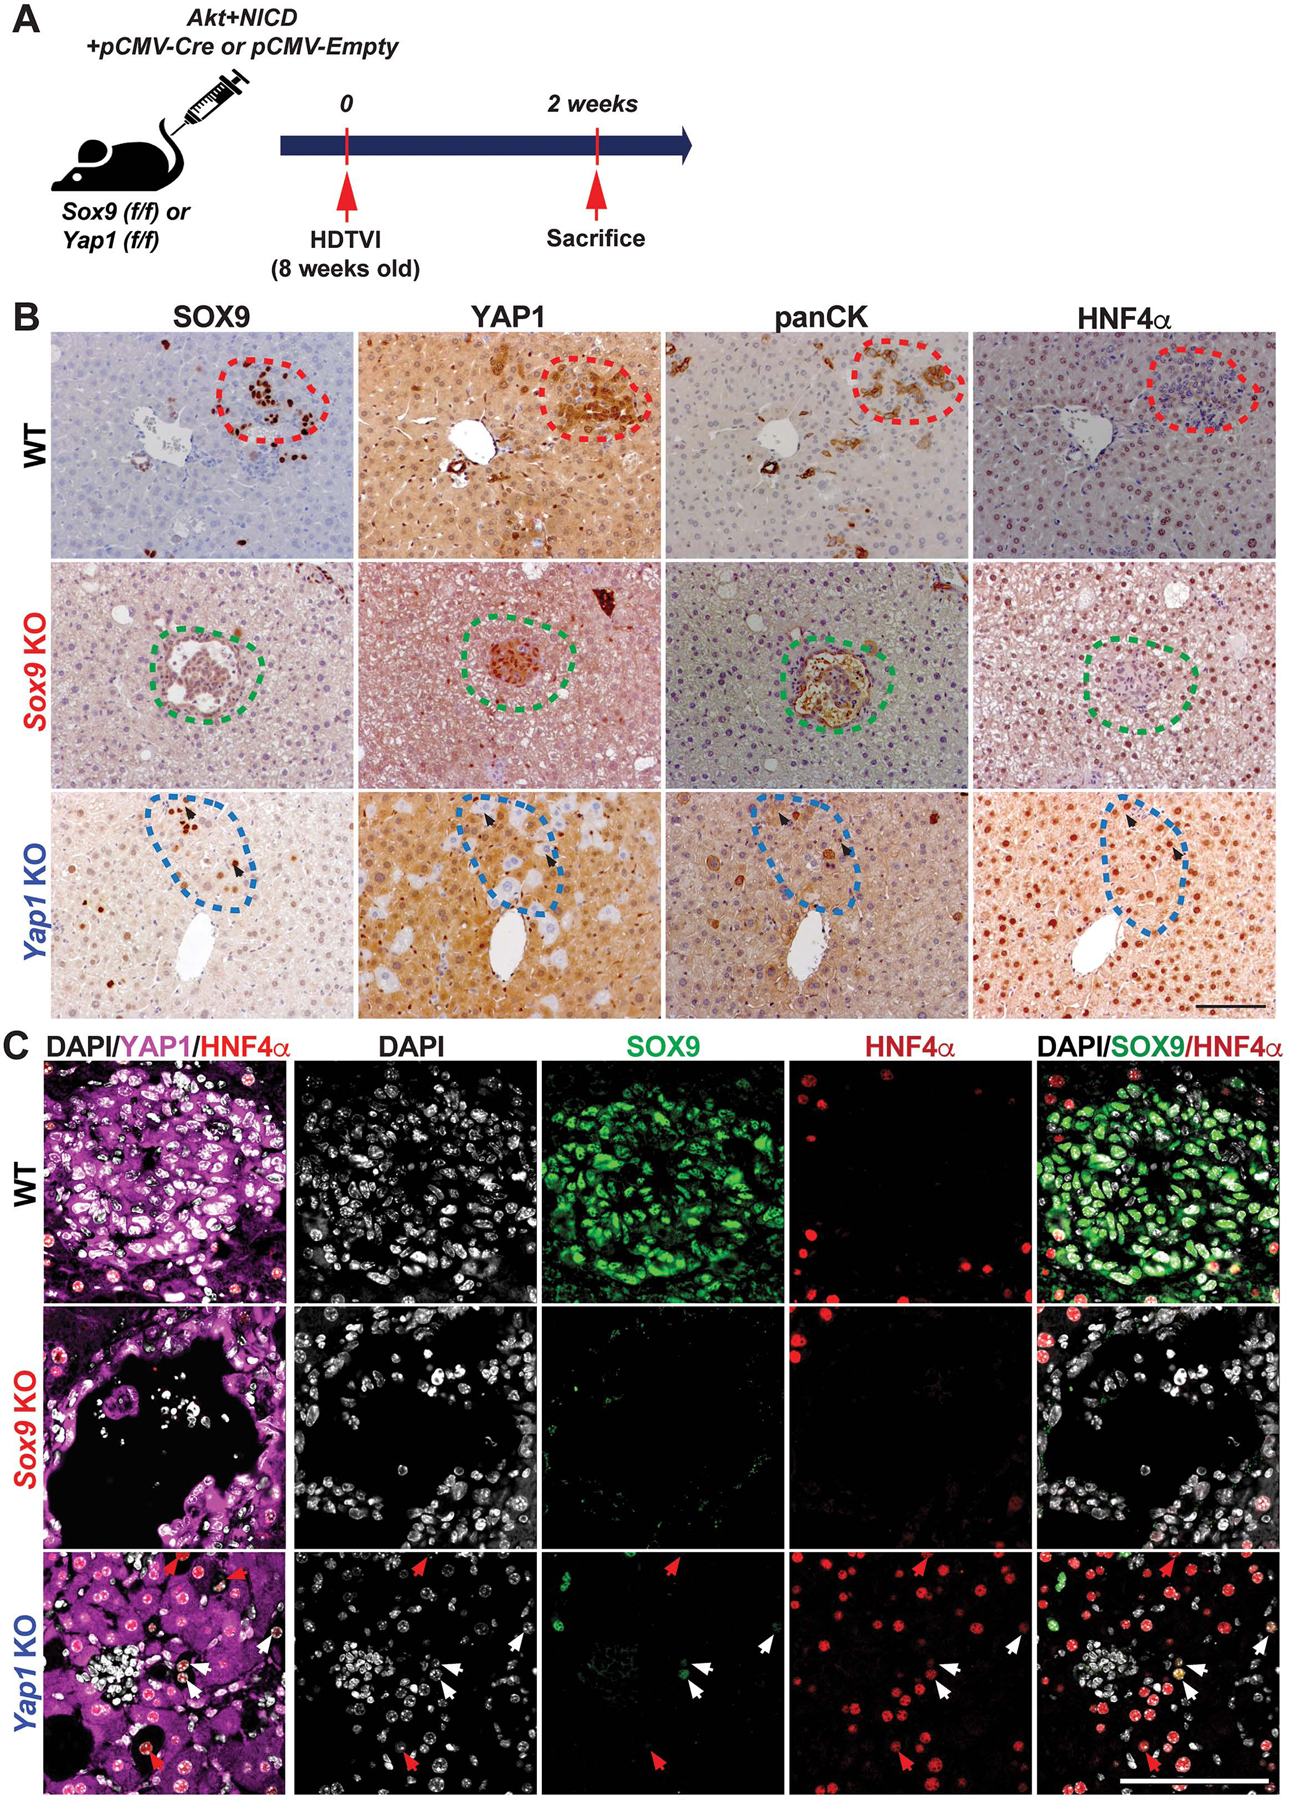
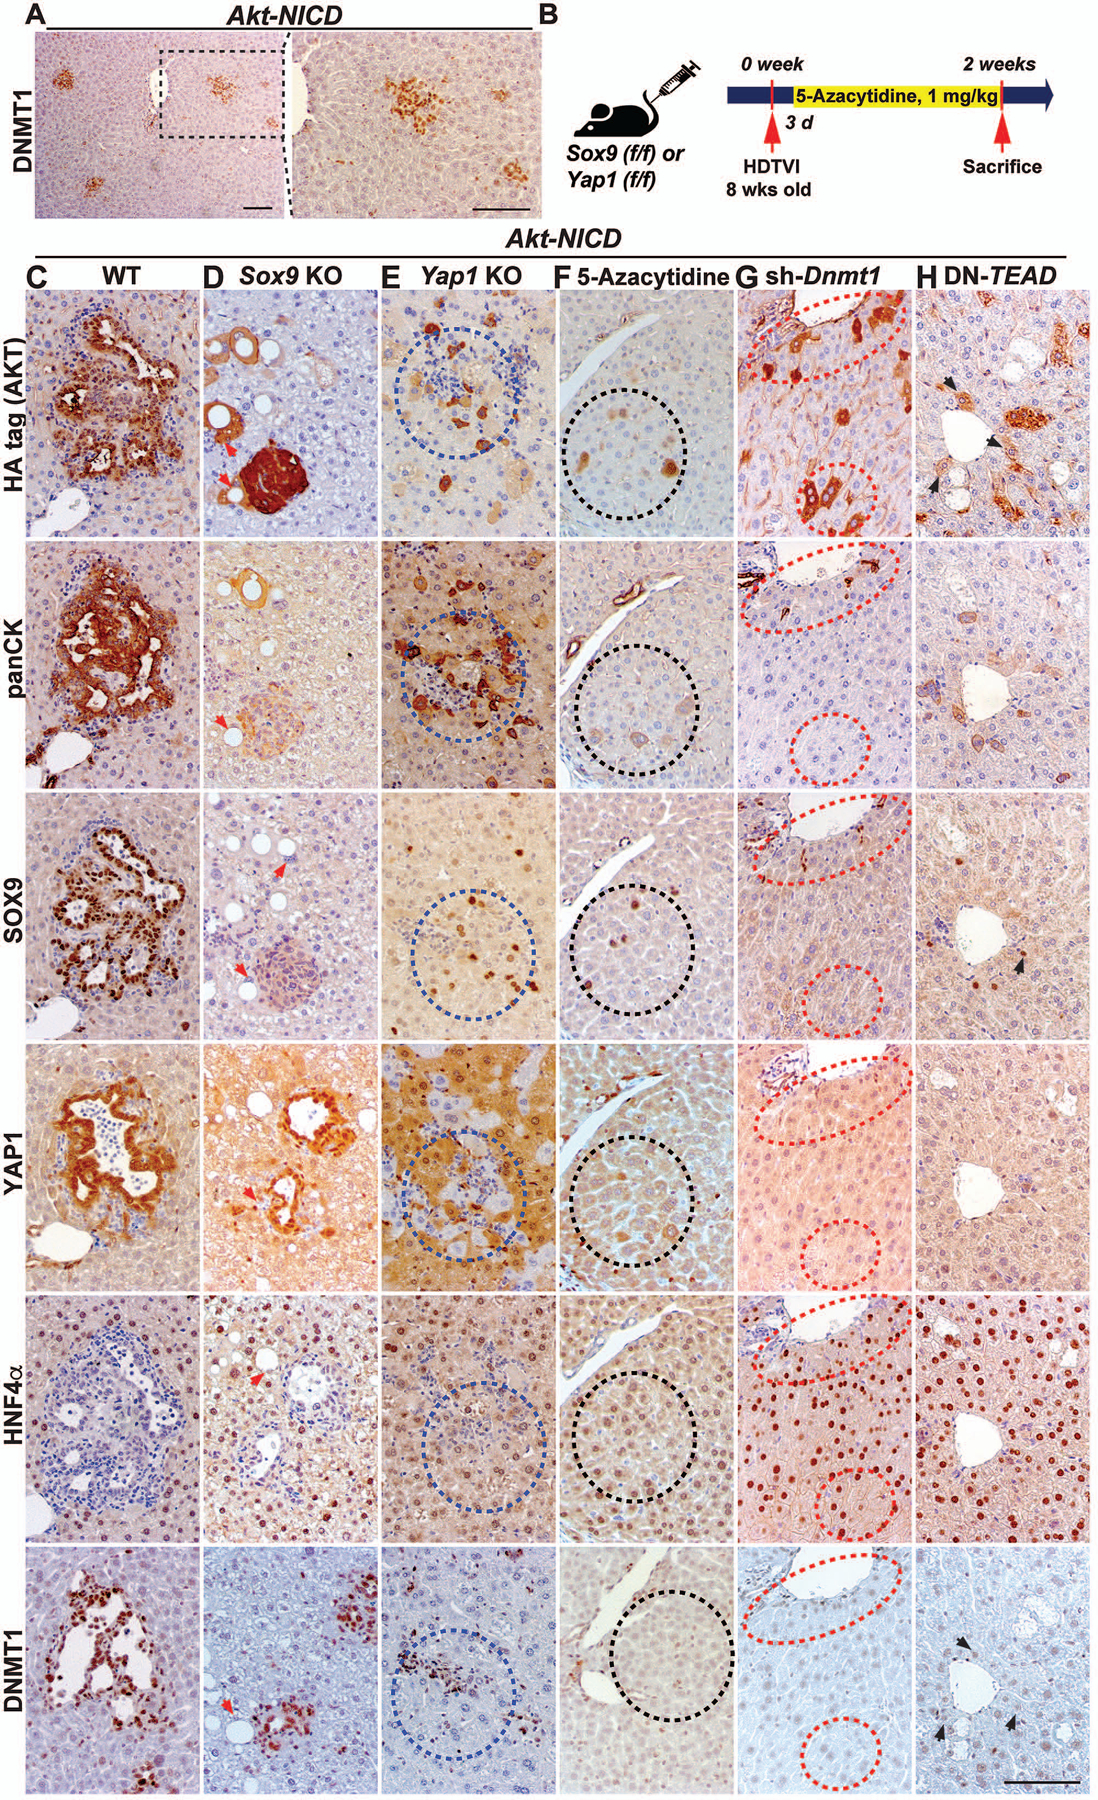
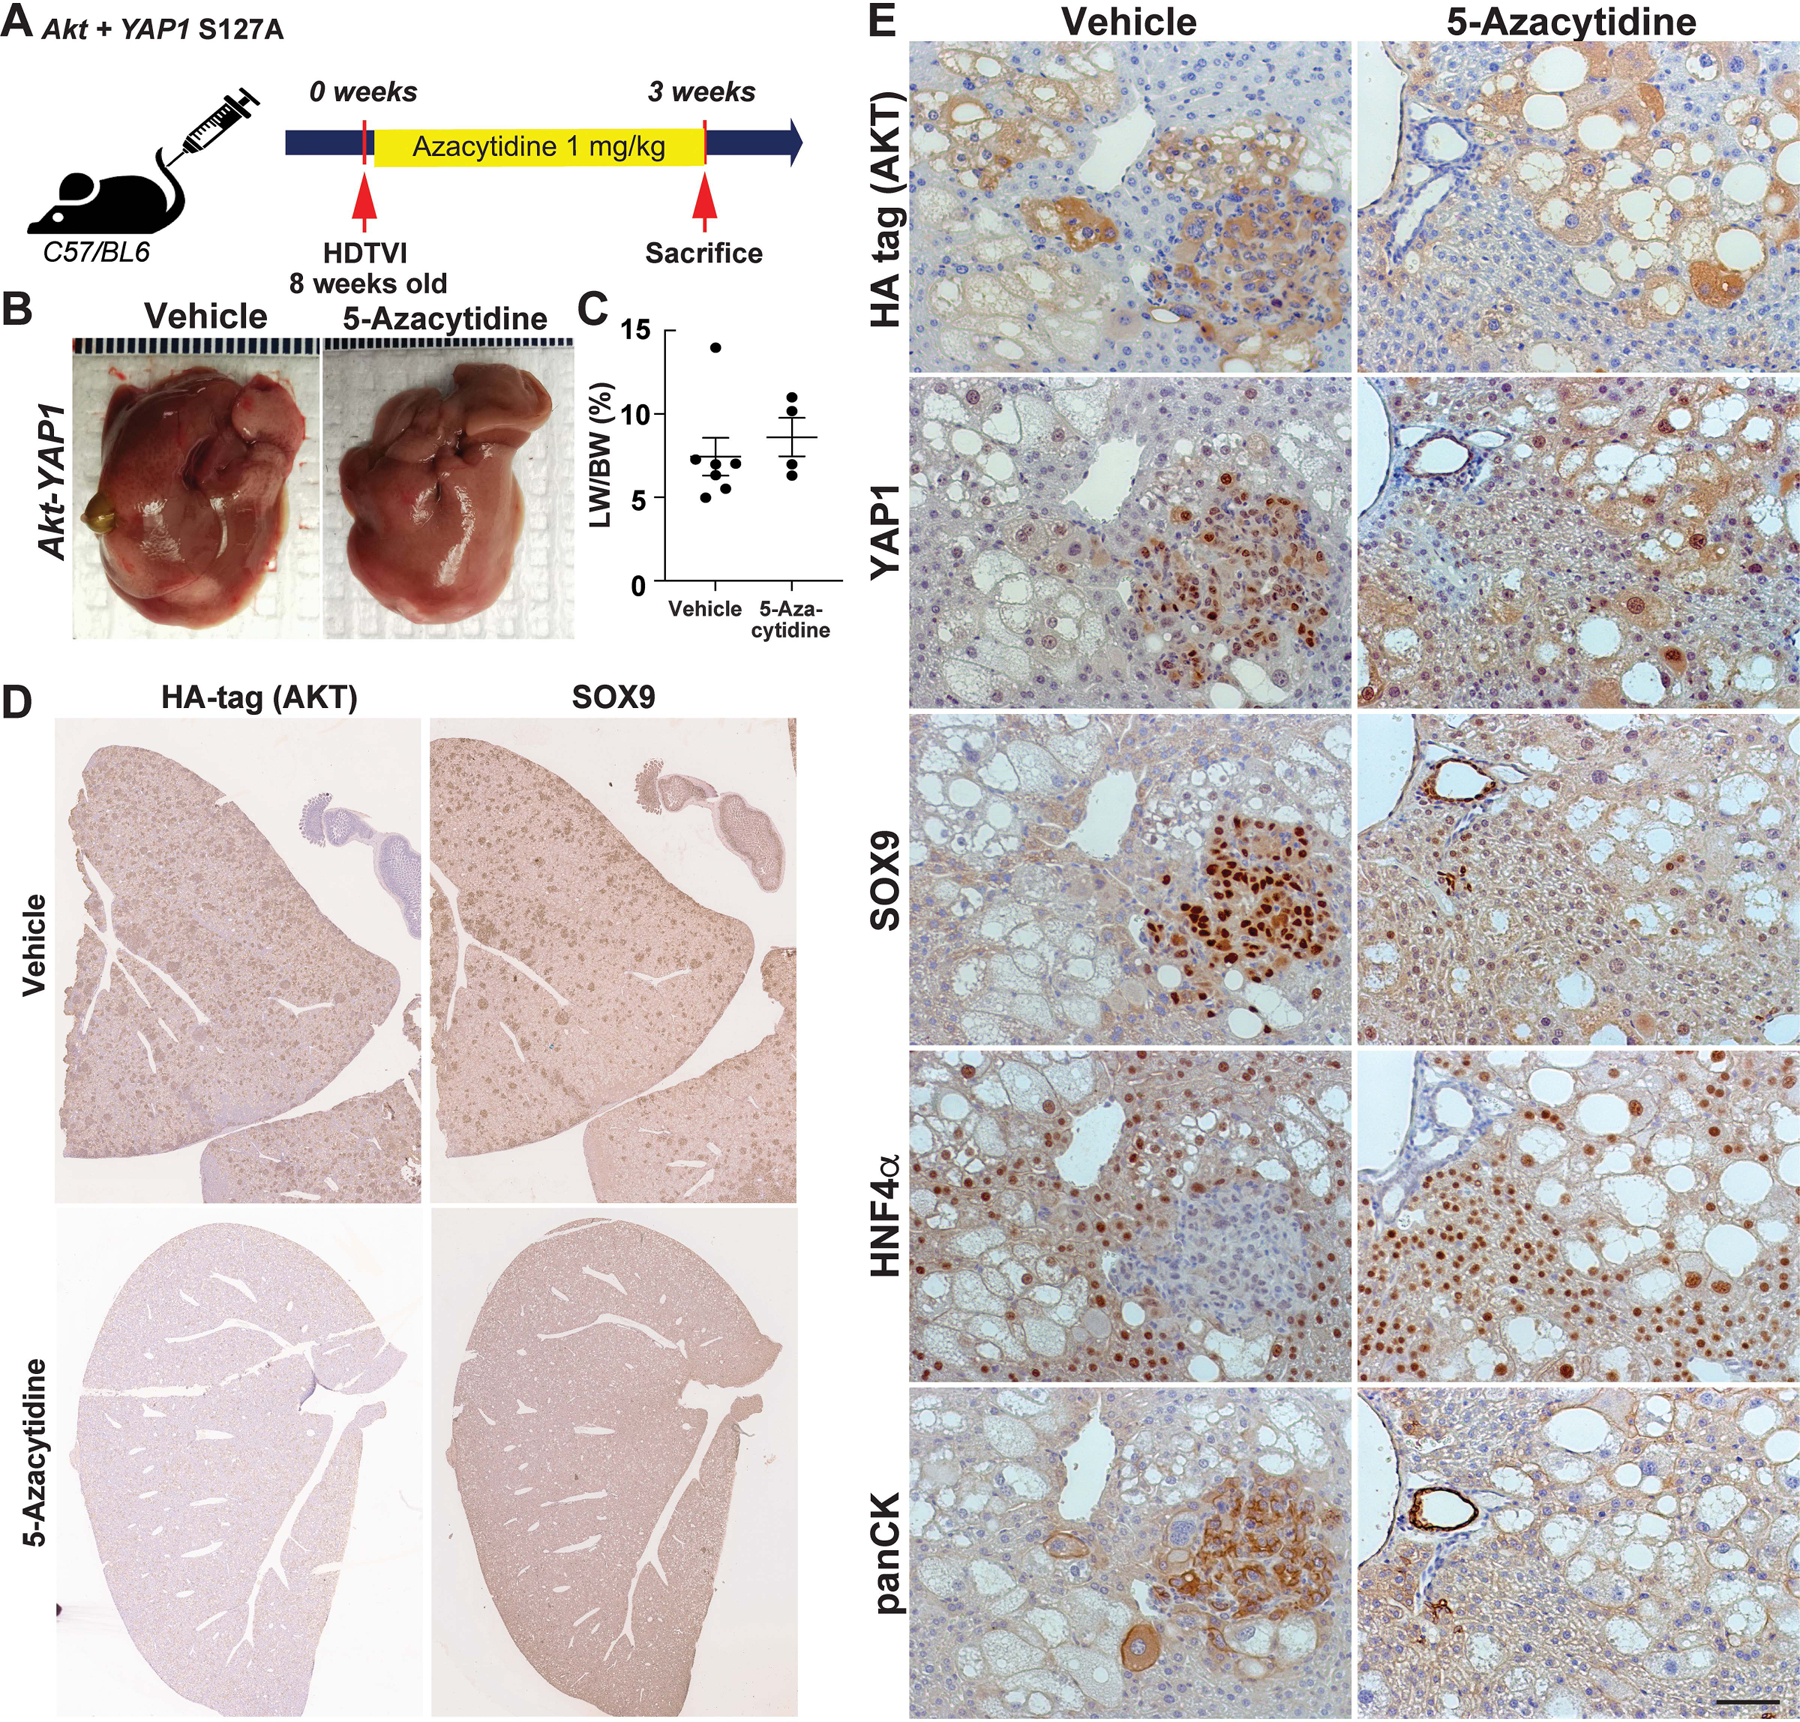
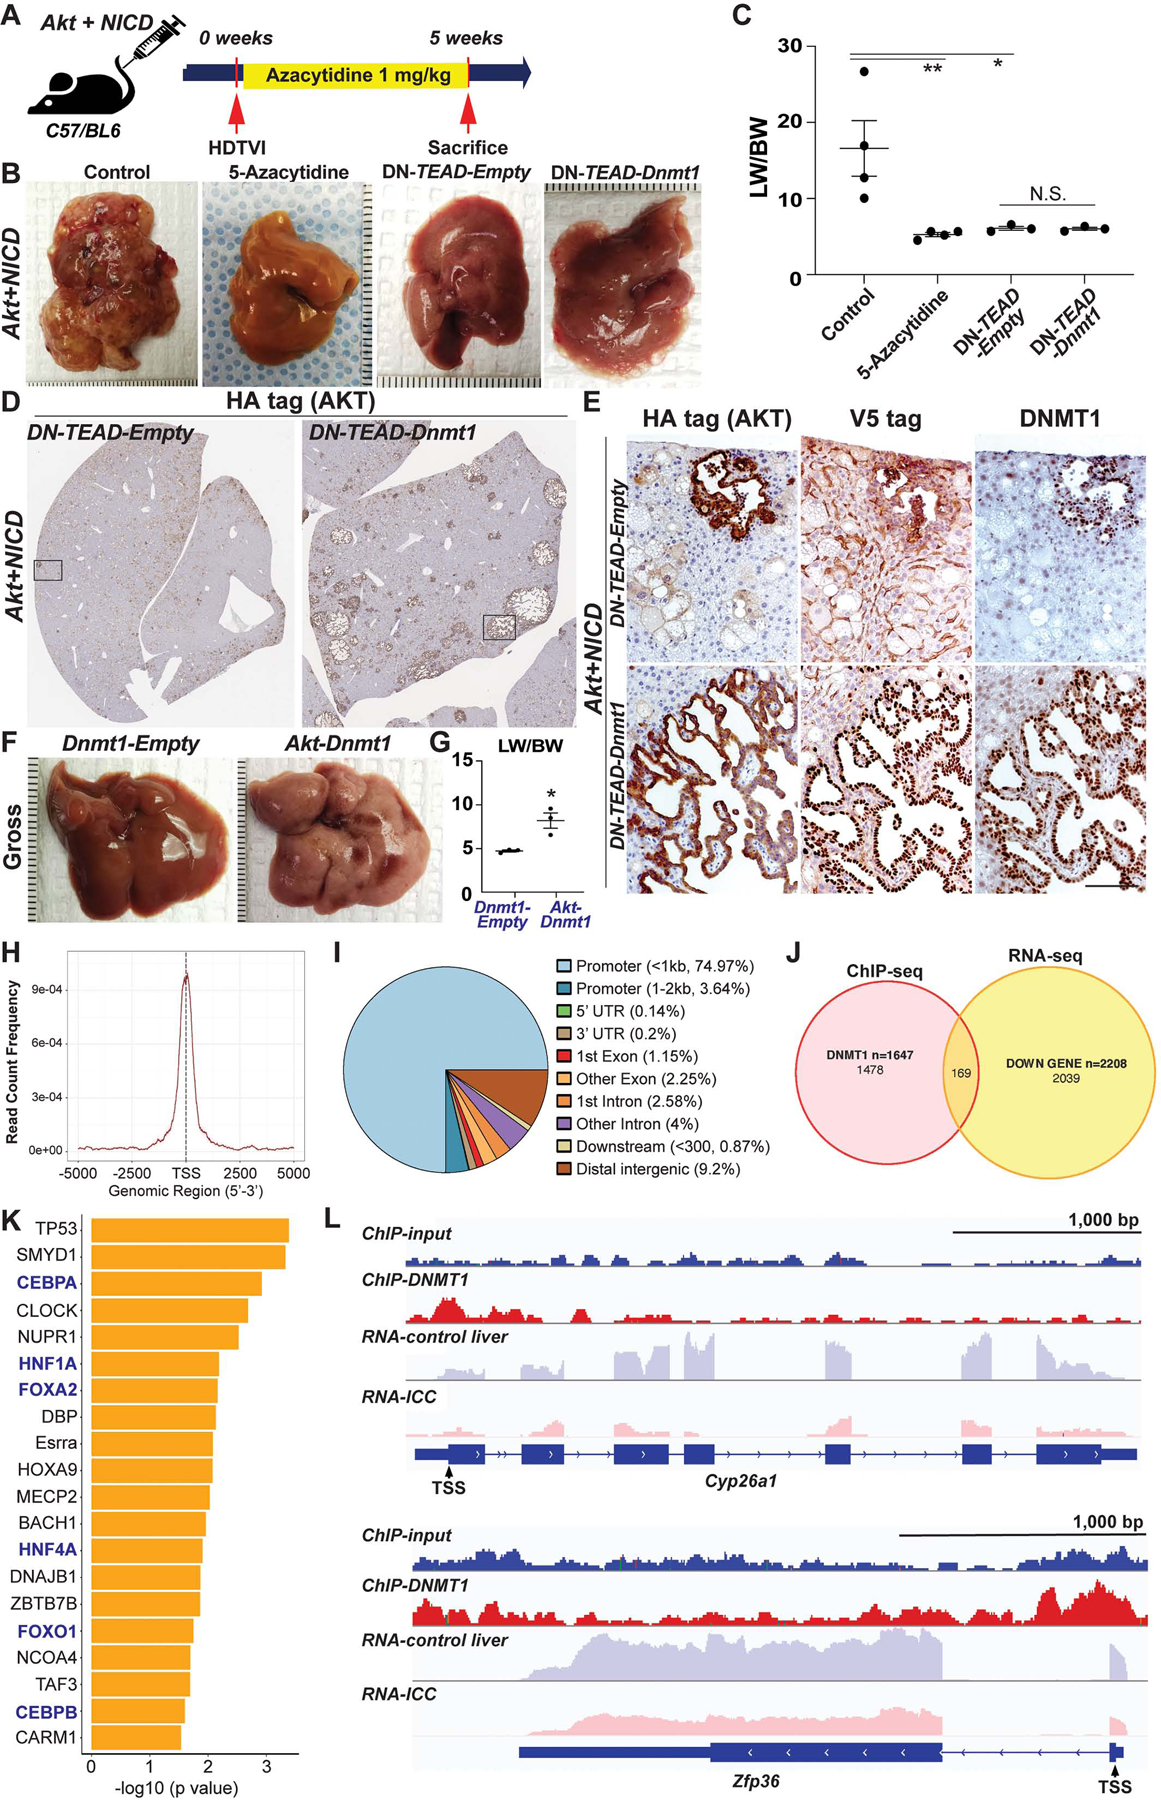
Methods: Expression of ICC driver genes in human diseased livers at risk for ICC development were examined. The sleeping beauty and hydrodynamic tail vein injection based Akt-NICD/YAP1 ICC model was used to investigate pathogenetic roles of SRY-box transcription factor 9 (SOX9) and yes-associated protein 1 (YAP1) in HC-driven ICC. We identified DNA methyltransferase 1 (DNMT1) as a YAP1 target, which was validated by loss- and gain-of-function studies, and its mechanism addressed by chromatin immunoprecipitation sequencing.

Results: Co-expression of AKT and Notch intracellular domain (NICD)/YAP1 in HC yielded ICC that represents 13% to 29% of clinical ICC. NICD independently regulates SOX9 and YAP1 and deletion of either, significantly delays ICC development. Yap1 or TEAD inhibition, but not Sox9 deletion, impairs HC-to-biliary epithelial cell (BEC) reprogramming. DNMT1 was discovered as a novel downstream effector of YAP1-TEAD complex that directs HC-to-BEC/ICC fate switch through the repression of HC-specific genes regulated by master regulators for HC differentiation, including hepatocyte nuclear factor 4 alpha, hepatocyte nuclear factor 1 alpha, and CCAAT/enhancer-binding protein alpha/beta. DNMT1 loss prevented NOTCH/YAP1-dependent HC-driven cholangiocarcinogenesis, and DNMT1 re-expression restored ICC development following TEAD repression. Co-expression of DNMT1 with AKT was sufficient to induce tumor development including ICC. DNMT1 was detected in a subset of HCs and dysplastic BECs in cholestatic human livers prone to ICC development.

Conclusion: We identified a novel NOTCH-YAP1/TEAD-DNMT1 axis essential for HC-to-BEC/ICC conversion, which may be relevant in cholestasis-to-ICC pathogenesis in the clinic.

Keywords: Bile Duct; Epigenetics; Liver Cancer; Precision Medicine; Transdifferentiation.


Conflict of interest statement

Disclosure: There are no financial conflict of interests to declare relevant to the current manuscript for any of the authors.

Figures

Figure 1.
Figure 1.. Upregulation of AKT and NICD targets YAP1 and SOX9 in hepatocytes in patients with risk for ICC.
(A) Representative IHC images of liver section from patients with NASH and PSC showing increased p-AKT, SOX9 and YAP1 expression as compared to healthy liver. Black arrows point to YAP1+ hepatocytes; red arrows to SOX9+ hepatocytes; white arrows to p-AKT+ hepatocytes. (B) Venn diagram showing overlap of patient samples with NASH and PSC that exhibited aberrant induction of either p-AKT, SOX9, or YAP1 levels in HCs specifically. (C) Gross images of livers from Akt-NICD (upper panel), Akt-YAP1 (middle panel) and Akt-Sox9 injected mice (lower panel) at 5w post-HDTVI (D) Representative IHC staining for panCK depicts presence of ICC in Akt-NICD model (upper panel), mixed ICC-HCC in Akt-YAP1 model (middle panel) and lack of any tumors with positive staining in normal ducts. Red arrows indicate HA-Akt and Sox9-transfected HCs and black arrows, HA-Akt-transfected but SOX9 foamy hepatocytes in AKT-Sox9 model (lower panel). (E) Representative IHC for HA-tag to identify myr-AKT in serial sections (to D) (upper panel) and mixed ICC/HCC in Akt-YAP1 model (middle panel). Red arrows indicate HA-Akt and Sox9-transfected HCs and black arrows, to HA-Akt-transfected but SOX9 foamy hepatocytes in AKT-Sox9 model (lower panel). (F) Representative IHC on serial sections (to D and E) to identify MYC-tag to identify NICD (upper panel), YAP1 (middle panel) and SOX9 (lower panel) at 5w in Akt-NICD, Akt-YAP1 and AKT-Sox9 livers. Scale bars:100 μm; *p<0.05; ****p<0.0001.
Figure 2:
Figure 2:. RNA-seq analysis of murine Akt-NICD ICC model and comparison with human ICC cases.
(A) Heatmap for the differentially expressed genes comparing wild-type (WT) liver and Akt-NICD ICC. (B) Heatmap of gene signatures in human GSE33327 study that are selected by mouse model (WT VS Akt-NICD). Orange: normal; Green: inflammation-class; Pink: proliferation-class. (C) Heatmap of gene signatures in human GSE26566 study that are selected by mouse model (WT VS Akt-NICD). Orange: surrounding liver; Green: ICC. (D) Heatmap of gene signatures in human GSE76297 study that are selected by mouse model (WT VS Akt-NICD). Orange: non-tumor; Green: ICC. Nearest Template Prediction (NTP) analysis of three human whole-tumor gene expression datasets GSE33327 (E), GSE26566 (F) and GSE76297 (G) using the Akt-NICD signature generated in this study. Inflammation class is indicated in green; Proliferation class is indicated in orange. In the heatmap, each column represents a patient, and each row represents a different signature; positive prediction of signatures as calculated by NTP is indicated in red and absence in gray. p values that show significant correlation are indicated to the right of the NTP analysis.
Figure 3.
Figure 3.. Tumor-specific Sox9 or Yap1 deletion significantly delays Akt-NICD-mediated hepatocyte-derived ICC development.
(A) Experimental design illustrating plasmids used for HDTVI, mice used in study and time-points analyzed. (B) Kaplan–Meier curve showing improved survival of Sox9KO and Yap1KO as compared to WT (C) LW/BW ratio depicts comparable low tumor burden in Akt-NICD Sox9KO, Yap1KO and WT mice at 2w but significantly lower in Sox9KO and Yap1KO at 5w. (D) Representative gross images from Akt-NICD WT show multiple large tumors at 5w, with only occasional small tumor seen in Sox9KO and few gross tumor nodules in Yap1KO at the same time. (E) Representative tiled image of panCK staining in Akt-NICD WT mice, Sox9KO and Yap1KO at 5w and quantification (F). Scale bars:100 μm; error bar: standard error of the mean; *p<0.05; **p<0.01; ***, p<0.001; ****p<0.0001.
Figure 4.
Figure 4.. Role of Yap1 but not Sox9 in hepatocyte-to-biliary reprogramming in Akt-NICD-driven cholangiocarcinogenesis.
(A) Experimental design illustrating plasmids used for HDTVI, mice used in study and time-points analyzed. (B) Representative IHC staining of WT (red-dashed lines), Sox9KO (green-dashed lines), and Yap1KO livers (blue-dashed lines) at 2w after Akt-NICD injection. (C) Confocal images of IF staining of WT, Sox9KO and Yap1KO livers at 2w verify IHC results in B. Red arrows point to YAP1;HNF4α+;SOX9 cells, white arrows to YAP1;HNF4α+;SOX9+ cells. Scale bars:100 μm.
Figure 5.
Figure 5.. DNMT1 is required for YAP1-TEAD-driven HC-to-ICC transformation.
(A) Representative IHC showing DNMT1 induction in Akt-NICD-transfected HCs in the early stage of HC-to-BEC conversion at 2w post-injection. (B) Experimental design illustrating 5-Azacytidine treatment, plasmids used for HDTVI, mice used in study and time-points analyzed. Representative IHC of WT (C) or Sox9KO (D) livers showing Akt-NICD-transfected cells. (E) Yap1KO livers showing Yap1-deleted Akt-NICD-transfected cells with imperfect HC-to-biliary reprogramming (blue-dashed lines). 5-Azacytidine-treated (F), Dnmt1-silenced (G) or TEAD-inhibited livers (H) showing defective HC-to-BEC reprogramming. Akt-NICD-transfected cells (black- or red-dashed lines). Red arrows point to Akt-HA transduced cells. Black arrows point to Akt-HA transduced cells in DN-TEAD livers. Scale bars:100 μm.
Figure 6:
Figure 6:. Pharmacologic DNMT1 inhibition switches the fate of Akt-YAP1-transduced hepatocytes from mixed ICC/HCC to HCC at the expense of ICC.
(A) Experimental design illustrating 5-Azacytidine treatment, plasmids used for HDTVI, mice used in study and time-points analyzed. (B) Representative gross images show comparable Akt-YAP1 tumor development between Vehicle or 5-Azacytidine-treated livers at 3w post-injection (C) LW/BW ratio depicts comparable tumor burden in Vehicle or 5-Azacytidine-treated animals at 3w. (D) Representative tiled image of HA-tag (AKT) and SOX9 staining in ICC nodules of the mixed ICC/HCC lesions in vehicle- or 5-Azacytidine-treated livers. (E) Representative IHC images of 3w vehicle-treated livers bearing Akt-YAP1-driven ICC component and HCC positive for HNF4α. In 5-Azacytidine-treated livers, no ICC but only HCC was detected.
Figure 7.
Figure 7.. NICD-YAP1/TEAD-DNMT1 axis drives HC-to-ICC transformation.
(A) Experimental design illustrating 5-Azacytidine treatment, plasmids used for HDTVI, mice used in study and time-points analyzed. (B) Representative gross images from Akt-NICD control, 5-Azacytidine-treated or DN-TEAD injected livers at 5w. (C) LW/BW ratio depicts comparable low tumor burden in 5-Azacytidine-treated, DN-TEAD and DN-TEAD-Dnmt1 co-injected animals at 5w. (D) Representative tiled image of HA-tag (AKT) staining showing near-complete abrogation of tumor by TEAD repression whereas widespread cystic ICC nodules were detected in Dnmt1 re-expressed livers. (E) IHC of squared region (D panel) showing HA-tag+;V5-tag (DNMT1)+;endogenous DNMT1+ ICC nodules in Dnmt1 re-expressed liver (bottom). Few tumor nodules observed in Akt-NICD; DN-TEAD were V5-tag but positive for HA-tag and endogenous DNMT1 (top). Representative gross images (F) and LW/BW (G) ratio from Akt-Dnmt1-injected group shows tumor burden within entire liver lobes while no gross tumor nodule was observed in Dnmt1-Empty-injected livers. (H) Enrichment of DNMT1 ChIP-Seq binding within +/− 2.5kb from transcription start site (TSS) region. (I) Annotation of 2,174 DNMT1 ChIP-Seq peaks relative to Ref Seq transcript annotations showing robust enrichment in promoter region. (J) Venn diagrams showing the overlap of DNMT1 binding (ChIP-seq) and decreased RNA expression (RNA-seq) in Akt-NICD-ICC. (K) IPA-URA analysis results displaying top 20 predicted upstream transcriptional regulators for 169 genes shown in (J). (L) Visualization of DNMT1 ChIP-Seq peaks in correlation with transcripts mapping to representative genes within each regulatory group.

References

    1. National Cancer Institute NIoH. Cancer Stat Facts: Liver and Intrahepatic Bile Duct Cancer, 2018.
    1. Dabney RS, Khalife M, Shahid K, et al. Molecular pathways and targeted therapy in cholangiocarcinoma. Clin Adv Hematol Oncol 2019;17:630–637. - PubMed
    1. Lamarca A, Barriuso J, McNamara MG, et al. Molecular targeted therapies: Ready for “prime time” in biliary tract cancer. J Hepatol 2020. - PubMed
    1. Banales JM, Cardinale V, Carpino G, et al. Expert consensus document: Cholangiocarcinoma: current knowledge and future perspectives consensus statement from the European Network for the Study of Cholangiocarcinoma (ENS-CCA). Nat Rev Gastroenterol Hepatol 2016;13:261–80. - PubMed
    1. Cai Y, Cheng N, Ye H, et al. The current management of cholangiocarcinoma: A comparison of current guidelines. Biosci Trends 2016;10:92–102. - PubMed

Publication types

MeSH terms

Substances