

Efficient deformation mechanisms enable invasive cancer cells to migrate faster in 3D collagen networks
- PMID: 35550548
- PMCID: PMC9098560
- DOI: 10.1038/s41598-022-11581-2
Efficient deformation mechanisms enable invasive cancer cells to migrate faster in 3D collagen networks
Abstract
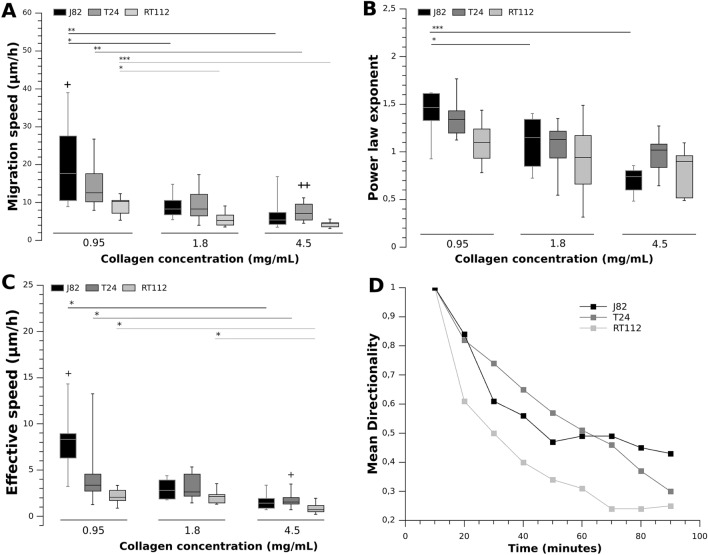
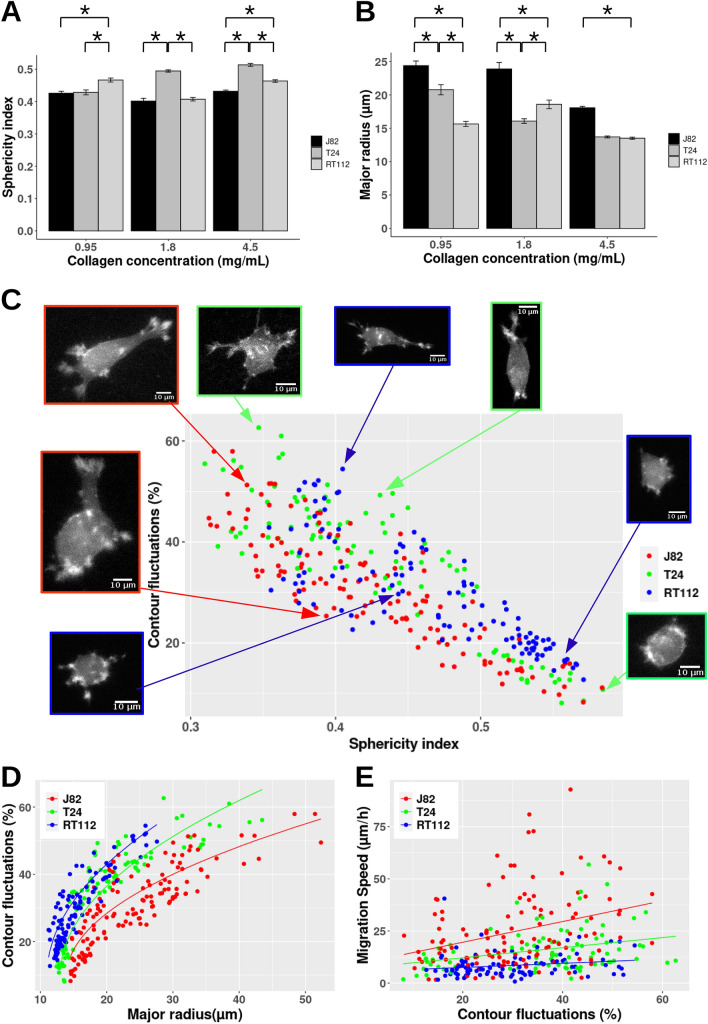
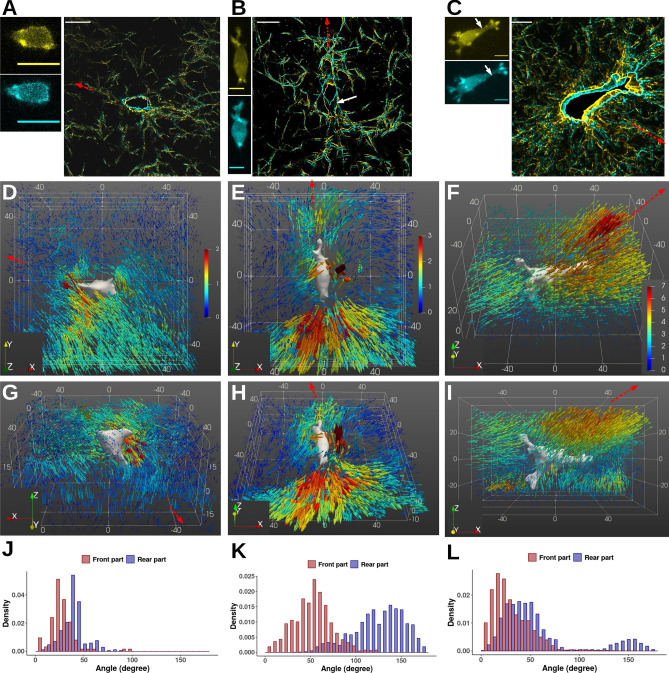
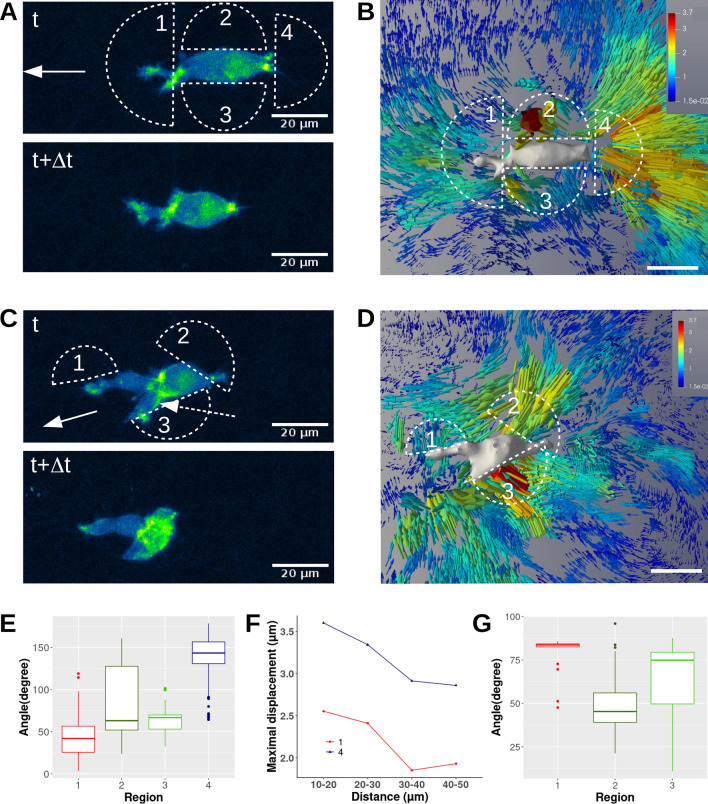
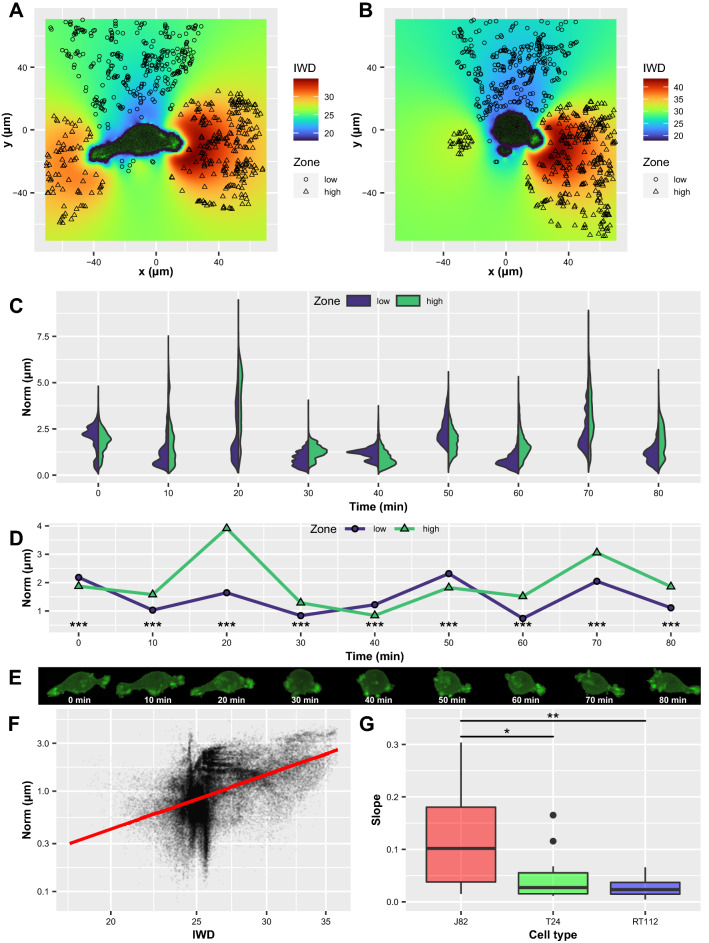
Cancer cell migration is a widely studied topic but has been very often limited to two dimensional motion on various substrates. Indeed, less is known about cancer cell migration in 3D fibrous-extracellular matrix (ECM) including variations of the microenvironment. Here we used 3D time lapse imaging on a confocal microscope and a phase correlation method to follow fiber deformations, as well as cell morphology and live actin distribution during the migration of cancer cells. Different collagen concentrations together with three bladder cancer cell lines were used to investigate the role of the metastatic potential on 3D cell migration characteristics. We found that grade-3 cells (T24 and J82) are characterized by a great diversity of shapes in comparison with grade-2 cells (RT112). Moreover, grade-3 cells with the highest metastatic potential (J82) showed the highest values of migration speeds and diffusivities at low collagen concentration and the greatest sensitivity to collagen concentration. Our results also suggested that the small shape fluctuations of J82 cells are the signature of larger migration velocities. Moreover, the displacement fields generated by J82 cells showed significantly higher fiber displacements as compared to T24 and RT112 cells, regardless of collagen concentration. The analysis of cell movements enhanced the fact that bladder cancer cells were able to exhibit different phenotypes (mesenchymal, amoeboid). Furthermore, the analysis of spatio-temporal migration mechanisms showed that cancer cells are able to push or pull on collagen fibers, therefore producing efficient local collagen deformations in the vicinity of cells. Our results also revealed that dense actin regions are correlated with the largest displacement fields, and this correlation is enhanced for the most invasive J82 cancer cells. Therefore this work opens up new routes to understand cancer cell migration in soft biological networks.
© 2022. The Author(s).
Conflict of interest statement
The authors declare no competing interests.
Figures
Similar articles
-
Comparative mechanisms of cancer cell migration through 3D matrix and physiological microtracks.Am J Physiol Cell Physiol. 2015 Mar 15;308(6):C436-47. doi: 10.1152/ajpcell.00225.2014. Epub 2014 Dec 10. Am J Physiol Cell Physiol. 2015. PMID: 25500742 Free PMC article.
-
Inhibition of STAT signalling in bladder cancer by diindolylmethane: relevance to cell adhesion, migration and proliferation.Curr Cancer Drug Targets. 2013 Jan;13(1):57-68. Curr Cancer Drug Targets. 2013. PMID: 22920439
-
Contact guidance diversity in rotationally aligned collagen matrices.Acta Biomater. 2018 Jan 15;66:248-257. doi: 10.1016/j.actbio.2017.11.039. Epub 2017 Nov 28. Acta Biomater. 2018. PMID: 29196116 Free PMC article.
-
The matrix environmental and cell mechanical properties regulate cell migration and contribute to the invasive phenotype of cancer cells.Rep Prog Phys. 2019 Jun;82(6):064602. doi: 10.1088/1361-6633/ab1628. Epub 2019 Apr 4. Rep Prog Phys. 2019. PMID: 30947151 Review.
-
Toward single cell traction microscopy within 3D collagen matrices.Exp Cell Res. 2013 Oct 1;319(16):2396-408. doi: 10.1016/j.yexcr.2013.06.009. Epub 2013 Jun 25. Exp Cell Res. 2013. PMID: 23806281 Free PMC article. Review.
Cited by
-
Prediction of anticancer drug resistance using a 3D microfluidic bladder cancer model combined with convolutional neural network-based image analysis.Front Bioeng Biotechnol. 2024 Jan 10;11:1302983. doi: 10.3389/fbioe.2023.1302983. eCollection 2023. Front Bioeng Biotechnol. 2024. PMID: 38268938 Free PMC article.
-
Distinct roles of protrusions and collagen deformation in collective invasion of cancer cell types.Biophys J. 2025 May 6;124(9):1506-1520. doi: 10.1016/j.bpj.2025.03.032. Epub 2025 Mar 31. Biophys J. 2025. PMID: 40170350 Free PMC article.
-
Mechanobiological engineering strategies for organoid culture.APL Bioeng. 2025 Jul 18;9(3):031501. doi: 10.1063/5.0275439. eCollection 2025 Sep. APL Bioeng. 2025. PMID: 40688244 Free PMC article. Review.
-
Studying breast cancer lung metastasis using a multi-compartment microfluidic device with a mimetic tumor-stroma interaction model.Transl Oncol. 2025 Mar;53:102303. doi: 10.1016/j.tranon.2025.102303. Epub 2025 Feb 4. Transl Oncol. 2025. PMID: 39904278 Free PMC article.
-
Capillary constrictions prime cancer cell tumorigenicity through PIEZO1.bioRxiv [Preprint]. 2025 Jul 26:2025.07.22.666218. doi: 10.1101/2025.07.22.666218. bioRxiv. 2025. Update in: Nat Commun. 2025 Sep 1;16(1):8160. doi: 10.1038/s41467-025-63374-6. PMID: 40777384 Free PMC article. Updated. Preprint.
References
-
- Sheetz MP, Felsenfeld D, Galbraith CG, Choquet D. Cell migration as a five-step cycle. Biochem. Soc. Symp. 1999;65:233–243. - PubMed
Publication types
MeSH terms
Substances
LinkOut - more resources
Full Text Sources
Medical
