. 2022 May;10(5):e004574.
doi: 10.1136/jitc-2022-004574.

Tissue-resident memory T cells from a metastatic vaginal melanoma patient are tumor-responsive T cells and increase after anti-PD-1 treatment

Affiliations

Tissue-resident memory T cells from a metastatic vaginal melanoma patient are tumor-responsive T cells and increase after anti-PD-1 treatment

Angela Pizzolla et al. J Immunother Cancer. 2022 May.

Abstract

Background: Vaginal melanoma (VM) is a rare cancer and has a poor response to immune checkpoint blockade (ICB). CD8+Tissue Resident Memory (TRM) T cells proliferate in response to ICB and correlate with longer survival in metastatic cutaneous melanoma. However, their capacity to respond to VM and their neoantigens is not known.

Methods: Using longitudinal samples, we explored the evolution of VM mutations by whole-exome sequencing and RNAseq, we also defined the immune context using multiplex immunohistochemistry and nanostring pan cancer immune profile. Then using fresh single cell suspensions of the metastatic samples, we explored VM T cells via mass cytometry and single cell RNAseq and T cell receptor sequencing (TCRseq). Finally, we investigated TRM, pre-TRM and exhausted T cell function against melanoma neo-antigens and melanoma differentiation antigens in vitro.

Results: Primary VM was non-inflamed and devoid of CD8+ TRM cells. In contrast, both metastases showed proliferating CD8+ TRM were clustered at the tumor margin, with increased numbers in the second ICB-refractory metastasis. The first metastasis showed dense infiltration of CD8+ T cells, the second showed immune exclusion with loss of melanoma cell Major histocompatibility complex (MHC)-I expression associated with downregulation of antigen presentation pathway gene expression. CD8+ TRM from both metastases responded to autologous melanoma cells more robustly than all other CD8+ T cell subsets. In addition, CD8+ TRM shared TCR clones across metastases, suggesting a response to common antigens, which was supported by recognition of the same neoantigen by expanded tumor infiltrating lymphocytes.

Conclusions: In this study, we identified TRM clusters in VM metastases from a patient, but not primary disease. We showed TRM location at the tumor margin, and their superior functional response to autologous tumor cells, predicted neoantigens and melanoma differentiation antigens. These CD8+ TRM exhibited the highest tumor-responsive potential and shared their TCR with tumor-infiltrating effector memory T cells. This suggests VM metastases from this patient retain strong antitumor T cell functional responses; however, this response is suppressed in vivo. The loss of VG MHC-I expression is a common immune escape mechanism which was not addressed by anti-PD-1 monotherapy; rather an additional targeted approach to upregulate MHC-I expression is required.

Keywords: CD8-Positive T-Lymphocytes; Immune Evation; Immunotherapy; Melanoma.


Conflict of interest statement

Competing interests: AP, NK and SPK were supported by imCORE, F. Hoffmann-La Roche. MP is an employee of F. Hoffmann-La Roche. DEG has been on advisory board for Amgen, Q Biotics, Provectus and Bayer. SS has been receiving advisory board fees, paid to her institution, and grant support from AstraZeneca and Merck Sharp & Dohme, and grant support from Amgen, Endocyte, and Genentech.

Figures

Figure 1
Figure 1
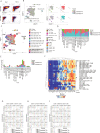
CD8+ TRM cells clustered at the tumor margin and were more proximal to vaginal melanoma cells than other T cells (A) H&E staining and multiplex IHC spatial plots of the three tumor samples where each dot represents a cell: melanoma (SOX10+ DAPI+), CD4+ T cells (DAPI+ CD3+ CD4+), CD4+ Tregs (DAPI+ CD3+ CD4+ Foxp3+), CD8+ T cells (DAPI+ CD3+ CD8+CD103-), CD8+ CD103+ TRM (DAPI+ CD3+ CD8+CD103+). Magenta arrow: are with CD8+ CD103+ TRM. (B) Representative image of fluorescent staining, depicting the black boxed area in the metastatic sample. Red arrow: CD3+ CD8+ CD103+ T cell, yellow arrow: CD3+ CD4+ Foxp3+ Tregs, pink arrow: CD3+ CD4+ T cells, green arrow: CD3+ CD8+ T cells. (C) Area (mm2) of each tumor sample. (D) Density of each cell type in the melanoma samples. (E–I) Spatial relationship (um)between TRM cells and melanoma, and TRM with other T cell subsets. (L, M) MHC-I and MHC-II expression detected by IHC staining of FFPE tissue. (N) Bubble plot of differentially expressed pathways between the three specimens as identified by ClueGO in Cytoscape on differentially expressed called genes by nSolver. P value is adjusted with Benjamini-Hochberg correction. In shades of red, the pathways upregulated in Met 1, in shades of green the ones in the primary and in turquoise the one in Met2. (O) Heatmap of significantly (p<0.05) differentially expressed pathways between normal vaginal mucosa and vaginal mucosal melanoma from, determined by GSVA on the 137 genes overlapping between the nCounter Nanostring PanCancer Immune Profiling and the PanCancer 360 IO. The heatmap was then calculated including the primary samples from our study too. FFPE, formalin-fixed paraffin-embedded; GSVA, Gene Set Variation Analysis; IHC, immunohistochemistry; TRM, tissue resident memory.
Figure 2
Figure 2
Mass cytometry revealed CD8+ TRM cells were present across metastatic samples and expanded TILs. Mucosal melanoma TILs from Met1 and Met2 were either untreated, or expanded in vitro, and then analyzed by mass cytometry. Shown are (A) HLA-DR, HLA-ABC and PDL1 expression on CD45- live cells. Mass cytometry data from the four samples were collated into one file and analyzed by the FLOWSOM algorithm, TILs (CD45+ HLA-ABC+ live cells) were clustered into 25 subsets based on protein expression in a UMAP display showing the distribution of individual samples (B) within the UMAP via contour (left) or colored clusters (right). Using the same UMAP display, also shown is the individual immune clusters as unique colored contours (C). Using the data from (B, C), the percentage of each sample was calculated for each cluster (D) and the percentage of each cluster represented in each sample (E). Also shown is the protein array data represented as a heat map for each immune cluster (F), and violin plots depicting scaled expression of select markers on CD8+ TRM and related cell clusters (G–I) present in the tumor samples. TILs, tumor-infiltrating lymphocytes; TRM, tissue resident memory; UMAP, Uniform Manifold Approximation and Projection
Figure 3
Figure 3
CD8+ TRM cells were the most tumor-responsive T cell cluster in mucosal melanoma. T cells isolated from the Met2 sample were bound with pembrolizumab. (A, B) In vivo administered pembrolizumab was detected on tumor samples by staining with anti-human IgG4. (C) PD1 detection on Met1 TILs and expanded TILs via in vitro staining with pembrolizumab and detection with anti-human IgG4 (aPD1). ET=expanded TILs. (D–G) Tumor T cell responses to in vitro overnight stimulation of Met1 (D, E) or Met2 (F, G) samples after staining with pembrolizumab or isotype control or addition of different stimuli. (NS=non stimulated, CD3=CD3/CD28 Immunocult, PMA=PMA/Ionomycin, CEF=CEF Peptivator, aPD1=pembrolizumab). T cell responses were detected as (D, F) 41BB and CD107a expression (E, G) Granzyme B, IFN-γ or TNF expression. (H–K) In vitro overnight stimulation of expanded TILs from the Met1 or Met2 sample with FACS sorted melanoma cells at a 2:1 TILs: melanoma ratio from either the Met1 (Met1 MEL) or the Met2 (Met2 MEL). TILs were stained with pembrolizumab or Isotype control before adding them to melanoma cells. Other stimuli are added to the media in the absence of melanoma cells. (L–O) FACS sorted T cells subsets were cultured for 11 days in the presence of irradiated and IFN-γ-stimulated tumor lines derived from Met1 and Met2 (Met1 Tu and Met2 Tu) at 1:1 ratio, with cytokines IL7, IL25 and IL2. On day 11, T cells were re-stimulated with the same tumor cell line overnight in the presence of Golgi Plug (Brefeldin A) for cytokine production, or absence for 41BB upregulation. The experiment was conducted once and technical replicates are shown. TILs, tumor-infiltrating lymphocytes; TRM, tissue resident memory.
Figure 4
Figure 4
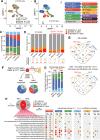
Single-cell gene expression and TCR sequencing revealed dynamic tissue-resident T cell populations at multiple metastatic sites. (A) UMAP dimensionality reduction of tumor tissue T cell populations (Met1 and Met2) and corresponding expanded T cell samples (Met1exp and Met2 exp). Following sequencing and T-cell specific filtering we obtained a total of 5730 cells across four samples (Met1: 1180, Met2: 841, Met1 exp: 1162 and Met2 exp: 2,547). (B) Principal component analysis and cluster identification of 13 cell populations among all 5730 cells in analysis. Cell phenotypes determined using cluster markers within cell markers to include TRM-like (blue: CD8A+, CD69+, CD103-), TRM (red: CD8A+, CD69+, CD103+), Tcm central memory T cells (purple), effector Teff cells (green), CD4 helper and Tregs (yellow), myeloid cells (black), dendritic cells (brown) and dead cells (gray). (C) Distribution of cell phenotype proportions in four samples following the amalgamation of similar cell types from B. (D) Paired αβ T cell receptor expansion analysis of all cells (left panel) and TRM cells only (right panel) from four samples and corresponding proportions of singleton clones (1 cell), doublets (2 cells with matching clonotype), and expanded clones (≥3 cells per matching clonotype). The total number of clonotypes in each category is shown in the table below. (E) Venn diagram depicting individual clonotype sharing between all four samples for all clusters (upper) and TRM cells only (lower). (F) Pie charts indicating conversion of TRM to other T cell phenotypes in Met1 (81 cells) and Met2 (117 cells) tissue samples following high dose IL-2 expansion (Met1 exp and Met2 exp). Matching αβ T cell receptor sequences were used to track cell phenotypes between samples. (G) Identification of the proportion of cells in non-TRM clusters also harboring a TRM αβ-TCR. High-dose IL2 expansion of tissue TILs indicated. (H) Shared TRM clonotypes (n=13) between Met1 and Met2 samples showing distribution in other T cell phenotypes and samples in the analysis according to the singlet, doublet and expanded status. TCR, T cell receptor; TRM, tissue resident memory.
Figure 5
Figure 5
Metastases shared neoantigens and similar mutational profiles corresponding to a mucosal clonal origin of tumor cells. (A) Tumor genomic mutations. Each row represents a mutation (259 in total), and each column represents a sample. ‘Wild-type’ indicates absent mutations in a given sample. Color indicates the type of mutation. (B) Copy number variations are represented per chromosome and a color scale to indicate the number of detected alterations per region. (C) Mutational signatures as identified using version 2 of the COSMIC database. (D) Predicted neoantigens for MHC class I and MHC class II. The allele fraction of expressed mutations observed in the RNA-Seq data is shown for Met1 (x-axis) vs Met2 (y-axis). The expression status of each mutation in the primary sample is indicated as absent/present in the legend. (E) Fold ratio of cytokine production and CD107a expression within CD8+ T cells after 3.5 hours in vitro restimulation of expanded TILs with irradiated autologous lymphoblastoma cell line (LCL) coated with neoantigen peptides or with IFN-γ-stimulated autologous melanoma cell lines. The cytokine production ratio is calculated compared with non-peptide pulsed LCL (LCL-0). As controls, cells were restimulated with Immunocult (a-CD3/a-CD28) or PMA. Expanded TILs were previously cultured for 11 days in the presence of the same stimuli used for the restimulation. The experiment was conducted once. MHC, major histocompatibility complex; TILs, tumor-infiltrating lymphocytes.

Similar articles

Cited by

References

    1. Nobbenhuis MAE, Lalondrelle S, Larkin J, et al. . Management of melanomas of the gynaecological tract. Curr Opin Oncol 2014;26:508–13. 10.1097/CCO.0000000000000104 - DOI - PubMed
    1. Mihajlovic M, Vlajkovic S, Jovanovic P, et al. . Primary mucosal melanomas: a comprehensive review. Int J Clin Exp Pathol 2012;5:739–53. - PMC - PubMed
    1. Sanchez A, Rodríguez D, Allard CB, et al. . Primary genitourinary melanoma: epidemiology and disease-specific survival in a large population-based cohort. Urol Oncol 2016;34:166.e7–166.e14. 10.1016/j.urolonc.2015.11.009 - DOI - PubMed
    1. St Clair C, Wethington S, Eaton A, eds. Vulvar and vaginal melanoma——a single institutional experience 1995–2012. 44th Annual Meeting on Women’s Cancer, 2013.
    1. Hou JY, Baptiste C, Hombalegowda RB, et al. . Vulvar and vaginal melanoma: a unique subclass of mucosal melanoma based on a comprehensive molecular analysis of 51 cases compared with 2253 cases of nongynecologic melanoma. Cancer 2017;123:1333–44. 10.1002/cncr.30473 - DOI - PubMed

Publication types

Substances