. 2022 May;24(5):659-671.
doi: 10.1038/s41556-022-00899-8. Epub 2022 May 12.

Migratory and anti-fibrotic programmes define the regenerative potential of human cardiac progenitors

Affiliations

Migratory and anti-fibrotic programmes define the regenerative potential of human cardiac progenitors

Christine M Poch et al. Nat Cell Biol. 2022 May.

Abstract

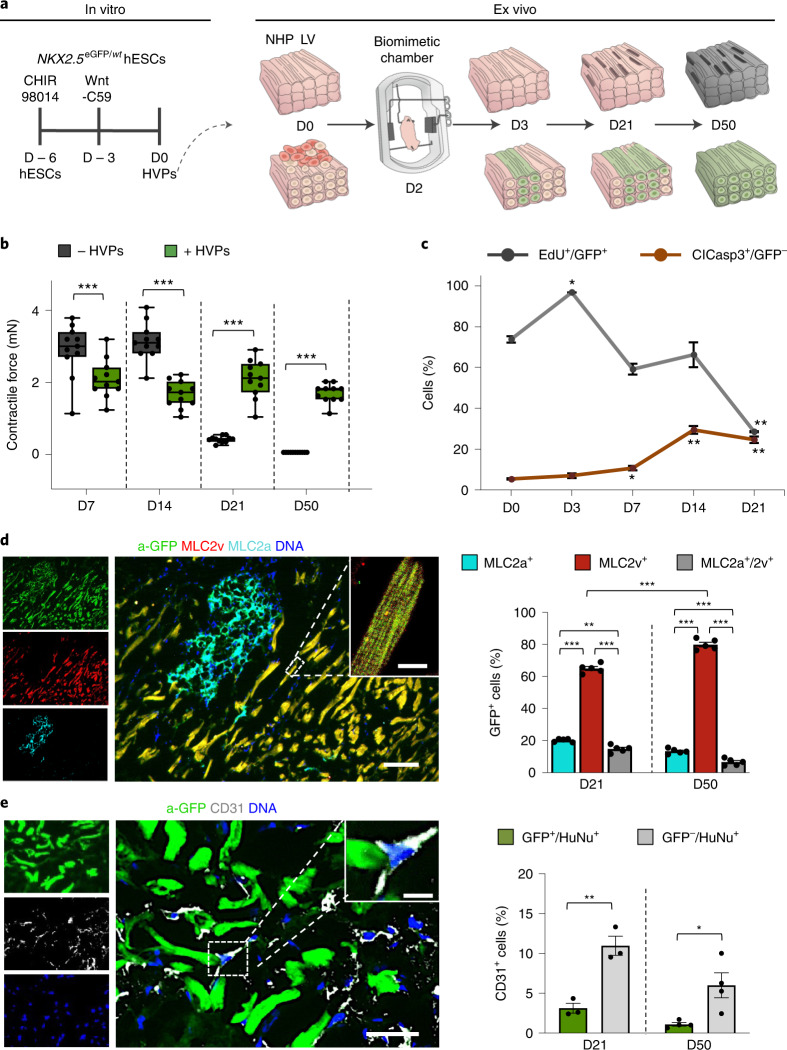
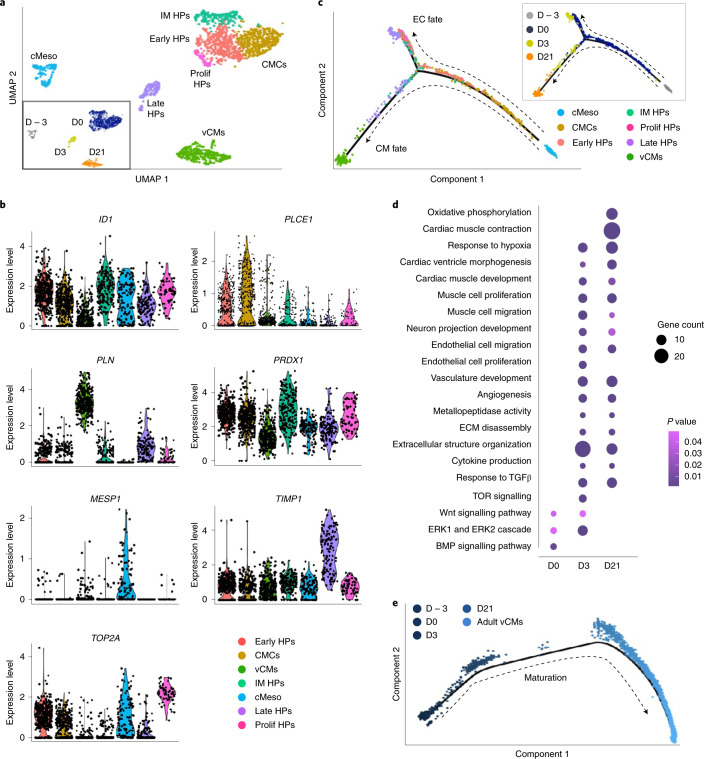
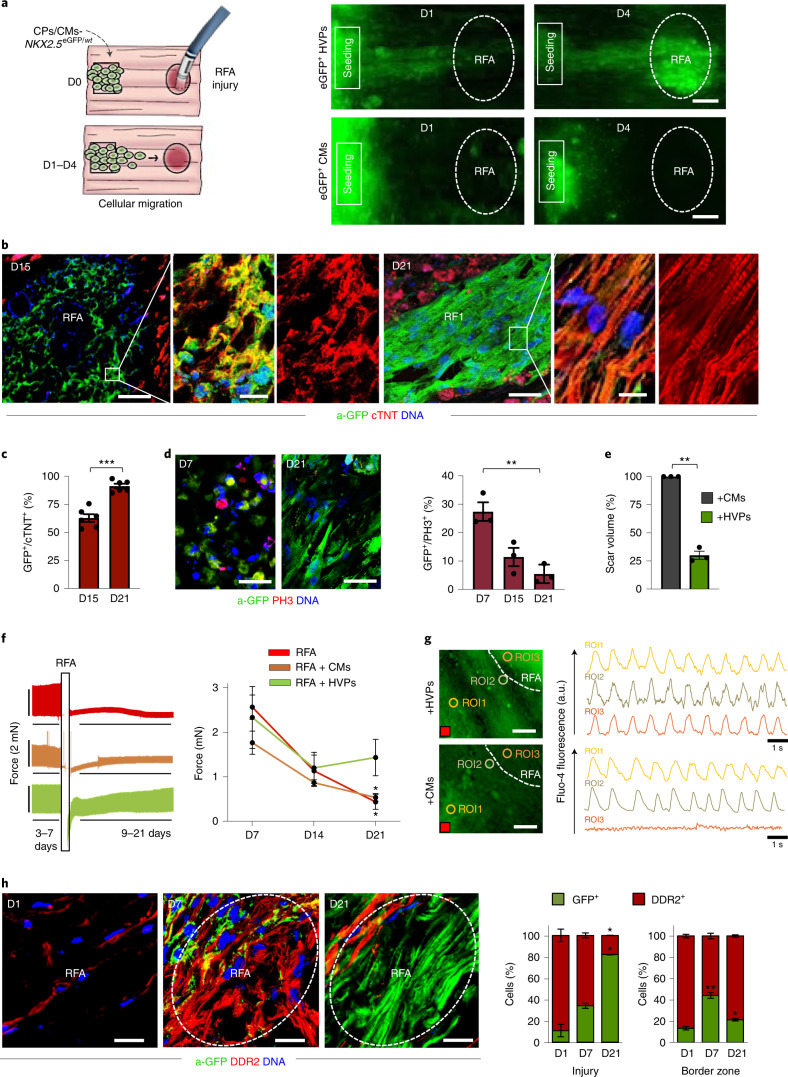
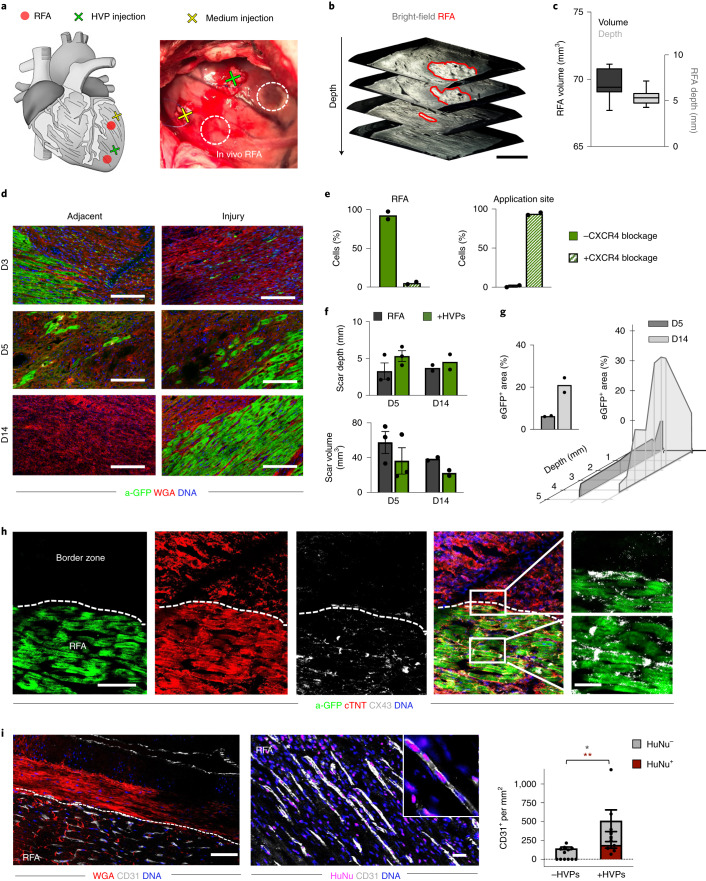
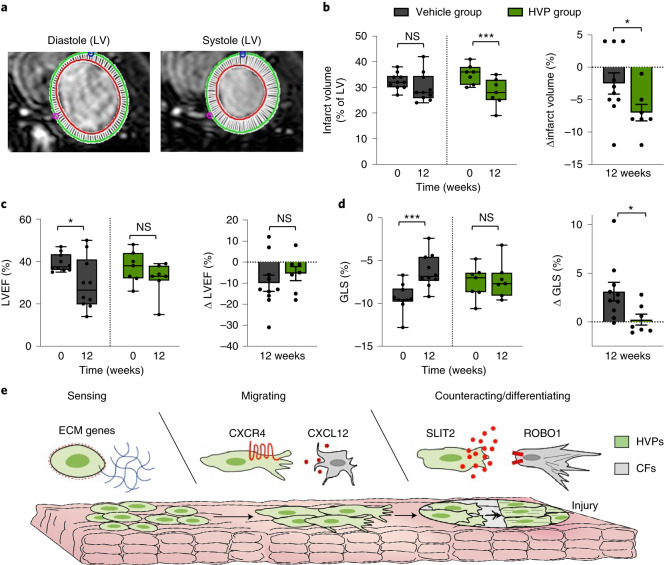
Heart regeneration is an unmet clinical need, hampered by limited renewal of adult cardiomyocytes and fibrotic scarring. Pluripotent stem cell-based strategies are emerging, but unravelling cellular dynamics of host-graft crosstalk remains elusive. Here, by combining lineage tracing and single-cell transcriptomics in injured non-human primate heart biomimics, we uncover the coordinated action modes of human progenitor-mediated muscle repair. Chemoattraction via CXCL12/CXCR4 directs cellular migration to injury sites. Activated fibroblast repulsion targets fibrosis by SLIT2/ROBO1 guidance in organizing cytoskeletal dynamics. Ultimately, differentiation and electromechanical integration lead to functional restoration of damaged heart muscle. In vivo transplantation into acutely and chronically injured porcine hearts illustrated CXCR4-dependent homing, de novo formation of heart muscle, scar-volume reduction and prevention of heart failure progression. Concurrent endothelial differentiation contributed to graft neovascularization. Our study demonstrates that inherent developmental programmes within cardiac progenitors are sequentially activated in disease, enabling the cells to sense and counteract acute and chronic injury.


Conflict of interest statement

J.C. and R.B. are employees of Procella Therapeutics. K.J., Q.-D.W., R.F.-D., J.H., D.H., M.F. and M.S. are employees of AstraZeneca. K.S.F. and K.R.C. are co-inventors on a patent (Patent no. 10508263) based on the HVP technology and its applications. The HVP intellectual property is assigned to Procella Therapeutics. A.D. holds a patent (Patent no. USN 15/781,454) on the technology of biomimetic cultivation and is co-founder and shareholder of InVitroSys GmbH. The other authors declare no competing interests.

Figures

Fig. 1
Fig. 1. HVPs expand, repopulate and functionally mature in an ex vivo 3D NHP heart model.
a, Schematic of the experimental setup for in vitro differentiation of HVPs from NKX2-5eGFP/wt hESCs (left) and their ex vivo co-culture with native NHP-LV slices in biomimetic chambers (right). b, Contractile force of ex vivo cultured NHP heart slices with and without HVPs on indicated days of co-culture. Box plot shows all data points as well as minimum, maximum, median and quartiles; n = 11 biological replicates per group; ***P < 0.001 (two-way ANOVA). c, Percentage of EdU+/eGFP+ and ClCasp3+/eGFP cells during co-culture. Data are mean ± s.e.m.; n = 3 biological replicates per timepoint for EdU analysis; n = 4 biological replicates per timepoint for ClCasp3 analysis; *P < 0.05, **P < 0.005 versus D0 (one-way ANOVA). d,e, Left: representative immunofluorescence images of D50 chimeric human–NHP heart constructs using an antibody against GFP (a-GFP) together with antibodies for MLC2a and MLC2v (d) or CD31 (e). Scale bars, 100 µm (d), 50 µm (e) and 10 µm (insets). Right: percentage of eGFP+ cells expressing MLC2v, MLC2a or both (d) and human cells expressing CD31 (e) on D21 and D50. HuNu, human nuclear antigen. Data are mean ± s.e.m. and individual data points; n = 5 biological replicates per timepoint in d, n = 3 biological replicates per timepoint in e; *P < 0.05, **P < 0.005, ***P < 0.001 (two-way ANOVA for d and t-test for e). For be, exact P values and numerical data are provided in Source Data Fig. 1. Source data
Fig. 2
Fig. 2. scRNA-seq reveals dynamic transcriptional changes of HPs in the ex vivo 3D NHP heart model.
a, UMAP clustering of single cells captured on D − 3 and D0 of in vitro differentiation together with D3 and D21 of ex vivo co-culture. cMeso, cardiac mesoderm; CMCs, cardiac mesenchymal cells; early HPs, early heart progenitors; IM HPs, intermediate heart progenitors; late HPs, late heart progenitors; prolif HPs, proliferating heart progenitors; vCMs, ventricular CMs. b, Violin plots of cluster-specific marker genes; P < 0.05. c, Developmental trajectory analysis of captured cells coloured by population identity and time of collection (inset). EC, endothelial cell. d, Representative GO terms upregulated during ex vivo co-culture. e, Pseudotime trajectory of captured cells combined with adult vCMs from Wang et al.. Colour gradient (from dark to light) according to maturation. For a and ce, single cells have been dissociated from three biological replicates. Numerical data are provided in Source Data Fig. 2. Source data
Fig. 3
Fig. 3. HVPs show directed migration towards acute cardiac RFA injury and remuscularize the scar.
a, Left: schematic of experimental design for selective seeding of NKX2-5eGFP/wt hESC-derived HVPs or CMs onto bioprinted frame on NHP heart slices and RFA injury on the opposite tissue site. Right: live imaging of eGFP signal on indicated days. Scale bars, 200 µm. b, Representative immunostaining of a-GFP and cTNT in NHP constructs on D15 and D21 after RFA. Magnifications of framed areas are shown in adjacent panels. Scale bars, 200 µm (D15), 100 µm (D21) and 10 µm (magnifications). c, Statistical analysis of GFP+ HVPs expressing cTNT on D15 and D21. Data are mean ± s.e.m. and individual data points; n = 6 biological replicates per timepoint; ***P < 0.001 (t-test). d, Left: immunofluorescence images of proliferating (PH3+) cells on D7 and D21. Right: statistical analysis of PH3+/GFP+ cells on D7, D15 and D21. Data are mean ± s.e.m. and individual data points; n = 3 biological replicates per timepoint; **P < 0.005 (one-way ANOVA). Scale bar, 100 µm. e, Statistical analysis of relative reduction of scar volume with HVPs compared with CMs on D21. Data are shown as mean ± s.e.m. and individual data points; n = 3 biological replicates per group; **P < 0.005 (t-test). f, Left: representative recordings of contractile force before and after RFA, separated by a blanking period of 2 days for re-adjustment of preload. Right: corresponding statistical analysis. Data are shown as mean ± s.e.m.; n = 3 biological replicates per condition; *P < 0.05 versus D7 of the same group (two-way ANOVA). g, Representative images of Fluo-4-loaded NHP-HVP and NHP-CM constructs (left) and corresponding Ca2+ transients at indicated regions of interest (ROI) (right). Scale bar, 100 μm. Red box indicates stimulation point (1 Hz). h, Left: representative immunostaining of a-GFP and DDR2 in NHP constructs at indicated days after RFA. Scale bars, 200 µm. Right: percentage of a-GFP+ and DDR2+ cells at RFA injury or border zone. Data are mean ± s.e.m.; n = 3 biological replicates per timepoint; *P < 0.05, **P < 0.005 versus D1 of corresponding group (two-way ANOVA). For cf and h, exact P values and numerical data are provided in Source Data Fig. 3. Source data
Fig. 4
Fig. 4. HVPs are chemoattracted to sites of cardiac injury via CXCL12/CXCR4 signalling and undergo dynamic functional states in the process of injury repair.
a, Left: representative images of HVPs seeded on an injured NHP heart slice at the timepoints used for cell collection (24 h and 48 h) (top) and UMAP plot of all captured cells (bottom). Right: relative UMAP clustering of captured cells. Mφ, macrophages. b, Circos plot for ligand–receptor pairing showing top ten interactions identified in scRNA-seq of NHP-HVP constructs at 24 and 48 h after RFA injury and HVP application. Fraction of expressing cells and link direction (chemokine to receptor) are indicated. c, Percentage of chemoattracted HVPs in trans-well migration assays in absence and presence of low dose (LD) or high dose (HD) of CXCL12 (left), after addition of the indicated receptor blockers (middle) or after application of the pharmacologic CXCR4 blockage AMD3100 in LD or HD (right). Data are indicated as mean ± s.e.m. with individual data points; n = 3 biological replicates per condition; *P < 0.05, **P < 0.005, ***P < 0.001 versus CXCL12 HD (one-way ANOVA). d, Human scRNA-seq 24 h and 48 h datasets are integrated with D0 and D21 CM dataset and projected onto UMAP plots, coloured by cluster assignment and annotated post hoc. Both the aligned (left) and split (right) views are shown. HVPs (na), non-activated; HVPs (s), sensing; HVPs (m/c), migrating and counteracting. e, PCA plot of different cell clusters, with the principal curve indicating the pathway of injury response. f, Dot plot showing gene signature shifts among different dynamic cellular states. The shadings denote average expression and the size of dots the fractional expression. For df, single cells have been isolated from three biological replicates. Exact P values and numerical data are provided in Source Data Fig. 4. Source data
Fig. 5
Fig. 5. SLIT2/ROBO1 signalling mediates activated CF repulsion and prevents myocardial scarring.
a, Top: schematic of 2D model for RFA injury of NHP CFs expressing dsRed followed by NKX2-5eGFP/wt HVP seeding and monitoring of co-culture. Bottom: sequential live imaging of dsRed+ and eGFP+ cells during migration. Scale bars, 200 µm. b, Left: representative time-lapse images of dsRed+ and eGFP+ cells at the RFA injury site during CF repulsion on indicated days. Dotted line delineates HVP migration front. Scale bar, 100 µm. The numbers indicate individual cells followed and tracked during the time lapse imaging. Right: cell tracking over time (top) and average movement (bottom) analysis of HVPs and CFs. c, Representative immunostaining for eGFP, SLIT2 and ROBO1 on D3 and D8. Scale bars, 25 µm. d, F-actin and eGFP immunofluorescence an D8 after ROBO1 antibody exposure for 10 and 40 min. Change of CF shape (arrow head) and F-actin localized on protrusion side of CFs (arrow). Scale bars, 75 µm. e, Percentage of repulsed CFs at the injured site analysed on D7.5 and D8 in standard condition (untreated) or after ROBO1 antibody and rhSLIT2 treatment on D7. Data are normalized to D7 and presented as mean ± s.e.m. and individual data points; n = 3 biological replicates per condition; *P < 0.05, **P < 0.005 versus untreated (t-test). f, Flow cytometry analysis for ROBO1 and POSTN in CFsdsRed after 8 days of co-culture with HVPs. Data are shown as mean ± s.e.m. and individual data points; n = 4 biological replicates per condition; *P < 0.05, ***P < 0.001 (t-test). For e and f, exact P values and numerical data are provided in Source Data Fig. 5. Source data
Fig. 6
Fig. 6. HVPs regenerate RFA-injured porcine myocardium in vivo.
a, Schematic of in vivo experimental design with two left ventricular RFA injuries and adjacent injection of HVPs or cell-free medium. b, Representative 3D reconstruction of non-transmural RFA injury. Scale bar, 2 mm. c, Statistical analysis of scar volume and depth of RFA injuries in freshly explanted wild-type pig hearts indicating standardized injury size. Box plot shows minimum, maximum, median and quartiles; n = 3 biological replicates. d, Representative fluorescence images of injury and adjacent sites after wheat germ agglutinin (WGA) and a-GFP co-staining on days D3, D5 and D14. Scale bars, 100 µm. e, Analysis of cells at application site and RFA in the presence or absence of pharmacological CXCR4 blockage (AMD3100) on day 5. Data are mean with individual data points; n = 2 biological replicates per condition. f, Analysis of in vivo scar depth and volume on D5 and D14 with or without HVP treatment. Data are mean ± s.e.m. with individual data points; n = 3 biological replicates per group on day 5, n = 2 biological replicates per group on day 14. g, Percentage of GFP+ area within the RFA injury (left) and according to depth of the cutting plane (right). Data are mean with individual data points; n = 2 biological replicates per group. h, Representative immunofluorescence images of RFA and border zone on D14 for anti-GFP, cTNT and CX43. Magnifications on the right correspond to the boxed area in the merged image. Scale bars, 50 µm and 10 µm (magnifications). i, Representative fluorescence images of HVP-treated RFA injury site after immunostaining for CD31 in combination with WGA (left) or with anti-human nuclei (HuNu, right). Scale bars, 50 µm (left), 25 µm (right). Bar graph shows the average number of CD31+ cells per mm2 cells from host (HuNu) and human HVPs (HuNu+) in HVP-treated and untreated RFAs. Data are presented as mean ± s.e.m. with individual data points; n = 6 biological replicates per group; *P < 0.05, **P < 0.005 (two-way ANOVA). For c, eg and i, exact P values and numerical data are provided in Source Data Fig. 6. Source data
Fig. 7
Fig. 7. HVPs remuscularize chronic scars in a porcine model of chronic ischaemia in vivo.
a, Schematic of in vivo experimental design of acute MI by balloon occlusion of the LAD coronary artery (ischaemia) and reperfusion after 90 min. Triple- immunosuppressive regimen (IMS) with cyclosporine (D − 6 to D84), methylprednisolone (D − 1 to D84) and abatacept (D − 1 to D84). Analysis of baseline infarct volume by cMRI on day −6 followed by epicardial cell injection (15 injection sites, total 1 × 109 HVPs) into myocardial injury. Follow-up period of 12 weeks with cMRI scans at 12 weeks before termination and histological work-up. b, Overview of infarct zone and human grafts with labelling of porcine myocardium (HuNu cTNT+), infarct zone and cTNT+ graft (HuNu+ cTNT+). Scale bar, 2 mm. ce, Immunohistochemistry of graft for cardiac ventricular muscle marker (MLC2v) (c), electrical coupling (N-cadherin) (d), and vessel formation (CD31) (e) at 12 weeks. Scale bar, 50 µm. Lower panels show magnifications of boxed areas. Scale bar, 15 µm.
Fig. 8
Fig. 8. HVPs preserve cardiac function in vivo.
a, Representative LV cMRI images of diastole and systole used for calculation of infarct volume, LVEF and GLS. bd, Statistical analysis of infarct volume (b), LVEF (c) and GLS (d). Infarct volume, LVEF and GLS (%) are shown as minimum-to-maximum range with mean and individual data points; NS, not significant; *P < 0.05, ***P ≤ 0.001 (two-way ANOVA). Delta values (Δ) are shown as mean ± s.e.m. and individual data points; *P < 0.05 (t-test); n = 10 pigs in the vehicle group and n = 7 pigs in the HVP-treated group. For bd, exact P values and numerical data are provided in Source Data Fig. 8. e, Schematic summary of HVPs undergoing dynamic cellular states during cardiac tissue repair. HVPs sense tissue damage by activating programmes of ECM remodelling and migration and are chemoattracted to sites of cardiac injury via CXCR4/CXCL12 signalling. Counteraction to injury occurs via CF repulsion in a SLIT2/ROBO1-dependent manner and subsequent CM differentiation to remuscularize scar tissue. Source data
Extended Data Fig. 1
Extended Data Fig. 1. Generation and analysis of an ex-vivo 3D chimeric human-NHP heart model.
a, Representative, overlapped traces of contractile force of native NHP heart slices cultured exvivo for 21 days in biomimetic chambers. b, Representative immunofluorescence images for activated cleaved caspase 3 (ClCasp3) and cardiac troponin T (cTNT) in ex vivo cultured NHP heart slices (left) and correspondent quantification (right) at the indicated days. Scale bars 50 µm. Data are shown as mean ± SEM and individual data points, n = 4 biological replicates per time point, *p < 0.05, **p < 0.01 (one-way ANOVA). c, Schematic of ESC differentiation into HVPs by Wnt pathway modulation followed by MACS depletion of Tra-1-60+ cells and cryopreservation until seeding. Single cell RNAseq confirmed expression of ISL1 and NKX2.5 and loss of brachyury T (TBXT) on D0. d, Left, custom-built bioprinting device with pneumatic printhead. Right, exemplary images of homogeneous or selective seeding of eGFP+ HVPs onto NHP heart slices by bioprinting. Scale bars 250 µm, inlet 75 µm. e, Live eGFP imaging of NHP heart slices after NKX2-5eGFP/wt HVP seeding at the indicated days of co-culture (top) and representative contractile force traces (bottom). Scale bars 200 µm. f, Flow cytometry analysis for EdU in eGFP+ cells isolated at the indicated days of co-culture. Data are shown as mean ± SEM and individual data points, n = 3 biological replicates per time point, *p < 0.05, **p < 0.005, ***p < 0.001 (one-way ANOVA). g, Immunostaining of eGFP in combination with cTNT and Connexin-43 (CX43) (left) or ISL1 and a-GFP (right) on D50 of co-culture. Scale bars 25 µm. Bar graph shows the percentage of eGFP+ cells expressing ISL1 and cTNT on the indicated days of co-culture as mean ± SEM and individual data points, n = 3 biological replicates per time point, ***p < 0.001 (two-way ANOVA). For b, f and g, exact p-values and numerical data are provided in Source Data Extended Data Fig. 1. Source data
Extended Data Fig. 2
Extended Data Fig. 2. scRNAseq analysis of human NKX2.5eGFP/wt HPs in a chronic injury model of NHP heart slices.
a, Heatmap showing expression of the top 10 genes in each cluster defined as 0- early heart progenitors (Early HPs), 1- cardiac mesenchymal cells (CMCs), 2- ventricular cardiomyocytes (vCMs), 3- intermediate heart progenitors (IM HPs), 4- cardiac mesodermal cells (cMeso), 5- late heart progenitors (Late HPs), 6- proliferating heart progenitors (Prolif HPs). b, Heatmap of different blocks of DEGs along the pseudotime trajectory and representative genes in each cluster. Cardiac mesodermal precursors (CMPs, D-3), endothelial cell (EC) fate (D0 and D3) and CM fate (D21). Selected top biological process and canonical pathway terms related to corresponding DEGs. c, Heatmap showing the expression of genes related to contraction (gray and red) and metabolism (blue and green) in eGFP+ cells on D3 and D21 of ex-vivo co-culture compared to adult human LV-CMs (Wang et al., 2020). Expression levels are presented as a colour code. d, Progressive analysis of myofibril assembly, calcium handling and electrophysiology signatures by quantitative RT-PCR, n = 3 biological replicates. Expression levels are presented colour coded. For a-c, single cells have been isolated from 3 biological replicates. Data from all replicates are included. Exact p-values and numerical data are provided in Source Data Extended Data Fig. 2. Source data
Extended Data Fig. 3
Extended Data Fig. 3. Generation and analysis of an acute ex-vivo NHP heart injury model.
a, Standardized non-transmural myocardial injury in NHP heart slices by defined RFA. Live and dead cells are stained by calcein and ethidium dimer, respectively (middle) Scale bar 200 µm. Intact ECM scaffold after RFA injury shown by WGA immunostaining. Scale bar 200 µm. Stainings were performed immediately after RFA. b, Representative fluorescence images of RFA-injured slices after immunostaining for Collagen type I (ColI) combined with cTNT (top) or DDR2 (bottom) on indicated days. Lower panels show images of the RFA area. Scale bars 30 µm (top) and 25 µm (bottom). c, Sequential live imaging of NKX2-5eGFP/wt HVPs migrating from the seeding frame into the tissue showing homogenous repopulation of the slice by D15 in the absence of RFA injury. Scale bars 200 µm. d, FACS analysis of HVP and CM batches before seeding indicating cellular purity (ISL-1, cTNT and TRA-1-60). Data are mean ± SEM and individual data points, n = 3 biological replicates per group, ***p < 0.001 vs HVPs (two-way ANOVA). e, Representative immunostainings of eGFP and cTNT in RFA-injured area on D14 after selective seeding of NKX2-5eGFP/wt HVPs (left) or CMs (right). Scale bars 50 µm. f, Two-photon live microscopy of RFA-injured slices for eGFP and second-harmonic-imaging (SHG) visualization of collagen and scar size on D21. Circles demarcate areas with collagen deposition. Scale bars 100 µm. g, Trans-well migration assays with D0 NKX2-5eGFP/wt HVPs in the upper and NHP heart slice in the lower compartment, respectively. Images show trans-well migrated HVPs on polycarbonate membrane in the absence (left) or presence of multiple (middle) or single (right) RFA injury. Dashed line marks the site of HVP accumulation. Scale bars 2 mm. h, Trans-well migration assays with D0 NKX2-5eGFP/wt HVPs in the upper and decellularized NHP heart slice in the lower compartment with a single RFA injury. Scale bar 2 mm. For d, exact p-values and numerical data are provided in Source Data Extended Data Fig. 3. Source data
Extended Data Fig. 4
Extended Data Fig. 4. scRNAseq analysis of human NKX2-5eGFP/wt HVPs and NHP cardiac cells after acute RFA heart injury.
a, Heatmap of top 50 genes in each cluster with representative genes indicated. 0. Early HVPs; 1. NHP CFs; 2. Activated HVPs; 3. Migrating HVPs; 4. NHP Mφ; 5. Proliferating HVPs; 6. Early vCMs. HVPs, human ventricular progenitors; NHP, non-human primate; CFs, cardiac fibroblasts; Mφ, macrophages; vCMs, ventricular cardiomyocytes. b, Representative GO terms upregulated in cluster 3 (migrating HVPs) compared to the other human clusters (0, 2, 5, 6). c, Violine plots of CXCL12 and its binding targets identified by italk analysis of scRNA sequencing of migrating HVPs, NHP CFs and NHP Mφ. d, Representative immunostainings of a-GFP, cardiac troponin T (cTNT) and DDR2 on D15 after injury at seeding site and RFA in the absence of CXCR4 blockage (AMD3100-) or in the presence of CXCR4 blockage (AMD3100+). Scale bars 25 µm. Statistical data are shown as mean ± SEM and individual data points, n = 3 biological replicates per condition, *** p < 0.001 (two-way ANOVA). For a-c single cells have been isolated from 3 biological replicates. Data from all replicates are included. Exact p-values and numerical data are provided in Source Data Extended Data Fig. 4. Source data
Extended Data Fig. 5
Extended Data Fig. 5. Gene signatures of dynamical cardiac progenitor states and proteomic analysis of secretome during acute injury response.
Heatmap of top 30 genes depicting the expression of DEGs in non-activated HVPs (cluster 2), sensing HVPs (cluster 0), and migrating/counteracting HVPs (cluster 4). b, Proteomic analysis of supernatant of injured NHP heart slices with and without application of HVPs at 48 h after RFA. NHP, H, and ambiguous, was assigned to proteins for which the majority of identified peptides belonged to protein sequences of Macaca Fascicularis, Homo Sapiens, or both species, respectively. n = 3 biological replicates per group, p-value ≤0.05. Data from all replicates are included. For a and b, numerical data are provided in Source Data Extended Data Fig. 5. Source data
Extended Data Fig. 6
Extended Data Fig. 6. Analysis of CF repulsion signalling during acute injury response in 2D monolayer.
a, Representative images of eGFP+ HVPs and dsRed+ CFs after F-actin staining during the repulsion phase in the injury area on D8. b, Quantitative RT-PCR analysis of ROBO1 and SLIT2 expression in injured CFs cultured with HVPs (CFs + HVPs) or alone in conditioned medium from HVPCF co-culture (CFs cond) on D8. Data are mean ± SEM and individual data points, n = 3 biological replicates per condition, **p < 0.01 ***p < 0.001 (t-test). c, Representative F-actin immunostaining on D8 in standard condition and after ROBO1 antibody exposure for 10 and 40 minutes showing CFs in contact with HVPs (proximal) and CFs in the remote area from the injury site (distal). d, Immunodetection of eGFP in conjunction with Phalloidin (F-actin) stain in HVPCF co-culture on D8 after recombinant human SLIT2 (rhSLIT2) exposure for 10 and 40 minutes. Nuclei were counterstained with Hoechst and CFs are labelled with dsRed (a, c, d). Scale bars 75 µm (a, c, d). For b, exact p-values and numerical data are provided in Source Data Extended Data Fig. 6. Source data
Extended Data Fig. 7
Extended Data Fig. 7. Immune-cell analyses of LEA29Y pig hearts after RFA injury and HVP injection in-vivo.
a, Image of a freshly explanted LEA29Y pig heart 14 days after in-vivo RFA and adjacent HVP injection showing no macroscopic signs of teratoma formation. b, Representative fluorescence images of control RFA and adjacent area (top) or magnified zoom of control RFA (bottom) after CD31 immunodetection and WGA labelling. Scale bars 100 µm (top) and 10 µm (bottom). c, Representative immunofluorescence stainings of CD68 (left) and correspondent statistical analysis (right) of RFA and adjacent areas in the presence or absence of HVPs. Scale bars 25 µm. Data are shown as mean ± SEM and individual data points, n = 7 biological replicates per group, *p < 0.05, **p < 0.01, ***p < 0.001 (one-way ANOVA). Exact p-values and numerical data are provided in Source Data Extended Data Fig. 7. Source data
Extended Data Fig. 8
Extended Data Fig. 8. Macro- and microscopic analyses of pig hearts after chronic myocardial ischemia and HVP-injection.
a, Image of freshly explanted pig heart 84 days after in-vivo HVP-injection indicating injection sites (A, B), showing no macroscopic signs of teratoma. b, Negative immunostaining for OCT4 confirms absence of undifferentiated pluripotent stem cells in the human graft after 12 weeks. Scale bar 50 µm. c, Representative immunohistochemistry images of scar (left) and border area (right) after HVP-injection with marked human nuclei (HuNu) and cTNT. Scale bars 250 µm (left) and 1 mm (right). d, Quantification of Cyclosporin A concentrations (immunosuppression) in whole blood of HVP- and vehicle-treated animals performed regularly throughout follow up period. Data are shown as mean ± SEM. n = 10 pigs in vehicle treated group and n = 7 pigs in HVP-treated group. Numerical data are provided in Source Data Extended Data Fig. 8. Source data

Comment in

References

    1. Porrello ER, et al. Transient regenerative potential of the neonatal mouse heart. Science. 2011;331:1078–1080. doi: 10.1126/science.1200708. - DOI - PMC - PubMed
    1. Tzahor E, Poss KD. Cardiac regeneration strategies: staying young at heart. Science. 2017;356:1035–1039. doi: 10.1126/science.aam5894. - DOI - PMC - PubMed
    1. Bergmann O, et al. Dynamics of cell generation and turnover in the human heart. Cell. 2015;161:1566–1575. doi: 10.1016/j.cell.2015.05.026. - DOI - PubMed
    1. Travers JG, Kamal FA, Robbins J, Yutzey KE, Blaxall BC. Cardiac fibrosis: the fibroblast awakens. Circ. Res. 2016;118:1021–1040. doi: 10.1161/CIRCRESAHA.115.306565. - DOI - PMC - PubMed
    1. Lozano R, et al. Global and regional mortality from 235 causes of death for 20 age groups in 1990 and 2010: a systematic analysis for the Global Burden of Disease Study 2010. Lancet. 2012;380:2095–2128. doi: 10.1016/S0140-6736(12)61728-0. - DOI - PMC - PubMed

Publication types

Substances