. 2022 Jul 15:447:116057.
doi: 10.1016/j.taap.2022.116057. Epub 2022 May 10.

A novel chronic in vivo oral cadmium exposure-washout mouse model for studying cadmium toxicity and complex diabetogenic effects

Affiliations

A novel chronic in vivo oral cadmium exposure-washout mouse model for studying cadmium toxicity and complex diabetogenic effects

Winifred P S Wong et al. Toxicol Appl Pharmacol. .

Abstract

Type II diabetes mellitus (T2DM) is characterized by insulin resistance, β-cell dysfunction and hyperglycemia. In addition to well known risk factors such as lifestyle and genetic risk score, accumulation of environmental toxicants in organs relevant to glucose metabolism is increasingly recognized as additional risk factors for T2DM. Here, we describe the development of an in vivo oral cadmium (Cd) exposure model. It was shown that oral Cd exposure in drinking water followed by washout and high fat diet (HFD) in C57BL/6N mice results in islet Cd bioaccumulation comparable to that found in native human islets while mitigating the anorexic effects of Cd to achieve the same weight gain required to induce insulin resistance as in Cd naïve control mice. Inter individual variation in plasma glucose and insulin levels as well as islet Cd bioaccumulation was observed in both female and male mice. Regression analysis showed an inverse correlation between islet Cd level and plasma insulin following a glucose challenge in males but not in females. This finding highlights the need to account for inter individual target tissue Cd concentrations when interpreting results from in vivo Cd exposure models. No effect of Cd on insulin secretion was observed in islets ex vivo, highlighting differences between in vivo and ex vivo cadmium exposure models. In summary, our oral in vivo Cd exposure-washout with HFD model resulted in islet Cd bioaccumulation that is relevant in the context of environmental cadmium exposure in humans. Here, we showed that islet Cd bioaccumulation is associated with complex cadmium-mediated changes in glucose clearance and β-cell function. The model described here will serve as a useful tool to further examine the relationship between Cd exposure, islet Cd bioaccumulation, dysglycemia and their underlying mechanisms.

Keywords: Cadmium; High fat diet; Insulin; Mouse model; Pancreatic islets; Type II diabetes.


Conflict of interest statement

Declaration of interests

The authors declare that they have no known competing financial interests or personal relationships that could have appeared to influence the work reported in this paper.

The authors declare the following financial interests/personal relationships which may be considered as potential competing interests:

Figures
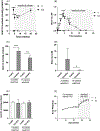
Fig. 1:
Fig. 1:
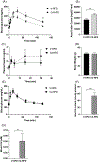
(A) Islet Cd content (normalized to total islet protein) and (B) blood Cd levels in male mice exposed to either V (n=4–5) or 1mM CdCl2 (n=4–8) for 4 weeks followed by 16 weeks of washout (Table 1, Cohort #1). (C) Islet Cd content, (D) blood Cd levels, (E) islet Zn content and (F) body weight curve in male mice exposed to either V (n=3–6) or 1mM CdCl2 (n=3–6) for 19.5 weeks on regular chow followed by 3 and 15 weeks washout with high fat diet (HFD, Table 1, Cohort #5). V-HFD, Vehicle-exposed followed by washout and HFD; Cd-HFD, Cd-exposed followed by washout and HFD. Data are expressed as mean ± SEM. *p<0.05, **p<0.01, ***p<0.001.
Fig 2:
Fig 2:
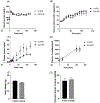
(A) Blood glucose, (B) area under the curve, (C) plasma insulin and (D) fasting body weight during GSIS about 11.4 ± 0.1 weeks into washout phase with HFD in male mice exposed to either V (n=7) or 1mM CdCl2 (n=6) for 19.1 ± 0.7 weeks with HFD. (E) Blood glucose during glucose tolerance test 24 weeks into washout phase with HFD in V (n=7) or Cd-exposed (n=6) male mice on HFD (Table 1, Cohort #2). (F) Islet Cd content and (G) blood Cd in male mice exposed to either V (n=6) or 1mM CdCl2 (n=6) for 19 weeks with HFD followed by 31.3 ± 0.1 weeks of washout with HFD (Table 1, Cohort #3). V-HFD, Vehicle-exposed followed by washout and HFD; Cd-HFD, Cd-exposed followed by washout and HFD. Data are expressed as mean ± SEM. *p<0.05, **p<0.01, ***p<0.001.
Fig. 3:
Fig. 3:
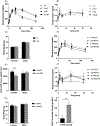
(A) Arterial blood glucose, (B) glucose infusion rate, (C) plasma insulin, (D) plasma c-peptide and (E) body weight during hyperglycemic clamp in mice exposed to either V (n=6) or 0.5mM CdCl2 (n=7) for 17 weeks followed by 12 weeks of washout with HFD on V water (Table 1, Cohort #6). (F) Islet insulin secretion in response to high glucose and several insulin secretagogues from V and Cd-exposed mice following 12 weeks of washout with HFD (n=5/group). (G) Total islet insulin content following islet perifusion in V and Cd-exposed mice islets following 12 weeks of washout with HFD (n=5/group). V-HFD, Vehicle-exposed followed by washout and HFD; Cd-HFD, Cd-exposed followed by washout and HFD. Data are expressed as mean ± SEM. *p<0.05.
Fig. 3:
Fig. 3:
(A) Arterial blood glucose, (B) glucose infusion rate, (C) plasma insulin, (D) plasma c-peptide and (E) body weight during hyperglycemic clamp in mice exposed to either V (n=6) or 0.5mM CdCl2 (n=7) for 17 weeks followed by 12 weeks of washout with HFD on V water (Table 1, Cohort #6). (F) Islet insulin secretion in response to high glucose and several insulin secretagogues from V and Cd-exposed mice following 12 weeks of washout with HFD (n=5/group). (G) Total islet insulin content following islet perifusion in V and Cd-exposed mice islets following 12 weeks of washout with HFD (n=5/group). V-HFD, Vehicle-exposed followed by washout and HFD; Cd-HFD, Cd-exposed followed by washout and HFD. Data are expressed as mean ± SEM. *p<0.05.
Fig. 4:
Fig. 4:
(A) Blood glucose, (B) plasma insulin and (C) fasting body weight during in vivo GSIS in age-matched male and female mice exposed to either V (n=10 (males), n=11 (females)) or 1mM CdCl2 (n=10/gender) for 17.8 ± 0.1 weeks (Table 1, Cohort #7a-b). (D) Glucose curve and corresponding (E) area under the curve, (F) plasma insulin and (G) fasting body weight during GSIS in age-matched V-HFD and Cd-HFD male (n=9–10/group) and female (n=9–10/group) mice 19.1 ± 0.1 weeks into the washout phase with HFD. (H) Islet Cd content (normalized for total islet protein) at sacrifice in V-HFD (n=9) and Cd-HFD (n=8) female mice. V-F, Vehicle females; Cd-F, Cd-exposed females; V-M, Vehicle males; Cd-M, Cd-exposed males; V-HFD, Vehicle-exposed followed by washout and HFD; Cd-HFD, Cd-exposed followed by washout and HFD. Data are expressed as mean ± SEM. *p<0.05, **p<0.01.
Fig. 5:
Fig. 5:
(A) Islet Cd and (B) islet Zn (normalized to total islet protein) in murine (n=6/group) and human islets (n=3/group) exposed to either V or 0.1μM CdCl2 for 48 hours. Data are expressed as mean ± SEM. Adjusted p-values from one way ANOVA with post hoc Tukey’s test for multiple comparison. * p<0.05, **p<0.01, ****p<0.0001, ns: not significant.

References

    1. Afridi HI, Kazi TG, Kazi N, Jamali MK, Arain MB, Jalbani N, Baig JA and Sarfraz RA (2008). “Evaluation of status of toxic metals in biological samples of diabetes mellitus patients.” Diabetes Res Clin Pract 80(2): 280–288. - PubMed
    1. Antala S and Dempski RE (2012). “The human ZIP4 transporter has two distinct binding affinities and mediates transport of multiple transition metals.” Biochemistry 51(5): 963–973. - PubMed
    1. Arredondo M, Munoz P, Mura CV and Nunez MT (2003). “DMT1, a physiologically relevant apical Cu1+ transporter of intestinal cells.” Am J Physiol Cell Physiol 284(6): C1525–1530. - PubMed
    1. Ayala JE, Samuel VT, Morton GJ, Obici S, Croniger CM, Shulman GI, Wasserman DH, McGuinness OP and N. I. H. M. M. P. C. Consortium (2010). “Standard operating procedures for describing and performing metabolic tests of glucose homeostasis in mice.” Dis Model Mech 3(9–10): 525–534. - PMC - PubMed
    1. Banerjee M, Vats P, Kushwah AS and Srivastava N (2019). “Interaction of antioxidant gene variants and susceptibility to type 2 diabetes mellitus.” Br J Biomed Sci 76(4): 166–171. - PubMed

Publication types