doi: 10.5045/br.2022.2022052.
Epub 2022 May 13.
Enrichment of TP53 alterations within GCB-like DNA subclassifications of diffuse large B-cell lymphoma after transition from de-novo to relapsed or refractory disease
Affiliations
- PMID: 35551110
- PMCID: PMC9242832
- DOI: 10.5045/br.2022.2022052
Item in Clipboard
Enrichment of TP53 alterations within GCB-like DNA subclassifications of diffuse large B-cell lymphoma after transition from de-novo to relapsed or refractory disease
Blood Res.
.
No abstract available
Conflict of interest statement
No potential conflicts of interest relevant to this article were reported.
Figures
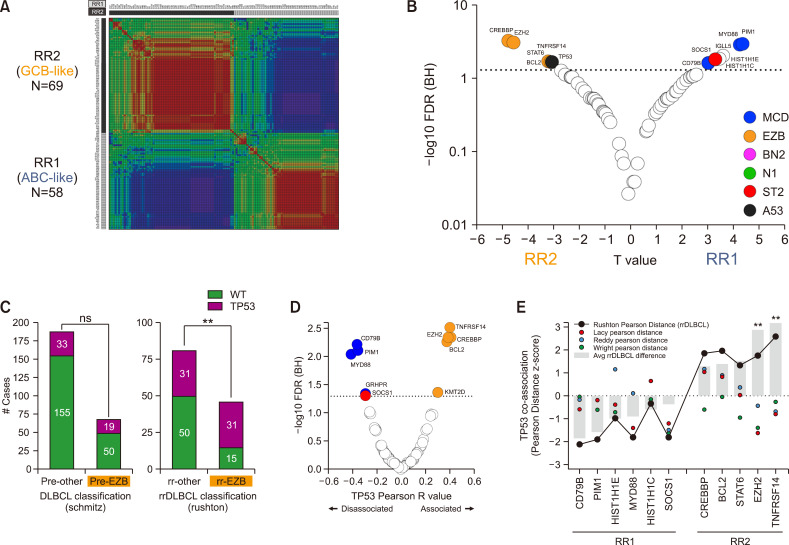
TP53 alterations enrich within GCB-like DNA subclassification alterations and rrDLBCL patients compared to de-novo cohorts. (A) K2 (2-cluster) NMF clustering. rrDLBCL patients (N=127) were analyzed for the best fit when measuring the association patterns of DNA alterations (N=91). Patient similarity is designated by color, with red representing the most co-association and blue the least. The RR1 and RR2 subsets that emerged from clustering are designated by light grey and dark grey coloring, respectively. (B) A volcano plot displays differentially enriched DNA alterations between RR1 and RR2. Comparative marker selection between the groups resulted in 2-sided T and FDR values. Greater T values were associated with RR1 and lesser values with RR2. The dotted line represents the 0.05 FDR threshold to be met for significant association with one family over the other. Significant alterations are color coded for their corresponding LymphGen cluster, if designated. (C) TP53 alterations are significantly enriched towards EZB tumors in rrDLBCL but not in de-novo DLBCL. Stacked bar graphs denote the presence of TP53 alterations within EZB and non-EZB tumors. The pre-treatment Schmitz et al. 2018 [3] cohort is compared to the Rushton et al. [9] rrDLBCL cohort. Significance was determined with a Fisher’s Exact test within both groups. (D) TP53 Alterations significantly co-occur with EZB alterations and significantly occlude MCD alterations. A volcano plot displays TP53 Pearson distance for measured rrDLBCL genes. FDR-corrected correlation similarity values are plotted on the Y-axis, with FDR <0.05 noted with a dotted line. Genes are labelled and noted for LymphGen subclassification. (E) RR2 driver genes increased association with TP53 alterations in comparison to pre-treatment association measurements. Z-score normalized Pearson Distance values are plotted on the Y-axis against RR1 and RR2 genes on the X-axis. rrDLBCL associations (Rushton) are compared to 3 separate de-novo cohort values (Lacy, Reddy, and Wright) based on TP53 co-association. Two-way ANOVA analysis was used to measure significance between pre-treatment and rrDLBCL values after Bonferroni multiple comparison correction.
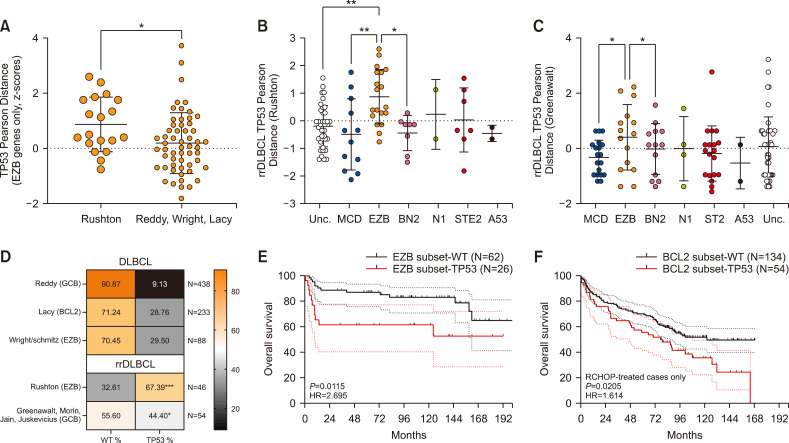
TP53 rrDLBCL enriches towards GCB-like subclassification alterations and cases in multiple rrDLBCL cohorts and is associated with inferior RCHOP response within de-novo EZB and BCL2 Subset patients. (A) A dot plot summarizes the Z-score normalized TP53 alteration Pearson Distance values of EZB classifier genes in the rrDLBCL population vs. combined de-novo DLBCL cohort values. A Welch’s t-test was used to measure significance. Mean±SD is designated by error bars. (B) TP53 alterations are significantly associated with EZB alterations in rrDLBCL. TP53 Pearson distance values are displayed for 90 rrDLBCL cohort genes (Z-score normalized). One-way ANOVA analysis was used to measure significance and was corrected by a Holm-Šídák's multiple comparisons test. Gene color is matched to LymphGen subclassification. Mean±SD is designated by error bars. (C) Gene Pearson Distance from TP53 Alterations within the Greenawalt rrDLBCL cohort (N=44). A dot plot summarizes the Z-score normalized TP53 alteration Pearson Distance values of LymphGen classifier genes of each subset. One-way ANOVA analysis was used to measure significance and was corrected by a Holm-Šídák's multiple comparisons test. Gene color is matched to LymphGen subclassification. Mean±SD is designated by error bars. Alterations present in the cohort but not included in LymphGen classification are displayed in white. (D) Percentage of EZB (or corresponding) cases with non-altered (WT) vs. altered TP53 in DLBCL vs. rrDLBCL populations. A gradient denotes percent composition of each population. Significance was determined through a Fisher’s Exact test between TP53 alteration enrichment within EZB or GCB cases vs. Non-GCB cases. The number of GCB/corresponding cases examined is listed on the right. (E) The presence of TP53 alterations at diagnosis in the GCB-like subset EZB (Wright et al. [5]) and BCL2 (Lacy et al. [7]) patients is associated with inferior overall survival. Kaplan-Meier survival curves assess the overall survival impact of TP53 alteration within EZB or BCL2 populations when treated with RCHOP. Significance was measured with Logrank analysis. The 95% confidence interval for each alteration is designated by dotted lines.
Similar articles
-
Immunohistochemical classification of de novo, transformed, and relapsed diffuse large B-cell lymphoma into germinal center B-cell and nongerminal center B-cell subtypes correlates with gene expression profile and patient survival.Arch Pathol Lab Med. 2006 Dec;130(12):1819-24. doi: 10.5858/2006-130-1819-ICODNT. Arch Pathol Lab Med. 2006. PMID: 17149956
-
Lenalidomide in Relapsed or Refractory Diffuse Large B-Cell Lymphoma: Is It a Valid Treatment Option?Oncologist. 2016 Sep;21(9):1107-12. doi: 10.1634/theoncologist.2016-0103. Epub 2016 Jul 5. Oncologist. 2016. PMID: 27382029 Free PMC article.
-
[Advances in the Molecular Diagnosis and Therapy of Relapsed/Refractory Diffuse Large B-cell Lymphoma -Review].Zhongguo Shi Yan Xue Ye Xue Za Zhi. 2018 Apr;26(2):603-608. doi: 10.7534/j.issn.1009-2137.2018.02.050. Zhongguo Shi Yan Xue Ye Xue Za Zhi. 2018. PMID: 29665940 Review. Chinese.
-
Impact of Cell of Origin on Outcomes After Autologous Hematopoietic Cell Transplant in Diffuse Large B-Cell Lymphoma.Clin Lymphoma Myeloma Leuk. 2022 Feb;22(2):e89-e95. doi: 10.1016/j.clml.2021.08.011. Epub 2021 Aug 31. Clin Lymphoma Myeloma Leuk. 2022. PMID: 34593359
-
Rituximab: a review of its use in non-Hodgkin's lymphoma and chronic lymphocytic leukaemia.Drugs. 2003;63(8):803-43. doi: 10.2165/00003495-200363080-00005. Drugs. 2003. PMID: 12662126 Review.
Cited by
-
Integrated genomics with refined cell-of-origin subtyping distinguishes subtype-specific mechanisms of treatment resistance and relapse in diffuse large B-cell lymphoma.Blood Cancer J. 2025 Jul 12;15(1):120. doi: 10.1038/s41408-025-01326-5. Blood Cancer J. 2025. PMID: 40651974 Free PMC article.
References
-
- Xu-Monette ZY, Wu L, Visco C, et al. Mutational profile and prognostic significance of TP53 in diffuse large B-cell lymphoma patients treated with R-CHOP: report from an International DLBCL Rituximab-CHOP Consortium Program Study. Blood. 2012;120:3986–96. doi: 10.1182/blood-2012-05-433334. - DOI - PMC - PubMed
Publication types
LinkOut - more resources
Full Text Sources
Research Materials
Miscellaneous