. 2022 May 12;13(1):2647.
doi: 10.1038/s41467-022-30244-4.

Dissociable multi-scale patterns of development in personalized brain networks

Affiliations

Dissociable multi-scale patterns of development in personalized brain networks

Adam R Pines et al. Nat Commun. .

Abstract

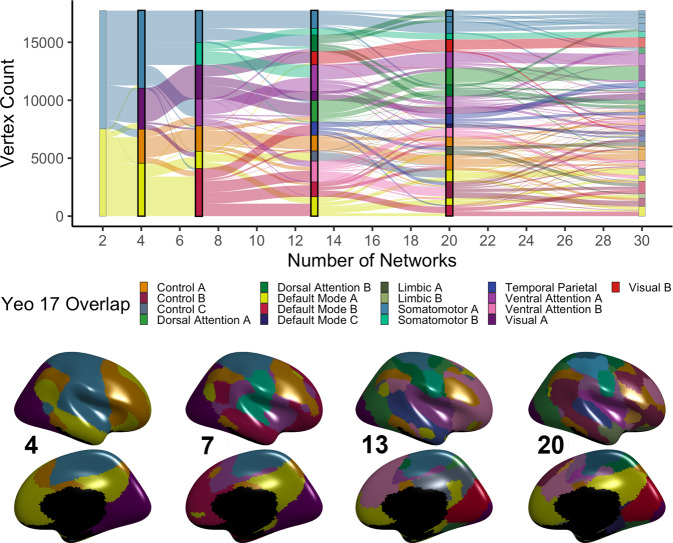
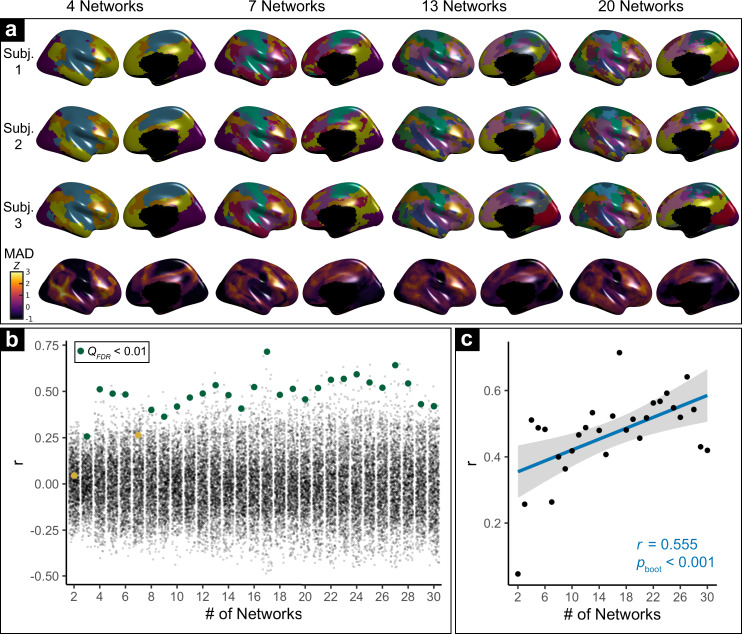
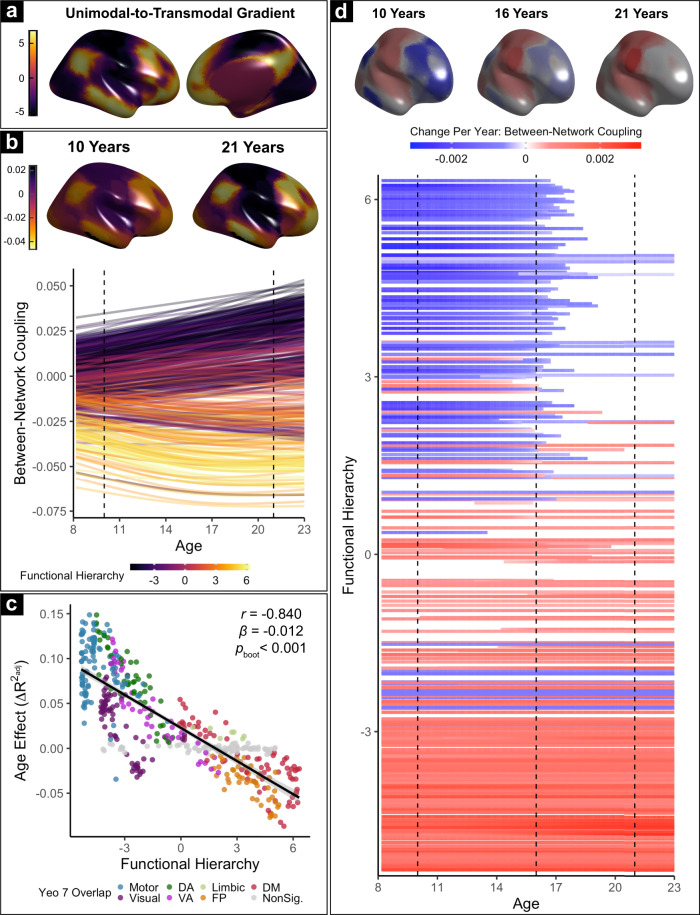
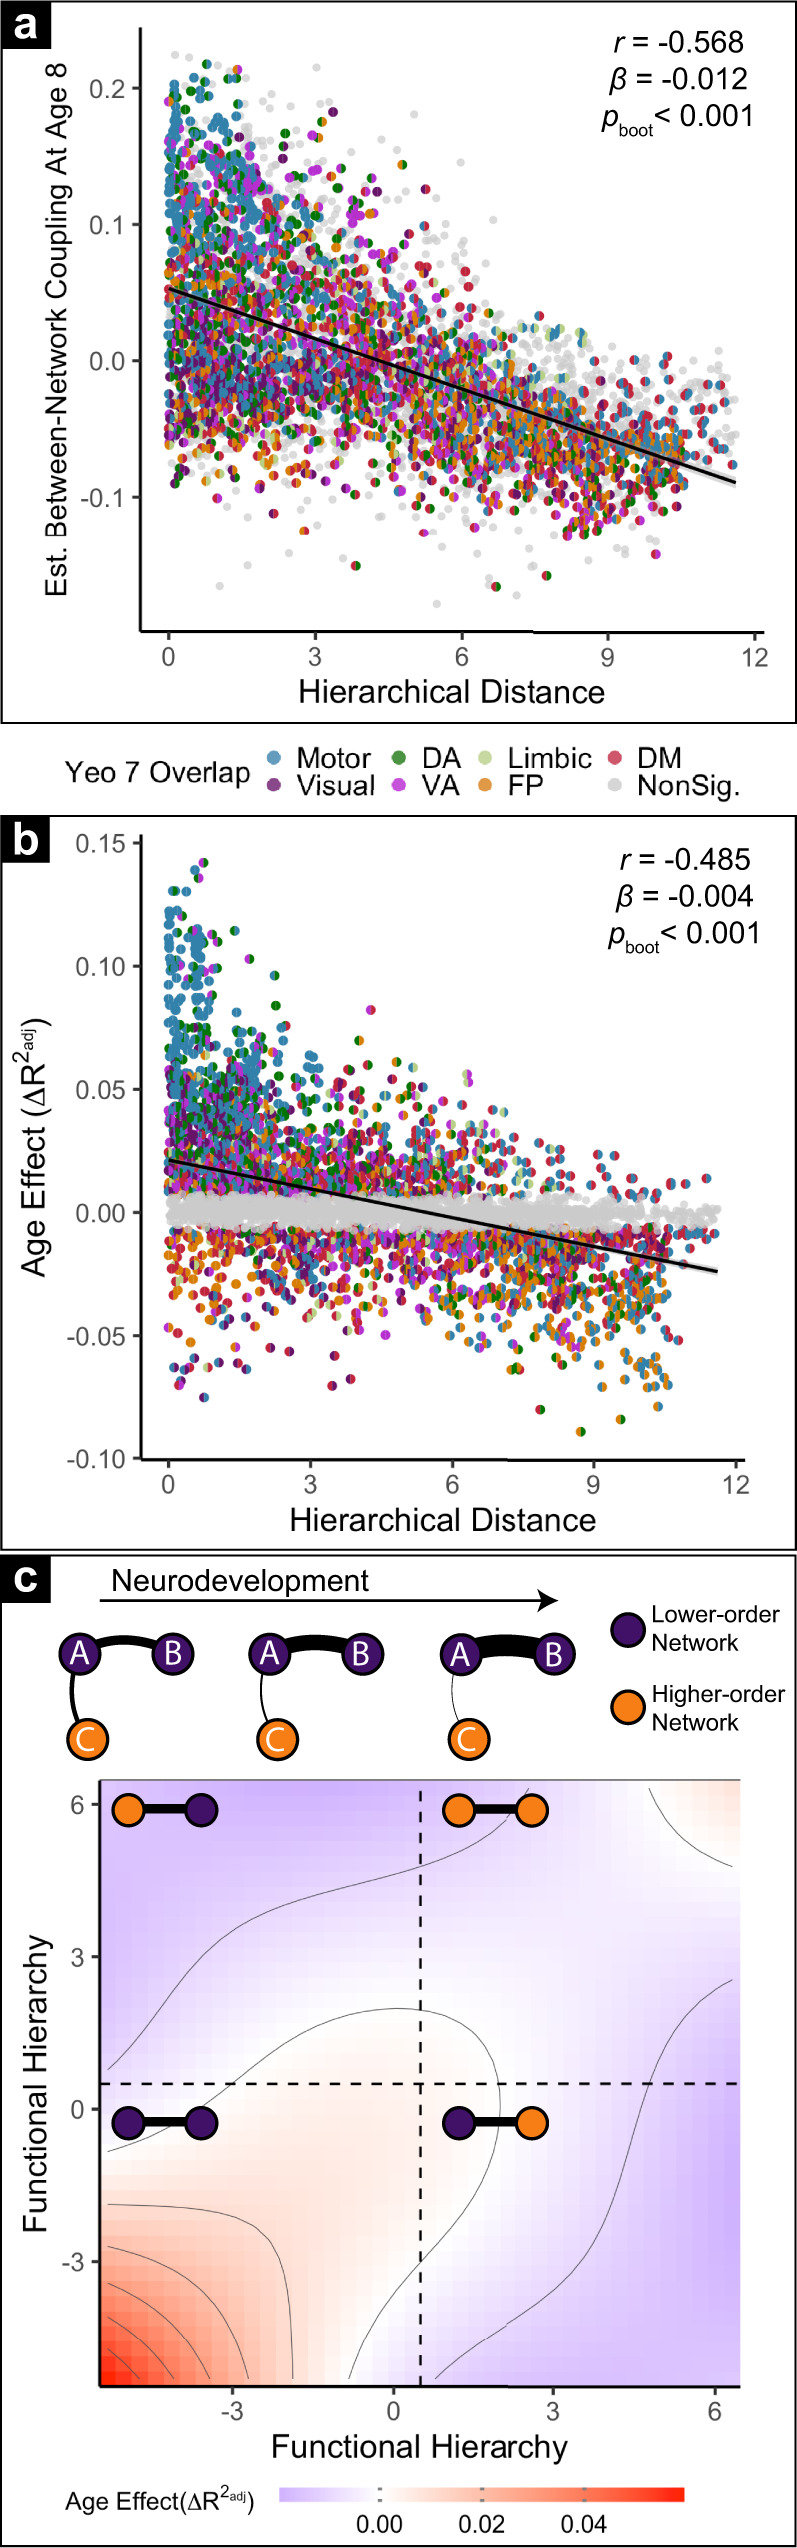
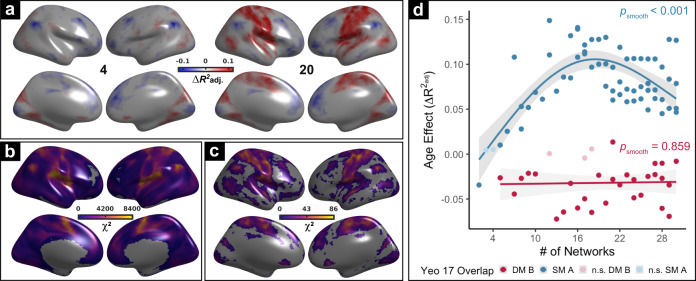
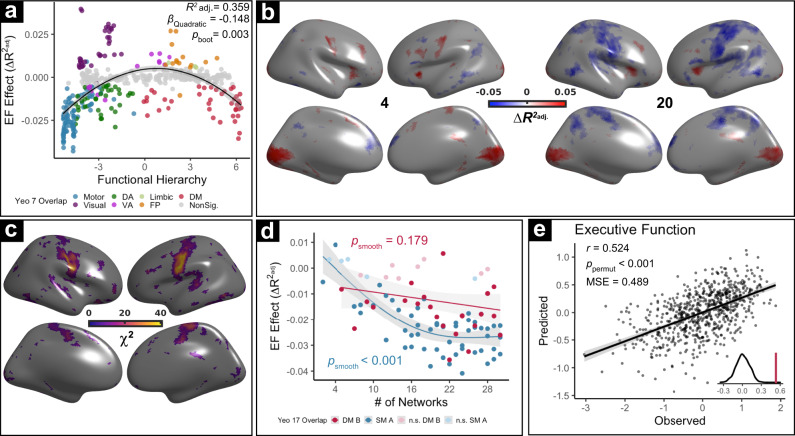
The brain is organized into networks at multiple resolutions, or scales, yet studies of functional network development typically focus on a single scale. Here, we derive personalized functional networks across 29 scales in a large sample of youths (n = 693, ages 8-23 years) to identify multi-scale patterns of network re-organization related to neurocognitive development. We found that developmental shifts in inter-network coupling reflect and strengthen a functional hierarchy of cortical organization. Furthermore, we observed that scale-dependent effects were present in lower-order, unimodal networks, but not higher-order, transmodal networks. Finally, we found that network maturation had clear behavioral relevance: the development of coupling in unimodal and transmodal networks are dissociably related to the emergence of executive function. These results suggest that the development of functional brain networks align with and refine a hierarchy linked to cognition.


Conflict of interest statement

R.T.S. has consulting income from Genentech/Roche and Octave Bioscience. The remaining authors declare no competing interests.

Figures

Fig. 1
Fig. 1. Group-consensus functional networks at multiple scales.
We used regularized non-negative matrix factorization (see Supplementary Fig. 1) to derive personalized functional networks at 29 scales (2–30 networks). Tracking network membership of each vertex across scales reveals a nested structure where finer-grained networks gradually emerge from coarse networks (top). Scales 4, 7, 13, and 20 are chosen for visualization; see bottom panel for cortical projections. Colors reflect each network’s predominant overlap with a canonical atlas of 17 functional networks.
Fig. 2
Fig. 2. Variability in personalized networks across scales.
a Variability in personalized networks is greatest in association cortex across scales. Exemplar personalized networks at scales 4, 7, 13, and 20 are shown for three participants. Prominent individual differences in functional topography are present at all scales, as quantified by median absolute deviation (MAD) of functional network loadings across participants (bottom row, z-scored within each scale). b Variability of functional topography aligns with functional hierarchy. Spin-tests of the correlation between topographic variability and the principal functional connectivity gradient at each scale reveal that variability is significantly correlated with a sensorimotor-to-association hierarchy at most scales (green dots = significant correlations; yellow dots = non-significant correlations; black dots = spin-test null correlations, FDR false discovery rate). c Greater alignment between a sensorimotor-to-association hierarchy and topographic variability is present at finer scales. Scatterplot depicts second-order correlation of variability (MAD) and the principal gradient (from b) across scales. The statistical test is two-sided. Error bands depict the 95% confidence interval.
Fig. 3
Fig. 3. Network development in youth unfolds along a functional hierarchy.
a We define functional hierarchy according to the widely used principal gradient of functional connectivity from Margulies et al. (2016), which describes each location on the cortex on a unimodal-to-transmodal continuum. b Between-network coupling is modeled for every network at each scale using Generalized Additive Models (GAMs) with penalized splines to account for linear and nonlinear effects of age. Each solid line represents the developmental pattern of one network at one scale; colors indicate the position of that network on the functional hierarchy. Dashed lines and corresponding brain maps represent estimated between-network coupling at each age, averaged across scales. Between-network coupling of sensorimotor networks (purple lines) increases with age, indicating increased integration. In contrast, the coupling of association networks (yellow lines) declines with age, reflecting increased segregation. c Age effects of each network (from b) are plotted versus their position on the functional hierarchy (from a). Networks that do not display significant change over development are shaded in gray (QFDR > 0.05). The position of each network on the functional hierarchy explains the majority of variance in age effects (r = −0.840, β = −0.012, pboot < 0.001, two-sided). d We quantified the duration, magnitude, and direction of maturational changes in coupling for each network using the derivatives of the fitted splines (from b). Top: annualized change in between-network coupling at 10, 16, and 21 years old, averaged across scales. Bottom: change per year in average between-network coupling of each network across the age range studied; as in b, each line represents the developmental pattern of a given network at a single scale. While integration of sensorimotor networks increases over the entire age range sampled, segregation of association networks generally plateaus near the end of adolescence.
Fig. 4
Fig. 4. Maturation of between-network coupling aligns with the position of each network in the functional hierarchy.
a Mean between-network coupling is largely captured by relative position along the sensorimotor to association axis. The inter-network coupling of each pair of networks at each scale is modeled using a GAM to estimate their values at age 8. Here, those values are plotted versus the difference in the hierarchical position of the two networks being evaluated. Each data point represents the coupling of a network pair at a given scale. Each half of the circle is colored according to constituent networks’ maximum overlap with the 7-network solution defined by Yeo et al. (2011); network pairs that do not significantly change with age after FDR correction (Q < 0.05) are shaded in gray. As expected, networks at a similar position along the functional hierarchy tend to have higher coupling (r = −0.568, β = −0.012, pboot < 0.001, two-sided). b Age effects quantifying the development of between-network coupling is similarly aligned with the relative position of networks along the functional hierarchy. Age effects of every network pair at each scale are plotted versus their hierarchical distance and colored as in a. Network pairs without significant age effects are plotted in gray. Developmental effects on pairwise coupling between networks are associated with the hierarchical distance between networks (r = −0.49, pboot < 0.001, two-sided). c Top: schematic summarizing developmental effects. Development is associated with strengthening of network coupling between lower-order networks and weakening of coupling between lower and higher-order networks; thicker lines represent greater functional coupling. Bottom: topographical plot of the observed age effect as a function of absolute (rather than relative) network hierarchy values across all network pairs. Increased coupling with age between functionally similar networks is prominent for sensorimotor networks (bottom left), and less prominent for association networks (top right). Age-related decreases in coupling occur in sensorimotor-association network pairs (top left and bottom right).
Fig. 5
Fig. 5. The interactions between-network scale and developmental coupling is maximal in sensorimotor cortex.
a The effect of age on average vertex-wise between-network coupling at two scales (4 and 20). Age effects are modeled using GAMs with penalized splines; thresholded at QFDR < 0.05. Scale-dependent age effects can be observed in sensorimotor cortex: while no developmental increase in between-network coupling was seen in somatomotor cortex at scale 4, such an increase is evident at scale 20. b Across ages, between-network coupling of the sensorimotor cortex is strongly influenced by scale. Generalized estimating equations (GEEs) reveal that the effect of scale (χ2) differentially influences the strength of between-network coupling across the cortex. Locations within unimodal sensorimotor cortex exhibit the strongest scale-dependence in their mean between-network coupling (QFDR < 0.05). c Scale differentially interacts with age-dependent developmental associations with coupling across the cortex. GEEs are used to examine the degree of scale-moderated developmental effects (age-by-scale interaction; thresholded at Q < 0.05); maximal effects are present in the sensorimotor cortex. d Scale differentially interacts with age-dependent developmental effects in sensorimotor and association networks. Specifically, age effects in lower-order networks tend to be more scale-dependent than those in higher-order networks. The effect of age across scales is plotted for networks predominantly overlapping with the lowest-order (blue; Somatomotor-A) and highest-order (red; Default Mode-B) networks, as quantified from the functional hierarchy. Statistical tests are two-sided. Error bands depict the 95% confidence interval.
Fig. 6
Fig. 6. Multi-scale network coupling is associated with executive function.
a Network-level relationships between coupling and EF are quadratically related to transmodality. Specifically, segregation of both sensorimotor and default-mode networks is associated with better EF. These associations with EF are dissociable from normative developmental effects (Fig. 3c) where default-mode segregation and sensorimotor integration are observed. The statistical test was two-sided. b Analyses at scales 4 and 20 reveal differing associations with EF. While between-network coupling of visual, insular, and dorsolateral prefrontal cortical areas is consistently associated with greater EF (QFDR < 0.05), opposite associations with EF were present in motor cortex at coarse and fine scales. c Tests of age-by-scale interactions using GEEs reveal that scale effects are strongest in the sensorimotor cortex. d Scale is differentially linked to EF associations with coupling in higher-order and lower-order networks. As for age, effects in somatomotor networks tend to be more scale-dependent than those in association networks. The effect of age across scales is plotted for networks predominantly overlapping with the lowest-order (blue; Somatomotor-A) and highest-order (red; Default Mode-B) of the Yeo 17 networks. e Complex patterns of multi-scale coupling between personalized networks accurately predicts EF in unseen data. Cross-validated ridge regression with nested parameter tuning was used to predict EF of unseen data using each participant’s multivariate pattern of coupling across scales. Error bands depict the 95% confidence interval, statistical tests are two-sided for d and one-sided for e. MSE = mean squared error.

References

    1. Siegle JH, et al. Survey of spiking in the mouse visual system reveals functional hierarchy. Nature. 2021;592:86–92. - PMC - PubMed
    1. Felleman DJ, Van Essen DC. Distributed hierarchical processing in the primate cerebral cortex. Cereb. Cortex. 1991;1:1–47. doi: 10.1093/cercor/1.1.1. - DOI - PubMed
    1. Harris JA, et al. Hierarchical organization of cortical and thalamic connectivity. Nature. 2019;575:195–202. doi: 10.1038/s41586-019-1716-z. - DOI - PMC - PubMed
    1. Burt, J. B. et al. Hierarchy of transcriptomic specialization across human cortex captured by structural neuroimaging topography. Nat. Neurosci. 10.1038/s41593-018-0195-0 (2018). - PMC - PubMed
    1. Buckner RL, Krienen FM. The evolution of distributed association networks in the human brain. Trends Cogn. Sci. 2013;17:648–665. doi: 10.1016/j.tics.2013.09.017. - DOI - PubMed

Publication types