. 2022 May 12;9(1):204.
doi: 10.1038/s41597-022-01311-8.

QUaternary fault strain INdicators database - QUIN 1.0 - first release from the Apennines of central Italy

Affiliations

QUaternary fault strain INdicators database - QUIN 1.0 - first release from the Apennines of central Italy

Giusy Lavecchia et al. Sci Data. .

Abstract

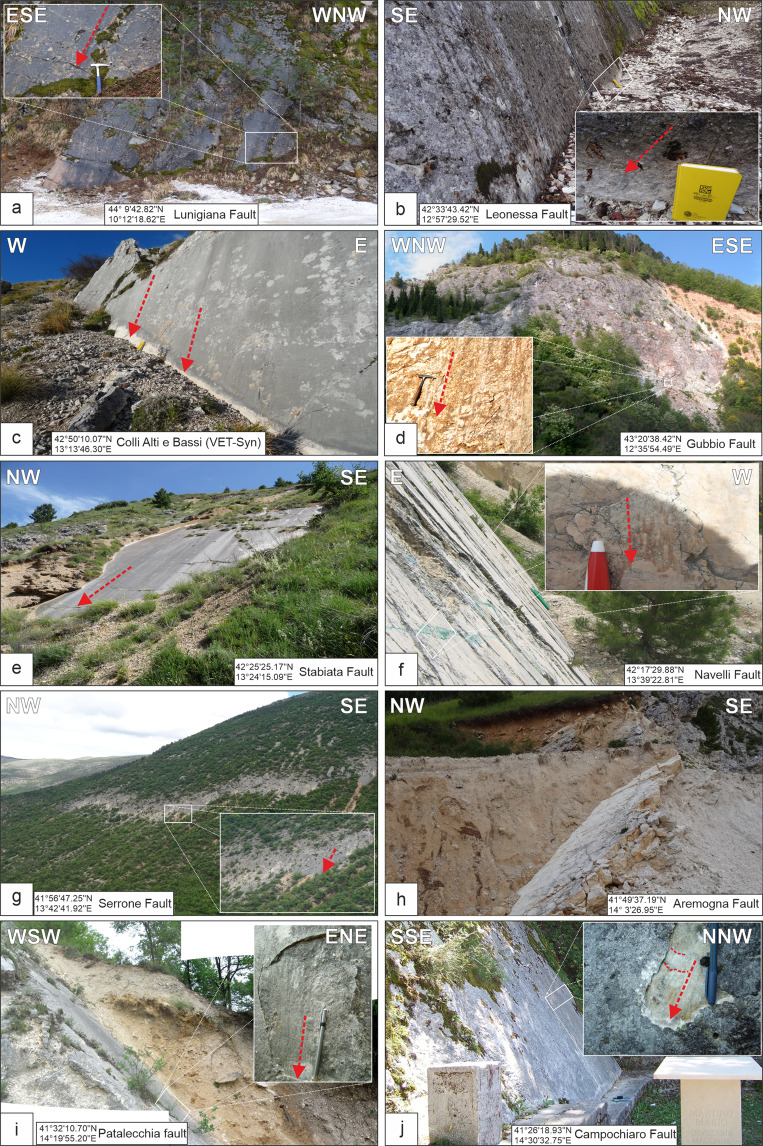
We present QUIN, a "QUaternary fault strain INdicators database", designed to integrate and unify published and unpublished local-scale geological information and derive strain parameters for structural and seismotectonic analyses. It provides data on 3339 Fault Striation Pairs (FSP; fault plane and slickenline), distributed within 455 survey sites. These are exposed along the intra-Apennine Quaternary extensional faults of Central Italy. The area covers an extent of ~550 km in a NW-SE direction. We give information on FSP location, attitude and kinematics, and deformation axes. We also provide an original shapefile of the faults hosting the FSP. A large amount of homogeneously distributed Quaternary fault/slip data help to clarify and implement the contemporary geometric and kinematic deformation pattern of Central Italy that appears scattered and incomplete whenever exclusively derived from earthquake data. The high-density of structural data can help investigate stress pattern heterogeneities at local scales, with relevance for new generations of hazard assessment evaluation and a better understanding of rupture propagation and related barriers.


Conflict of interest statement

The authors declare no competing interests.

Figures

Fig. 1
Fig. 1
Map view of the Host Faults and the QUIN database. (a) Structural Sites (SS) and slip vectors from the Fault/Striation Pairs (FSPs) data in the QUIN database; the SS are projected on a shaded relief map of northern-central Apennines of Italy along the trace of Quaternary normal faults hosting the SS; fault traces are derived from the Host Fault database (see next section). Stereoplots (Lambert equal-area, lower hemisphere projection) at the map side represent examples of FSP data for three SS chosen across the Quaternary fault belt; key: LU-E1, VET10, NMT13 = SS short names as reported in the QUIN database. (b) T30- and T45-axis computed in this database, on a shaded relief map of northern-central Apennines of Italy. Stereoplots on the right of the figure represent the same SS as in panel a (same location), with the axes of the deformation obtained with the methodology described in the main text. Key: P45 and P30 = contractional axes, B45 = neutral axes; T45 and T30 = extensional axes.
Fig. 2
Fig. 2
Examples of striated fault planes from the Apennine extensional belt showing the characteristic field aspect of the most common QUIN’s FSPs. The location of the outcrops is reported as coordinates in each panel; the fault striations are represented as red arrows.
Fig. 3
Fig. 3
FSP structural analysis performed using the combination of MATLAB scripts developed for this paper. (a) Schematic representation of the fault geometry used to calculate the P45- B45- T45 and the P30- B30- T30 deformation axes; the block diagram is modified from Célérier. Key: M, plane of movement. P45 and P30 = contractional axes, B45 and B30 = neutral axes; T45 and T30 = extensional axes. (b) Example of stereographic representation of the geometrical relationships among fault plane, slip, directions, deformation axes, angle θ computed for each FSP of this database (modified from Sippel et al.). (c) Strain ellipse configuration; for an ideal Andersonian condition, the principal strain axes (S1, S2 and S3, where S1 ≥ S2 ≥ S3) are coaxial to the principal stress axes (σ1, σ2 and σ3, where σ1 ≥  σ2 ≥  σ3). The long axis of the finite strain ellipse is the direction of maximum finite stretch (S1); the short axis is the direction of minimum finite stretch (S3); vice versa for the stress ellipsoid. (d) Examples of FSP data stereographic projection (equal-area net, lower hemisphere) using the graphical representation adapted in Andrenacci et al.; each stereoplot refers to a specific SS identified in the QUIN database; Key: LU-E1, LU-W4, SSA1, MAR3, VET10, ER-E4, VEM11, PIPA9, MOPO4, NMT13 are the SS short names as in the QUIN database. Legend as in panel b.
Fig. 4
Fig. 4
QUIN’s database statistical and quality characteristics. Key: FSP = Fault Striation Pair, T45 and T30 = extensional axes. PN = Pure Normal fault, NF = Normal Fault, NS = Normal Strike-slip fault, SN = Strike-slip Normal fault, SS = Strike-Slip fault, PSS = Pure Strike-Slip fault. (a) Cake diagram with percentage of FSP data first given in the present paper or derived from the literature (A-references containing one of the authors of this paper; B = exclusively other Authors); histograms representing quality rankings (A, B, C, where A is the best) for SS location and FSP data resolution. (b) Density contours of pole stereographic projections subdivided for Structural Sites (SS) lying on west- and east-dipping Host Faults (poles to planes). (c) Rake histogram with rake-based kinematic bins and corresponding pitches angles with relative frequency expressed in percent. (d) Trend rose diagram and plunge histogram (e) of the tensional deformation axis T45, calculated assuming the fracture angle θ = 45°. (f) Trend rose diagram and plunge histogram (g) of the tensional deformation axis T30, calculated assuming the fracture angle θ = 30°. (h) T-axis (T30 and T45) density contours from this database, compared with the (i) T-axis density contours of upper crust (depth < 15 km) focal mechanisms in the IPSI’s database within the boundaries of the QUIN study area.

References

    1. Heidbach O, et al. The World Stress Map database release 2016: Crustal stress pattern across scales. Tectonophysics. 2018;744:484–498. doi: 10.1016/j.tecto.2018.07.007. - DOI
    1. Mariucci MT, Montone P. Database of Italian present-day stress indicators, IPSI 1.4. Sci. Data. 2020;7:298. doi: 10.1038/s41597-020-00640-w. - DOI - PMC - PubMed
    1. Heidbach, O. et al. Plateboundary forces are not enough: Second- and third-order stress patterns highlighted in the World Stress Map database. Tectonics26 (2007).
    1. Barchi, M. R. The Neogene-Quaternary evolution of the Northern Apennines: crustal structure, style of deformation and seismicity. J. Virtual Explor. 36 (2010).
    1. Carminati E, Fabbi S, Santantonio M. Slab bending, syn‐subduction normal faulting, and out‐of‐sequence thrusting in the Central Apennines. Tectonics. 2014;33:530–551. doi: 10.1002/2013TC003386. - DOI