. 2022 Jun;18(6):634-642.
doi: 10.1038/s41589-022-01023-5. Epub 2022 May 12.

Chemical editing of proteoglycan architecture

Affiliations

Chemical editing of proteoglycan architecture

Timothy R O'Leary et al. Nat Chem Biol. 2022 Jun.

Abstract

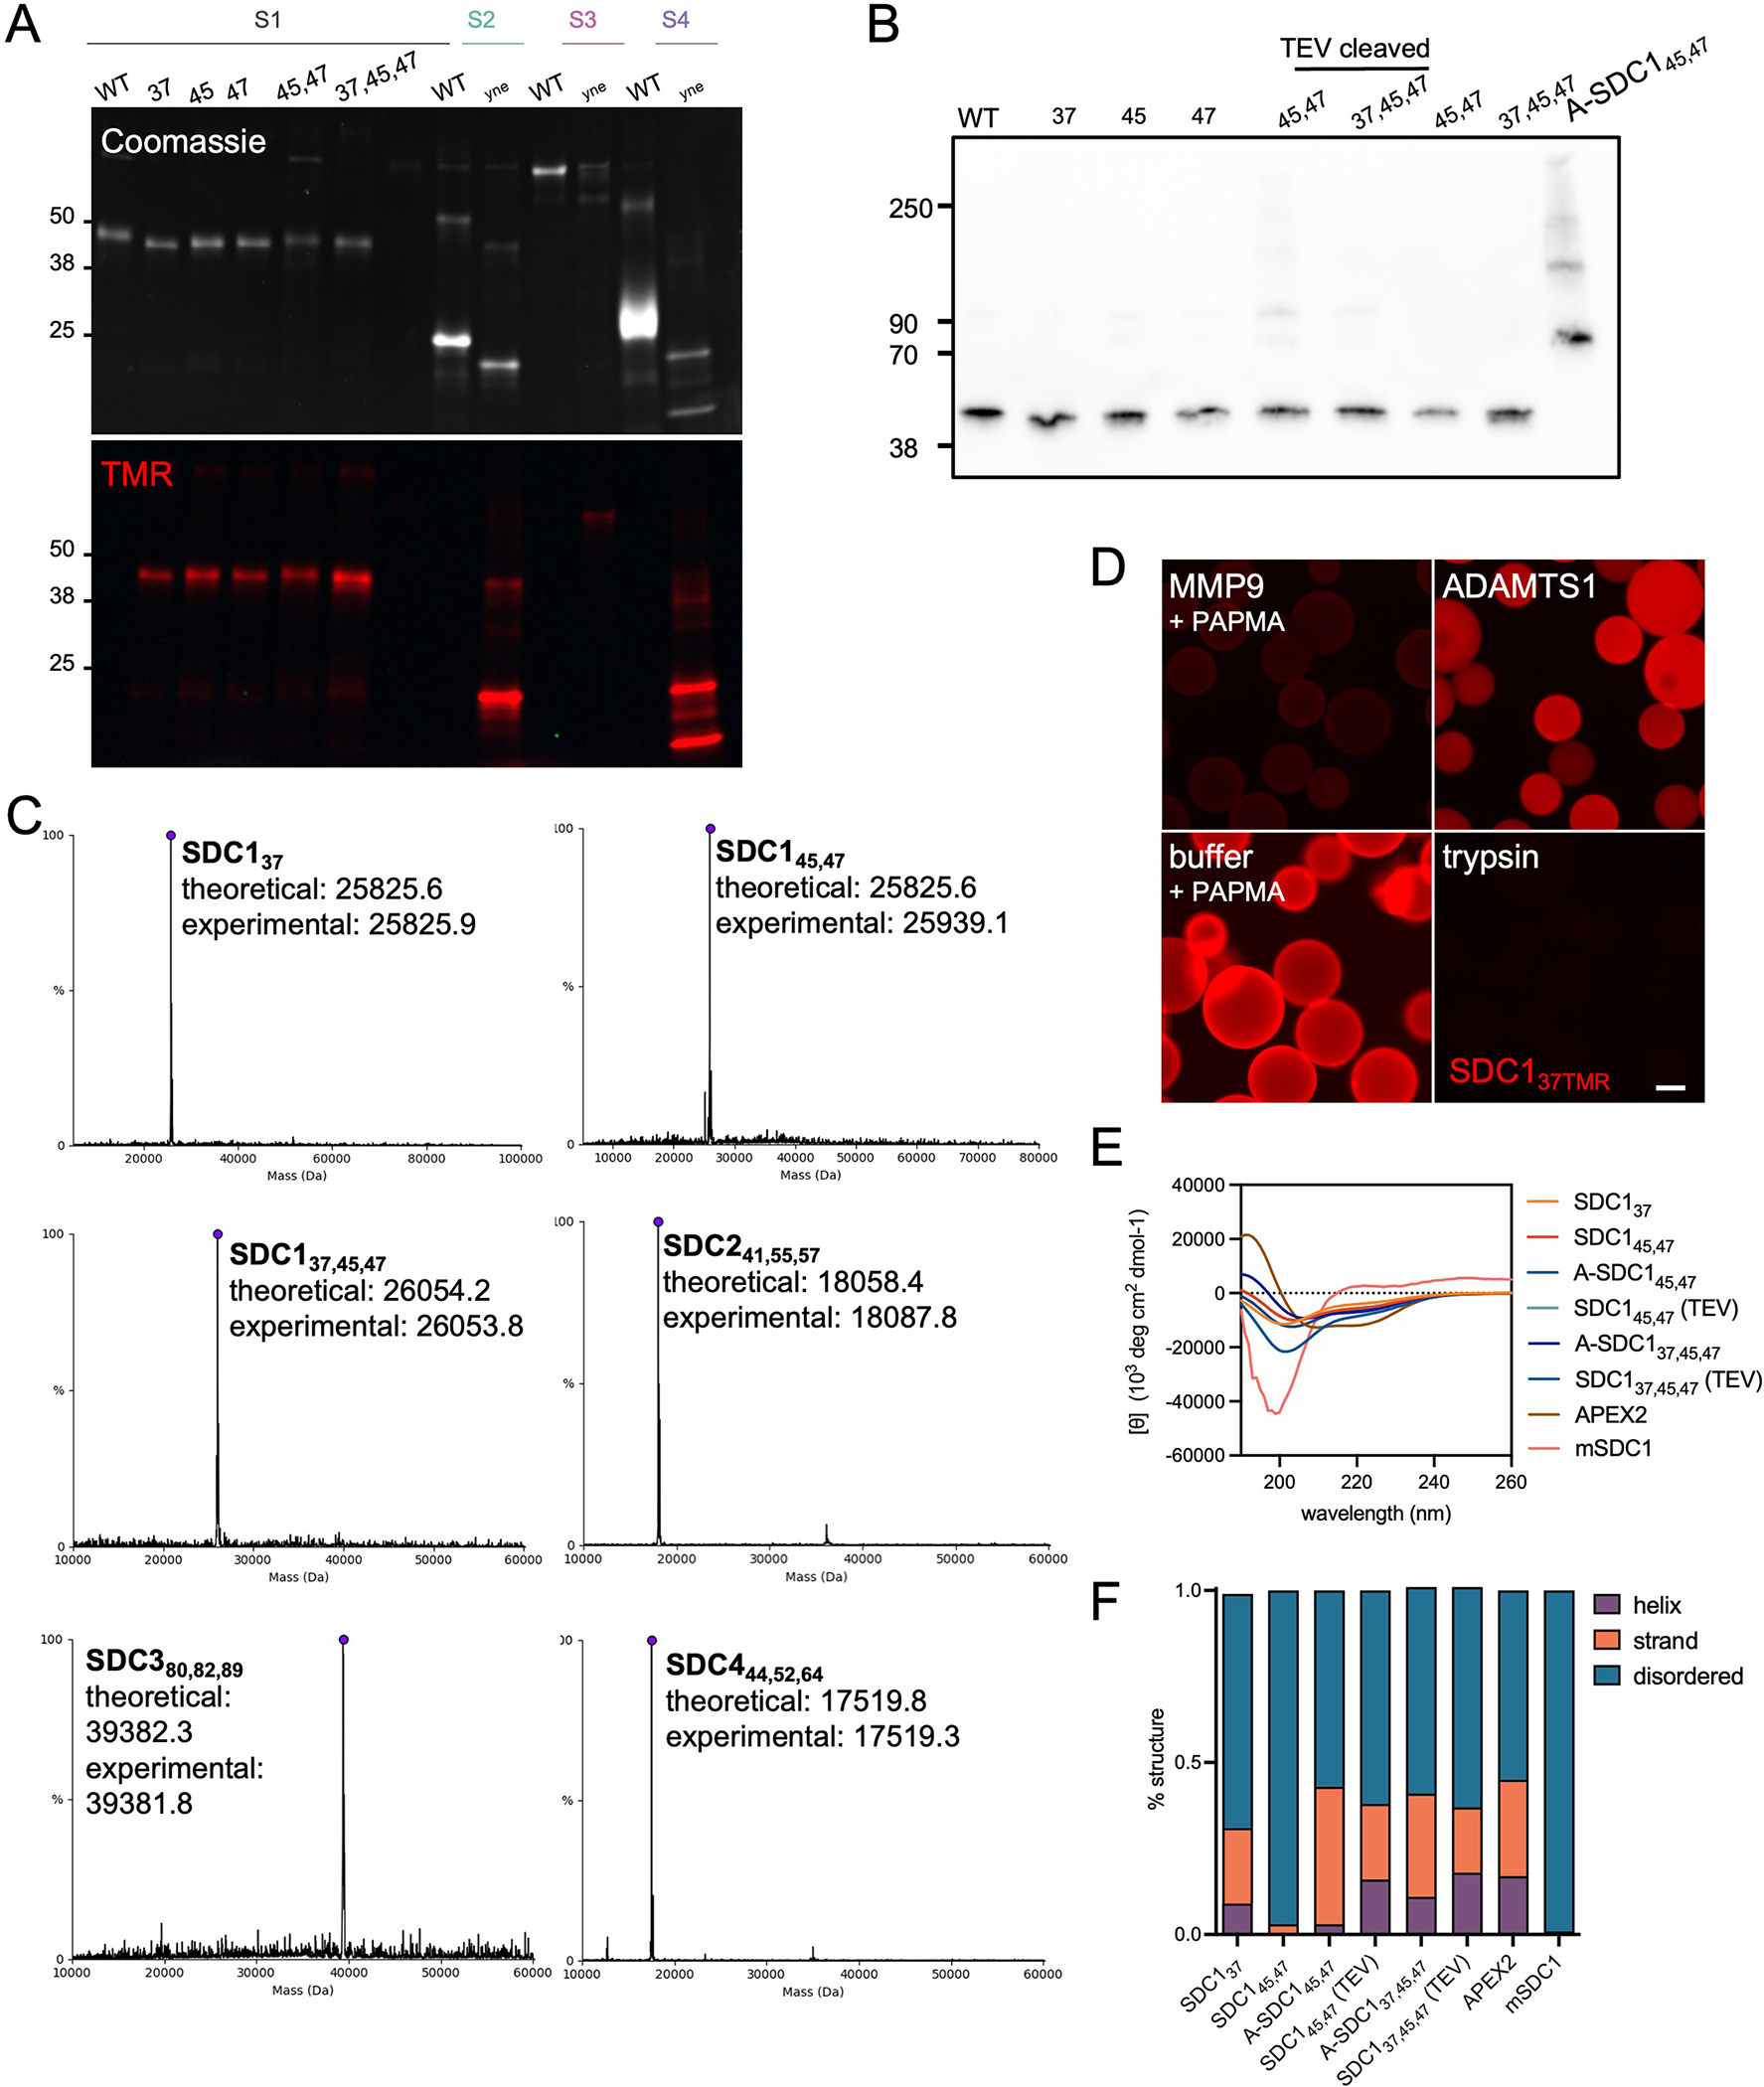
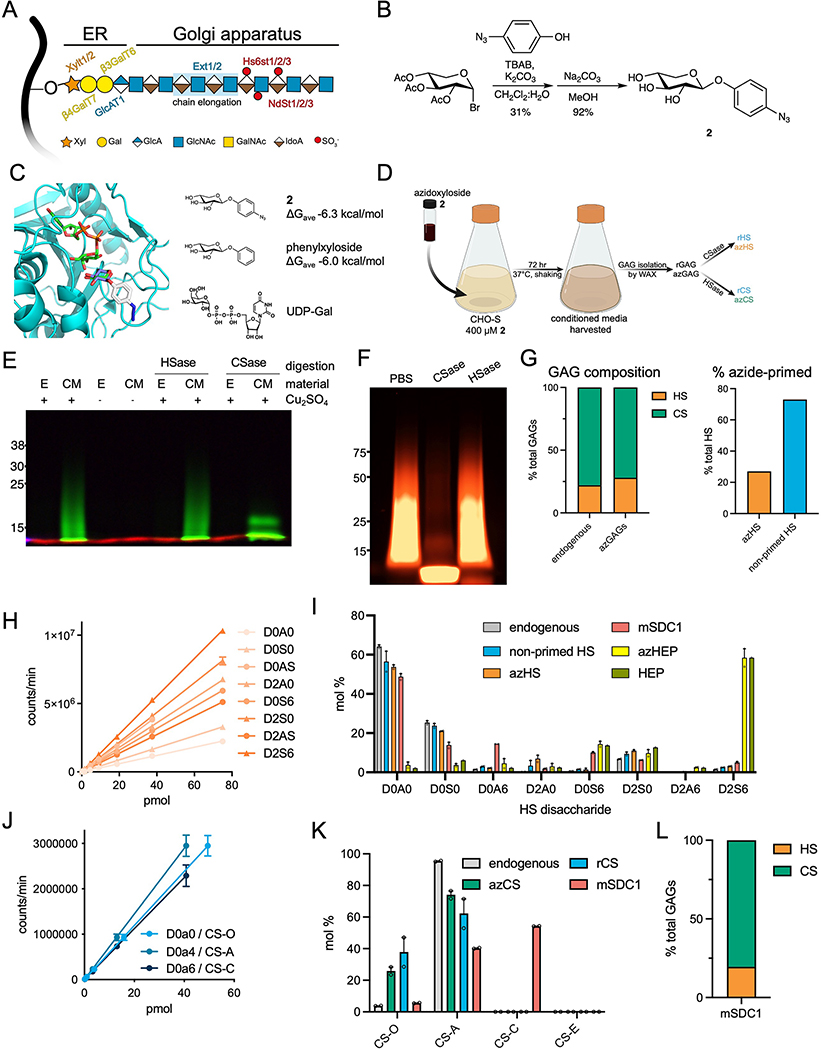
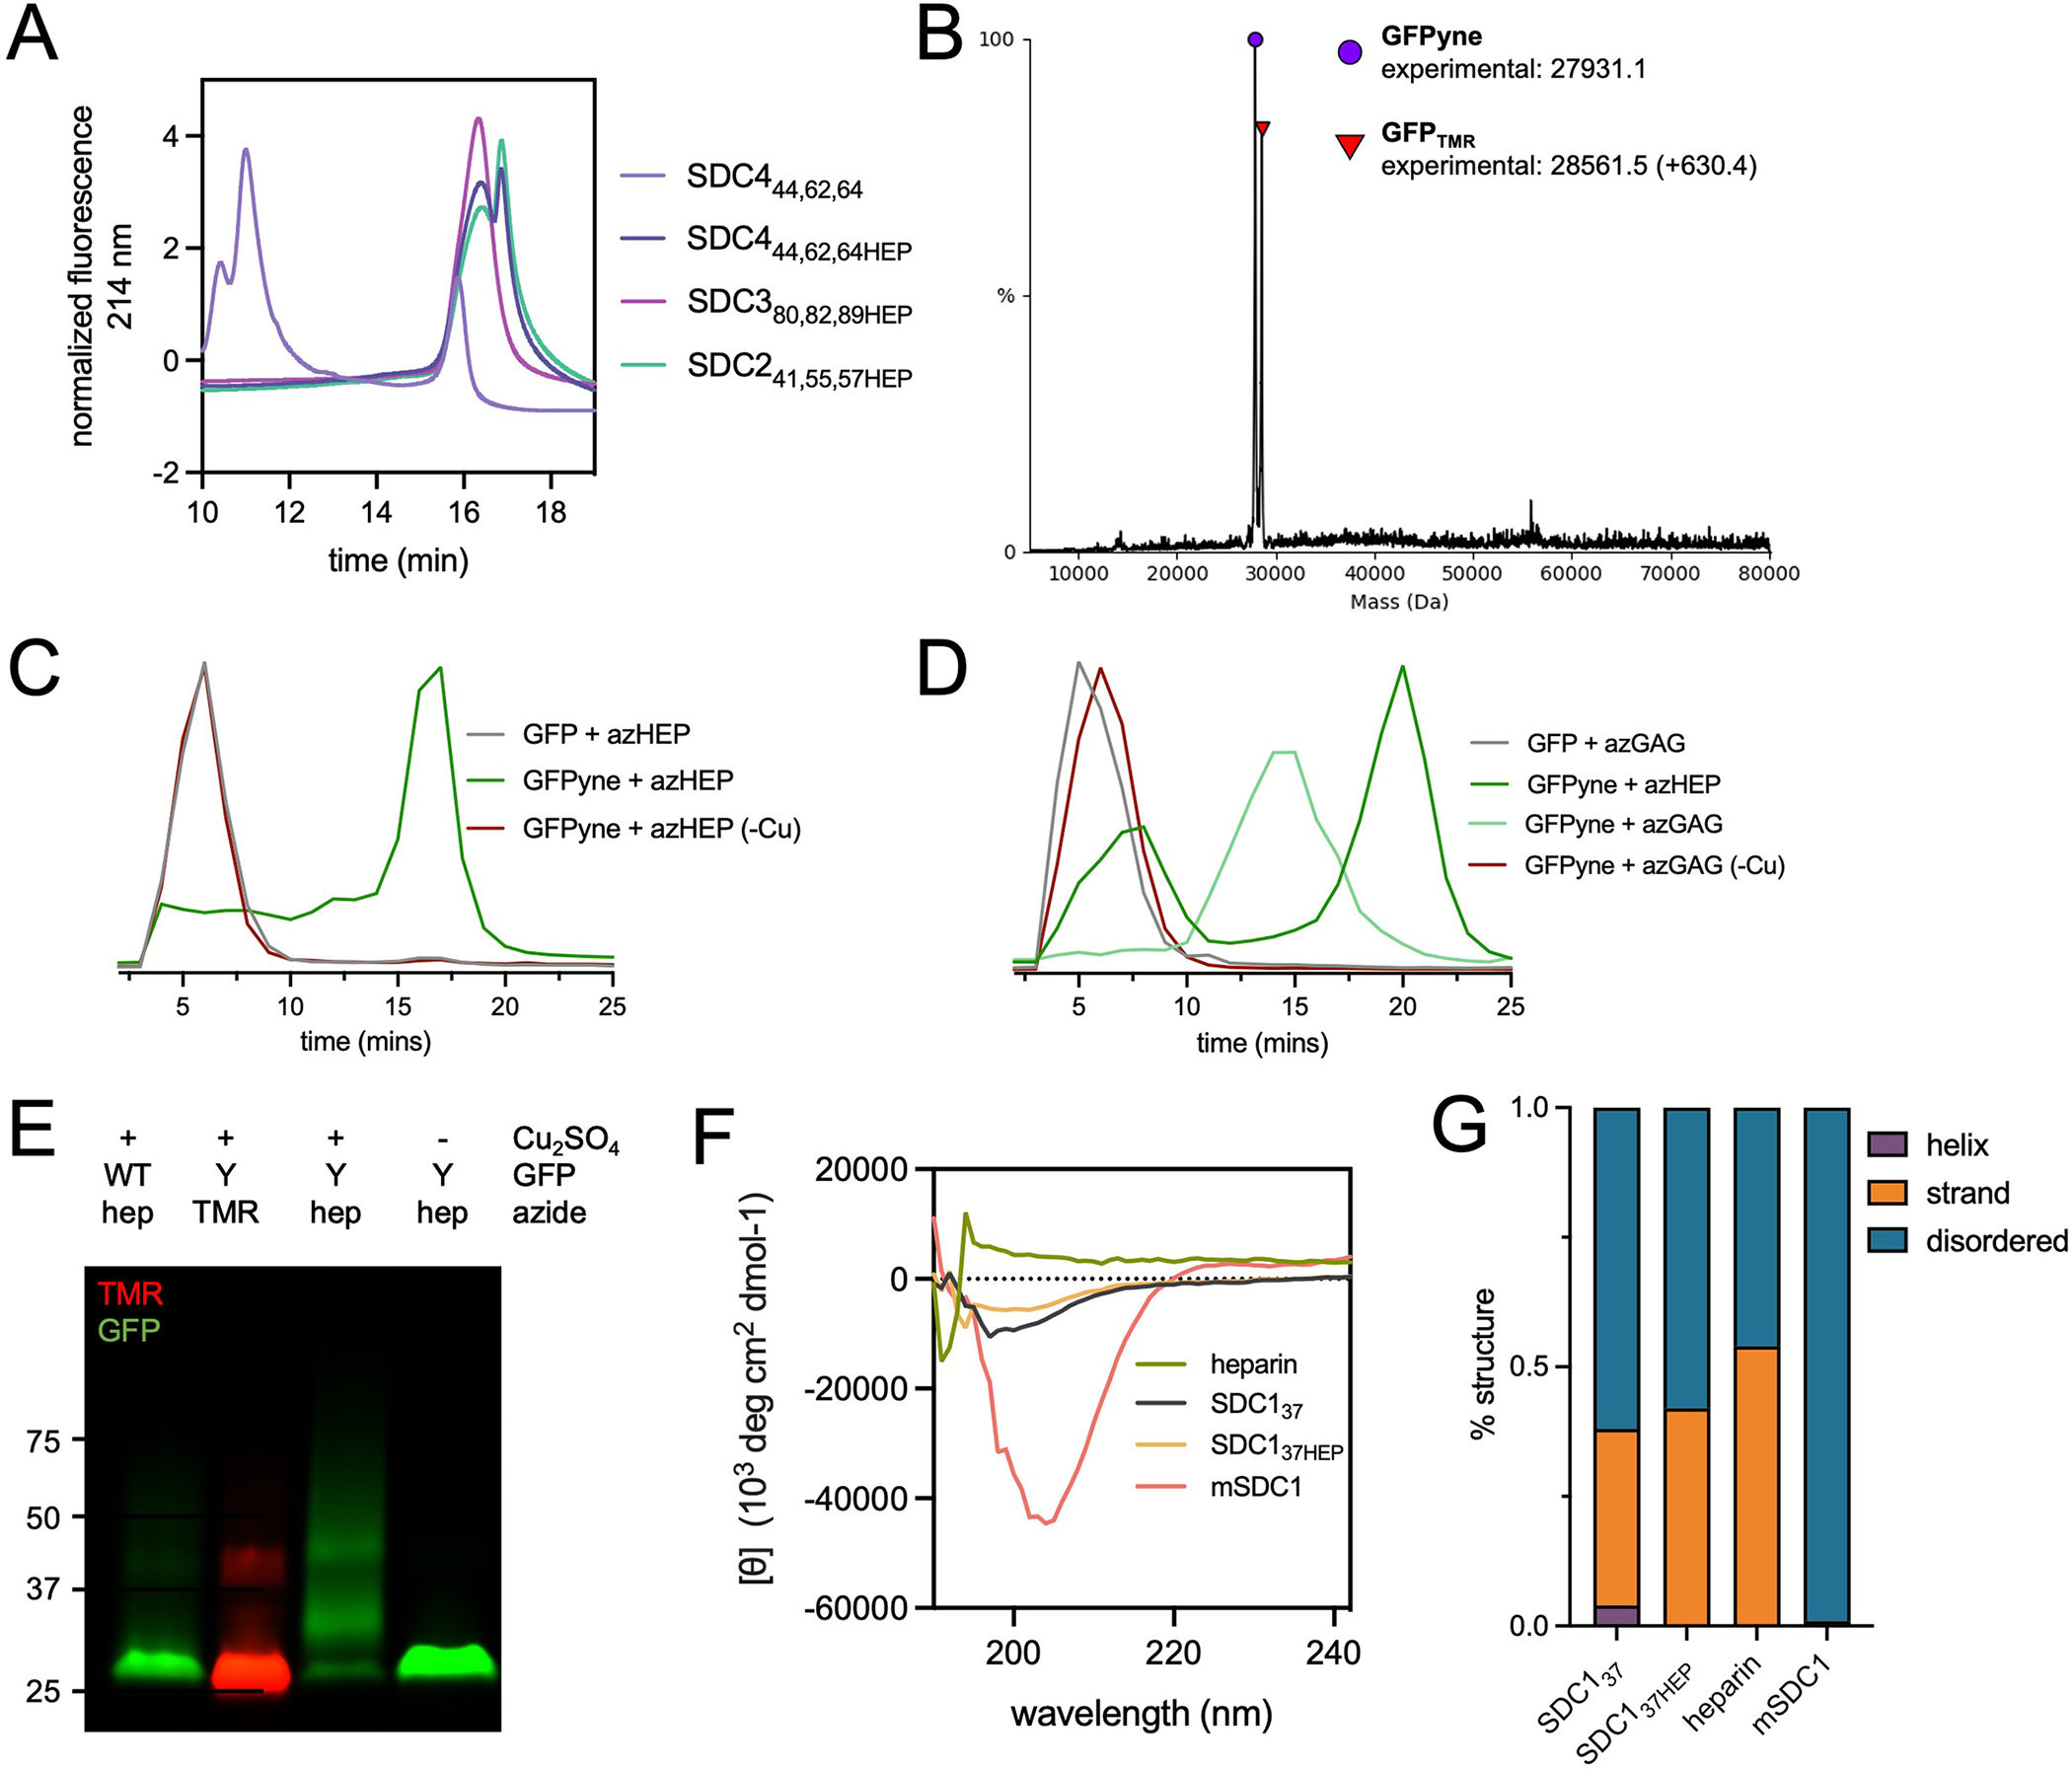
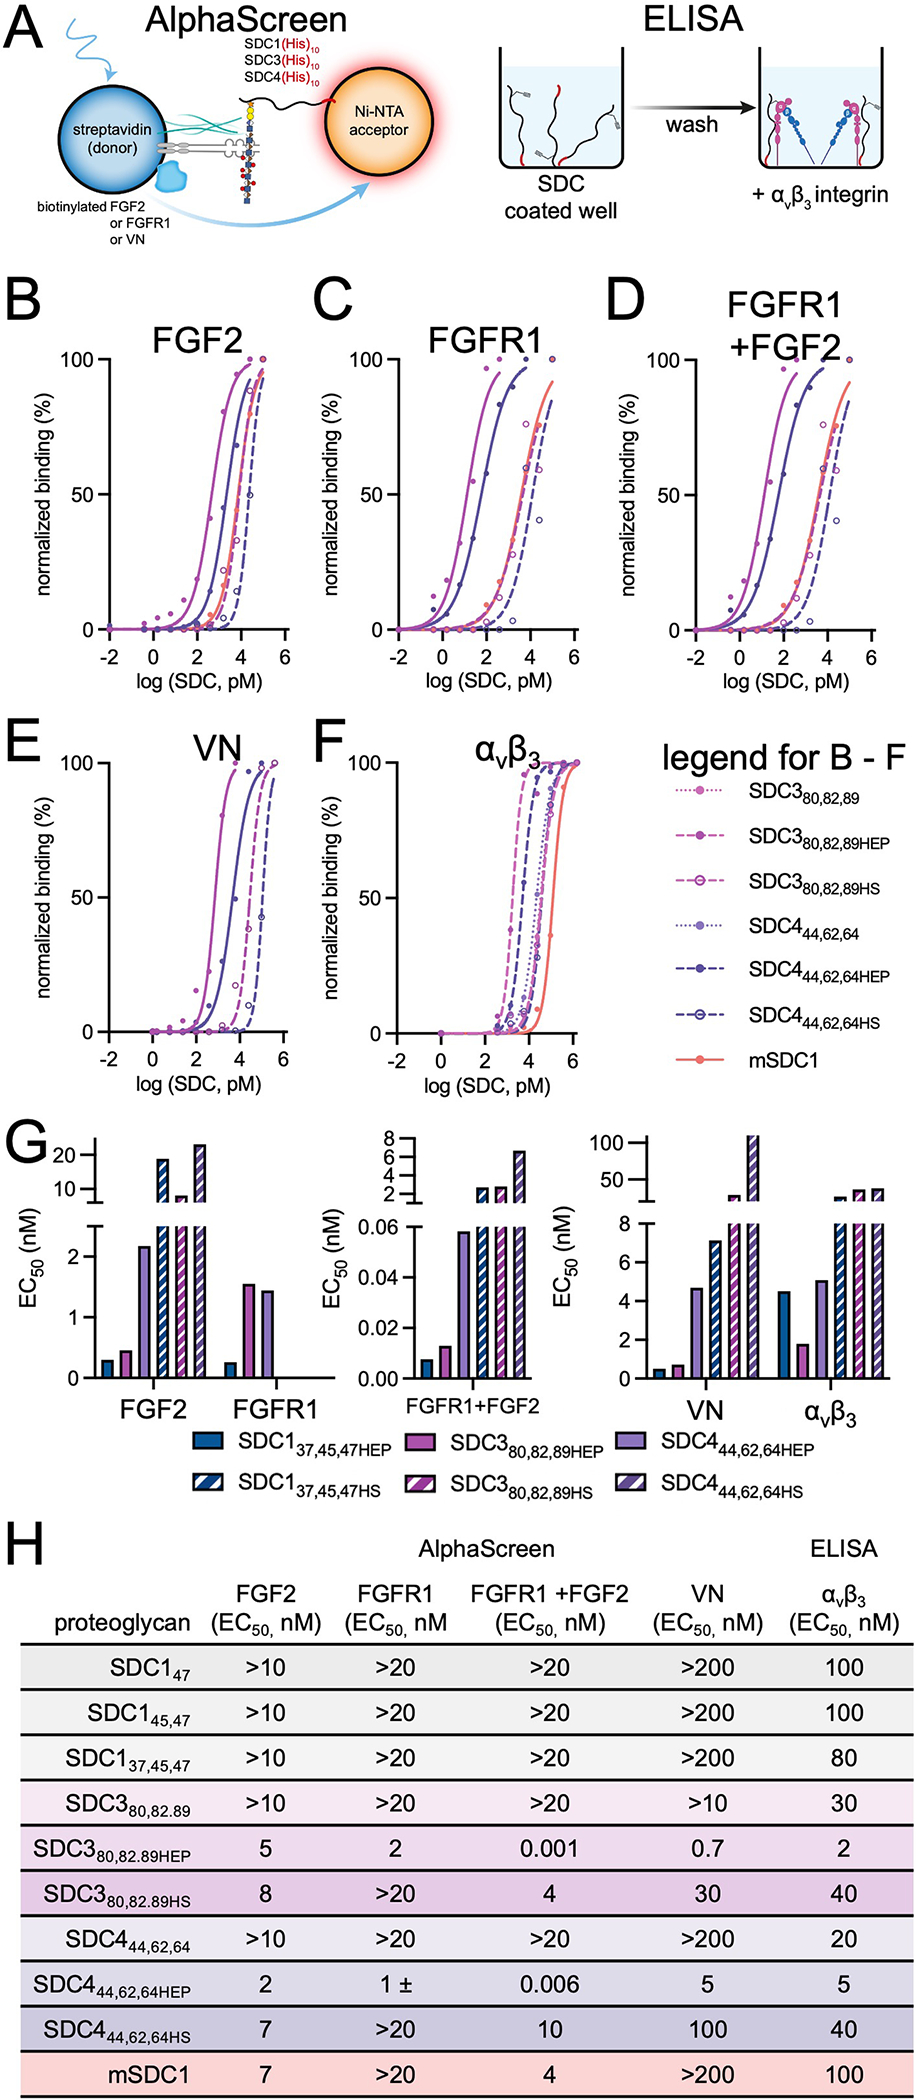
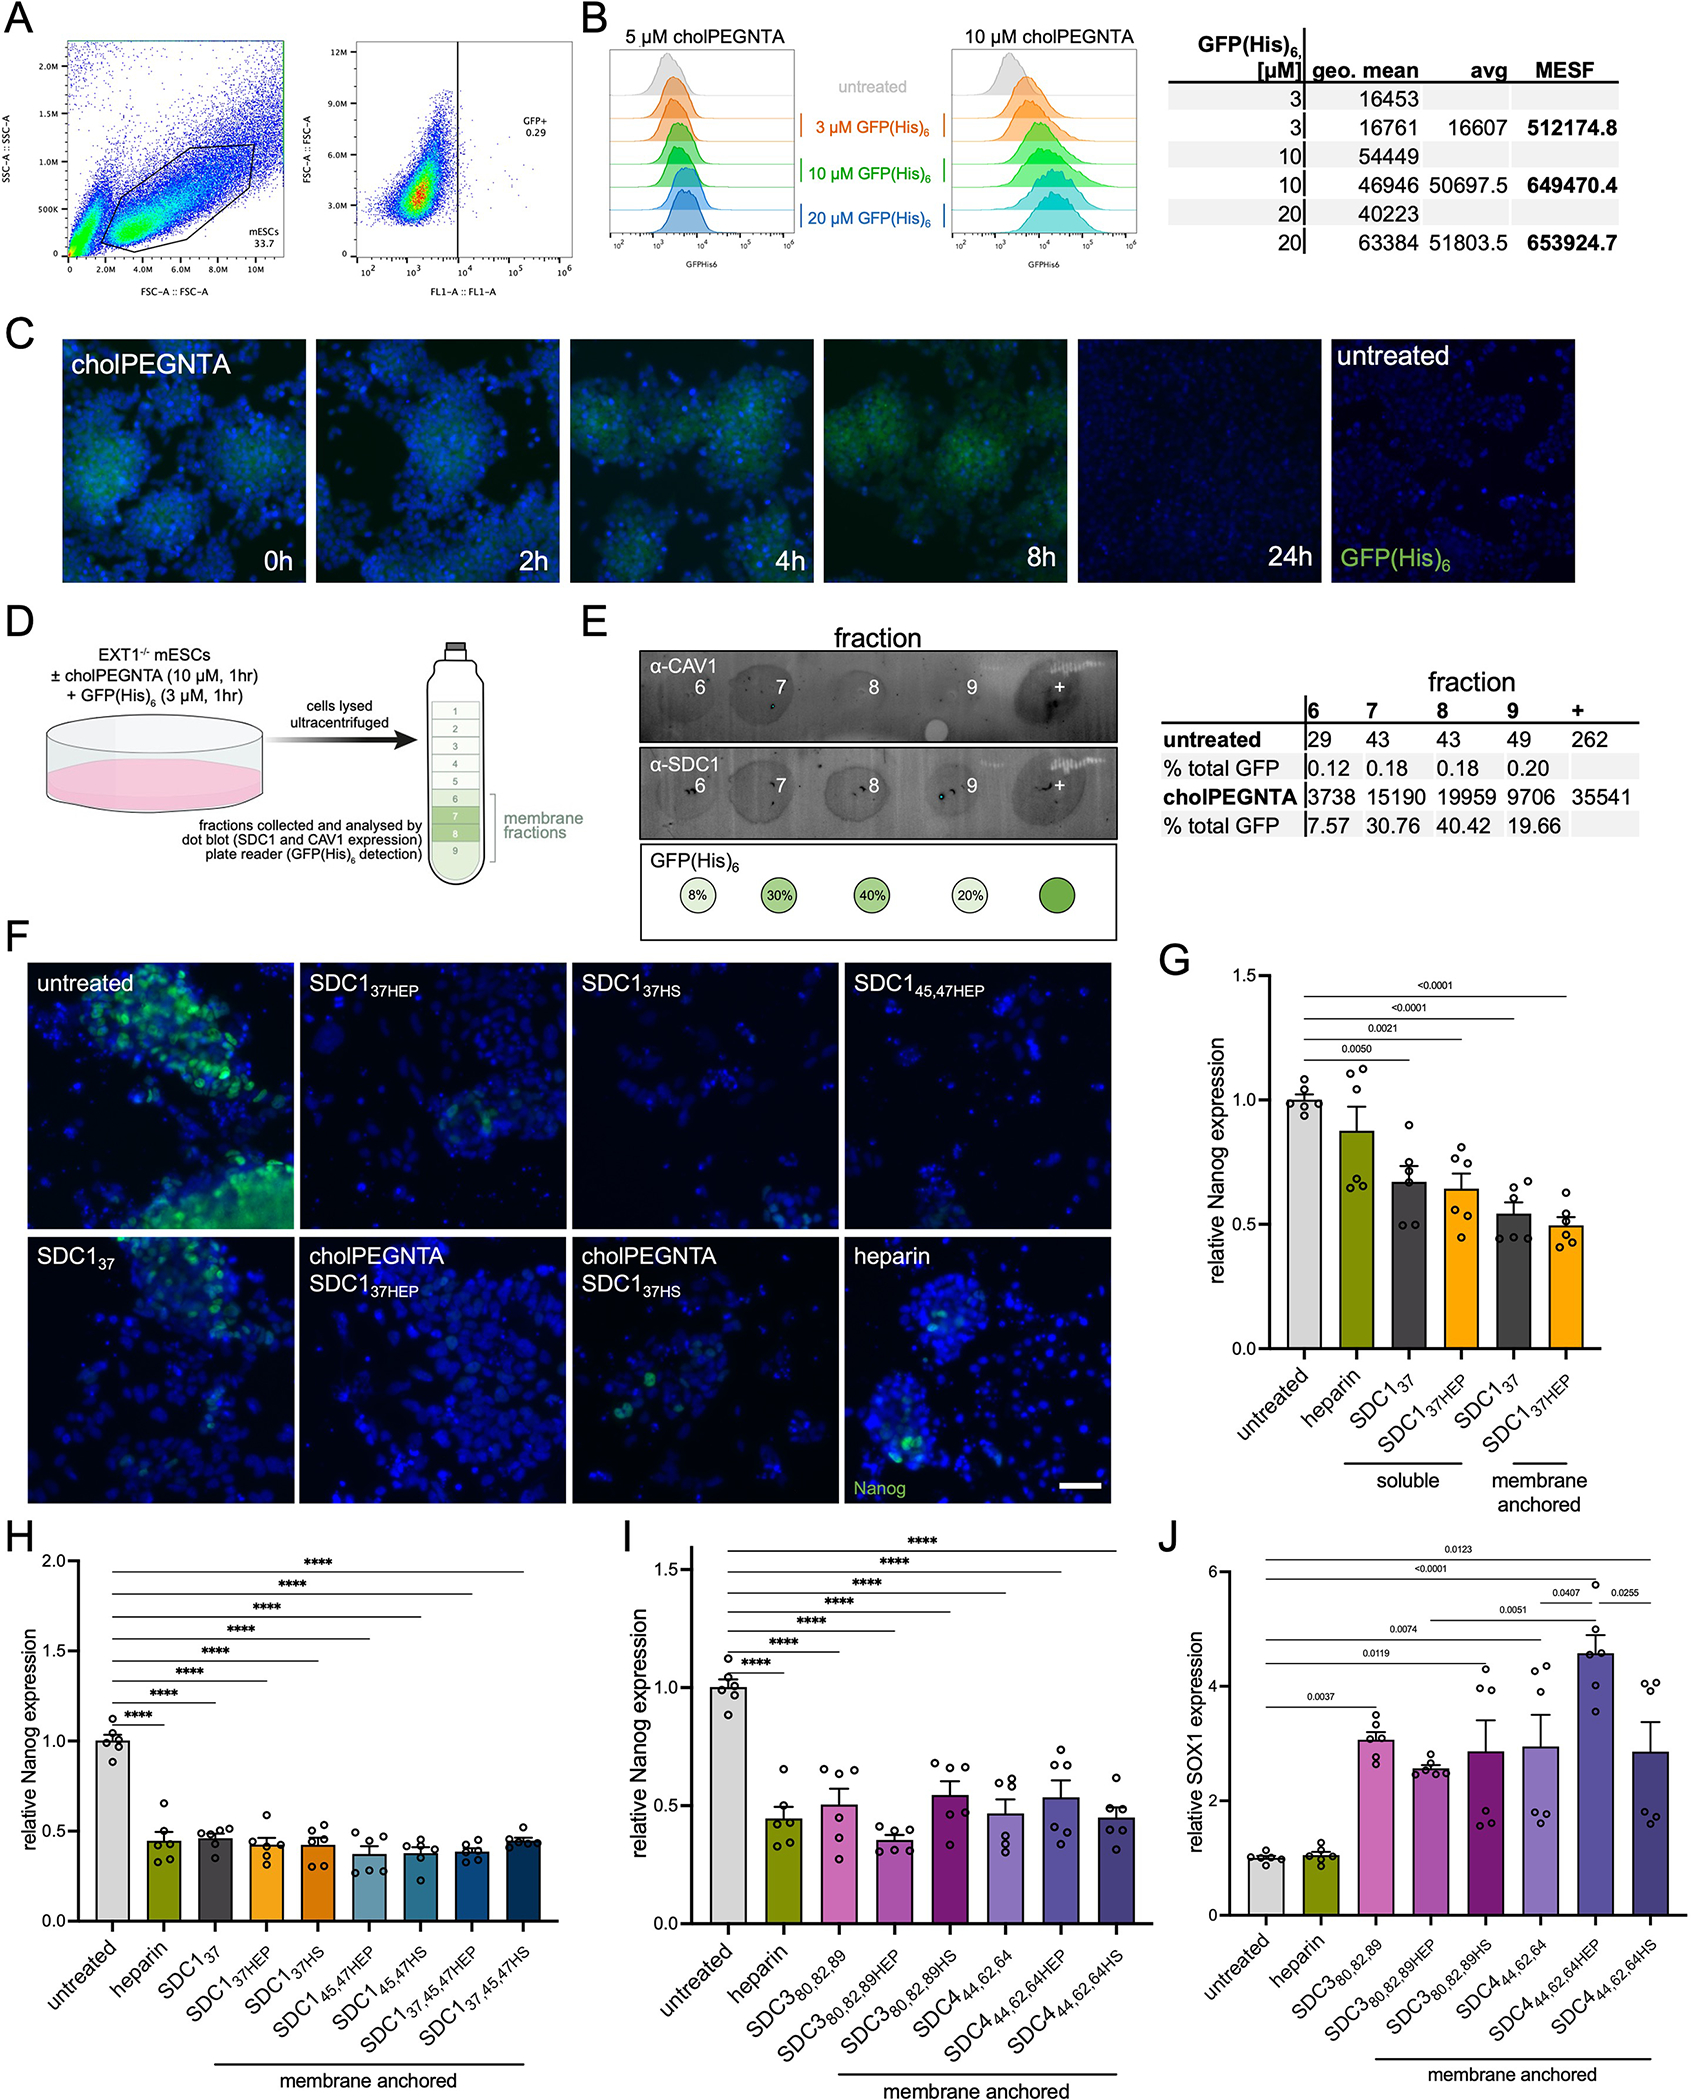
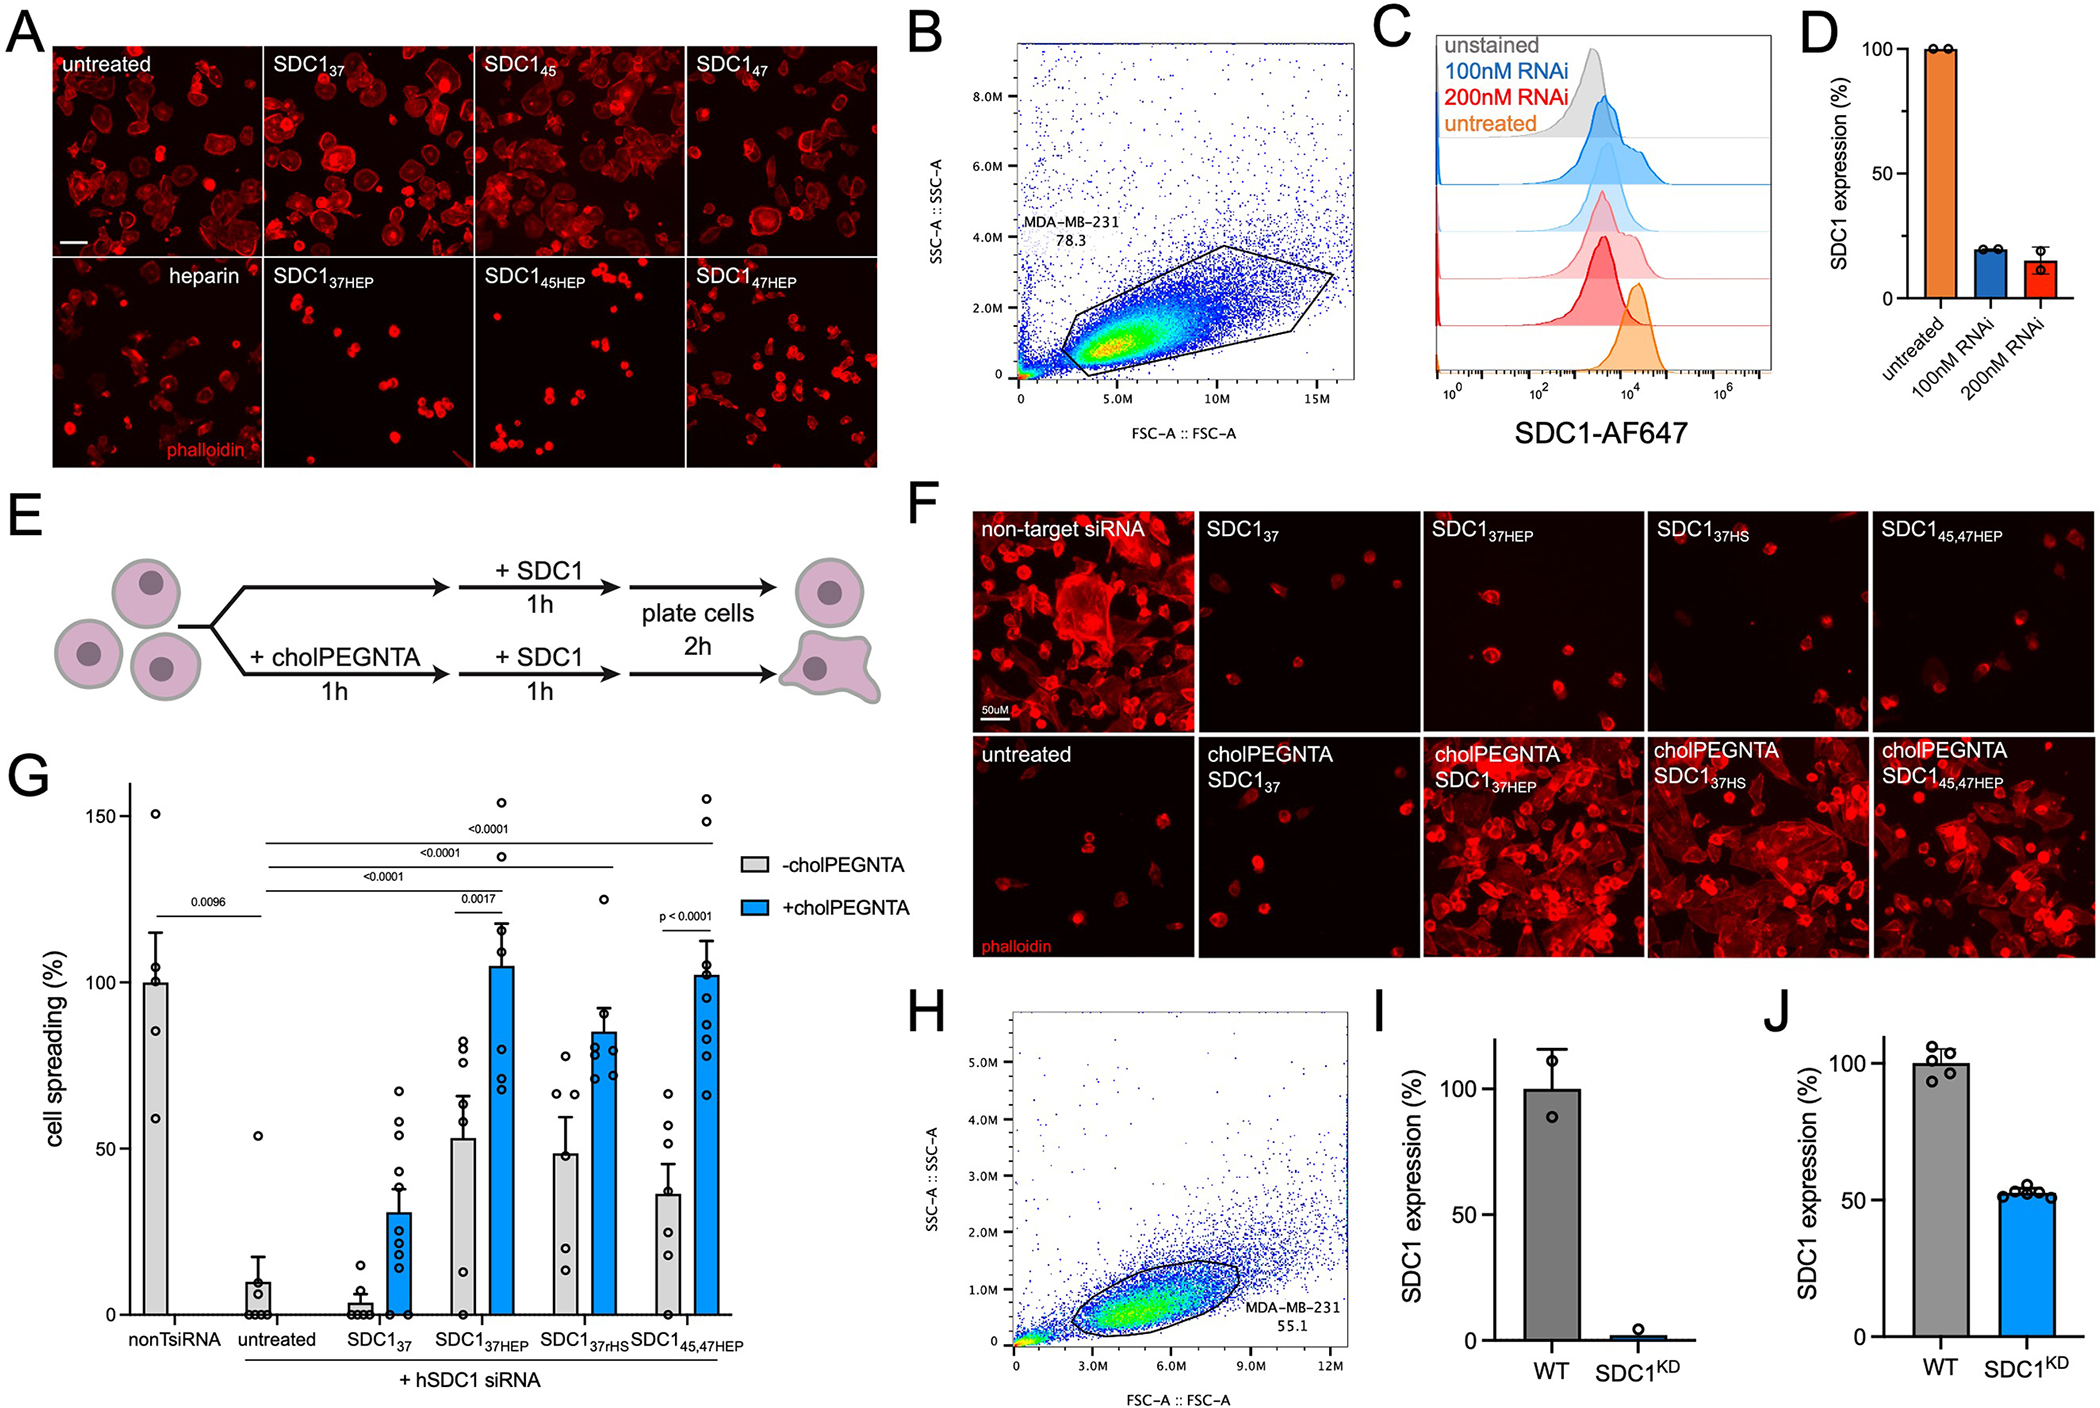
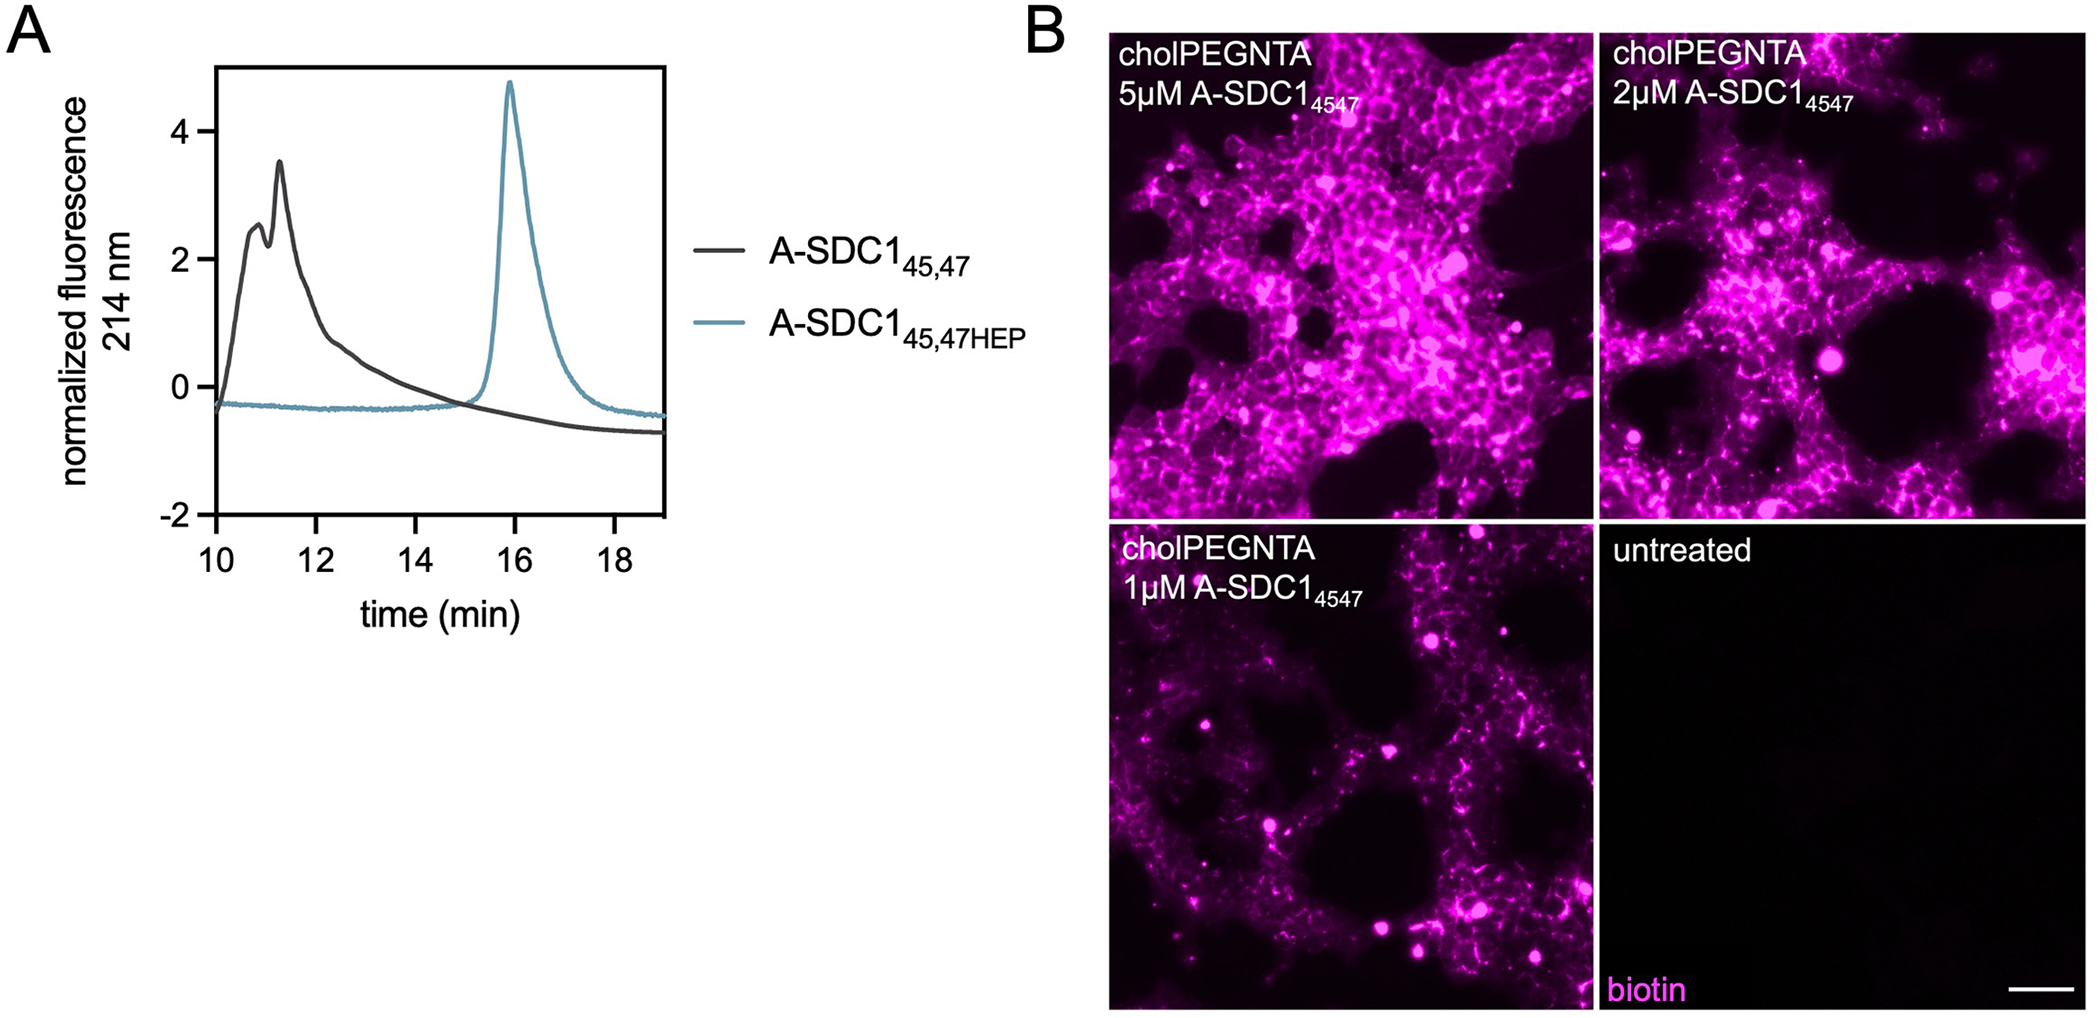
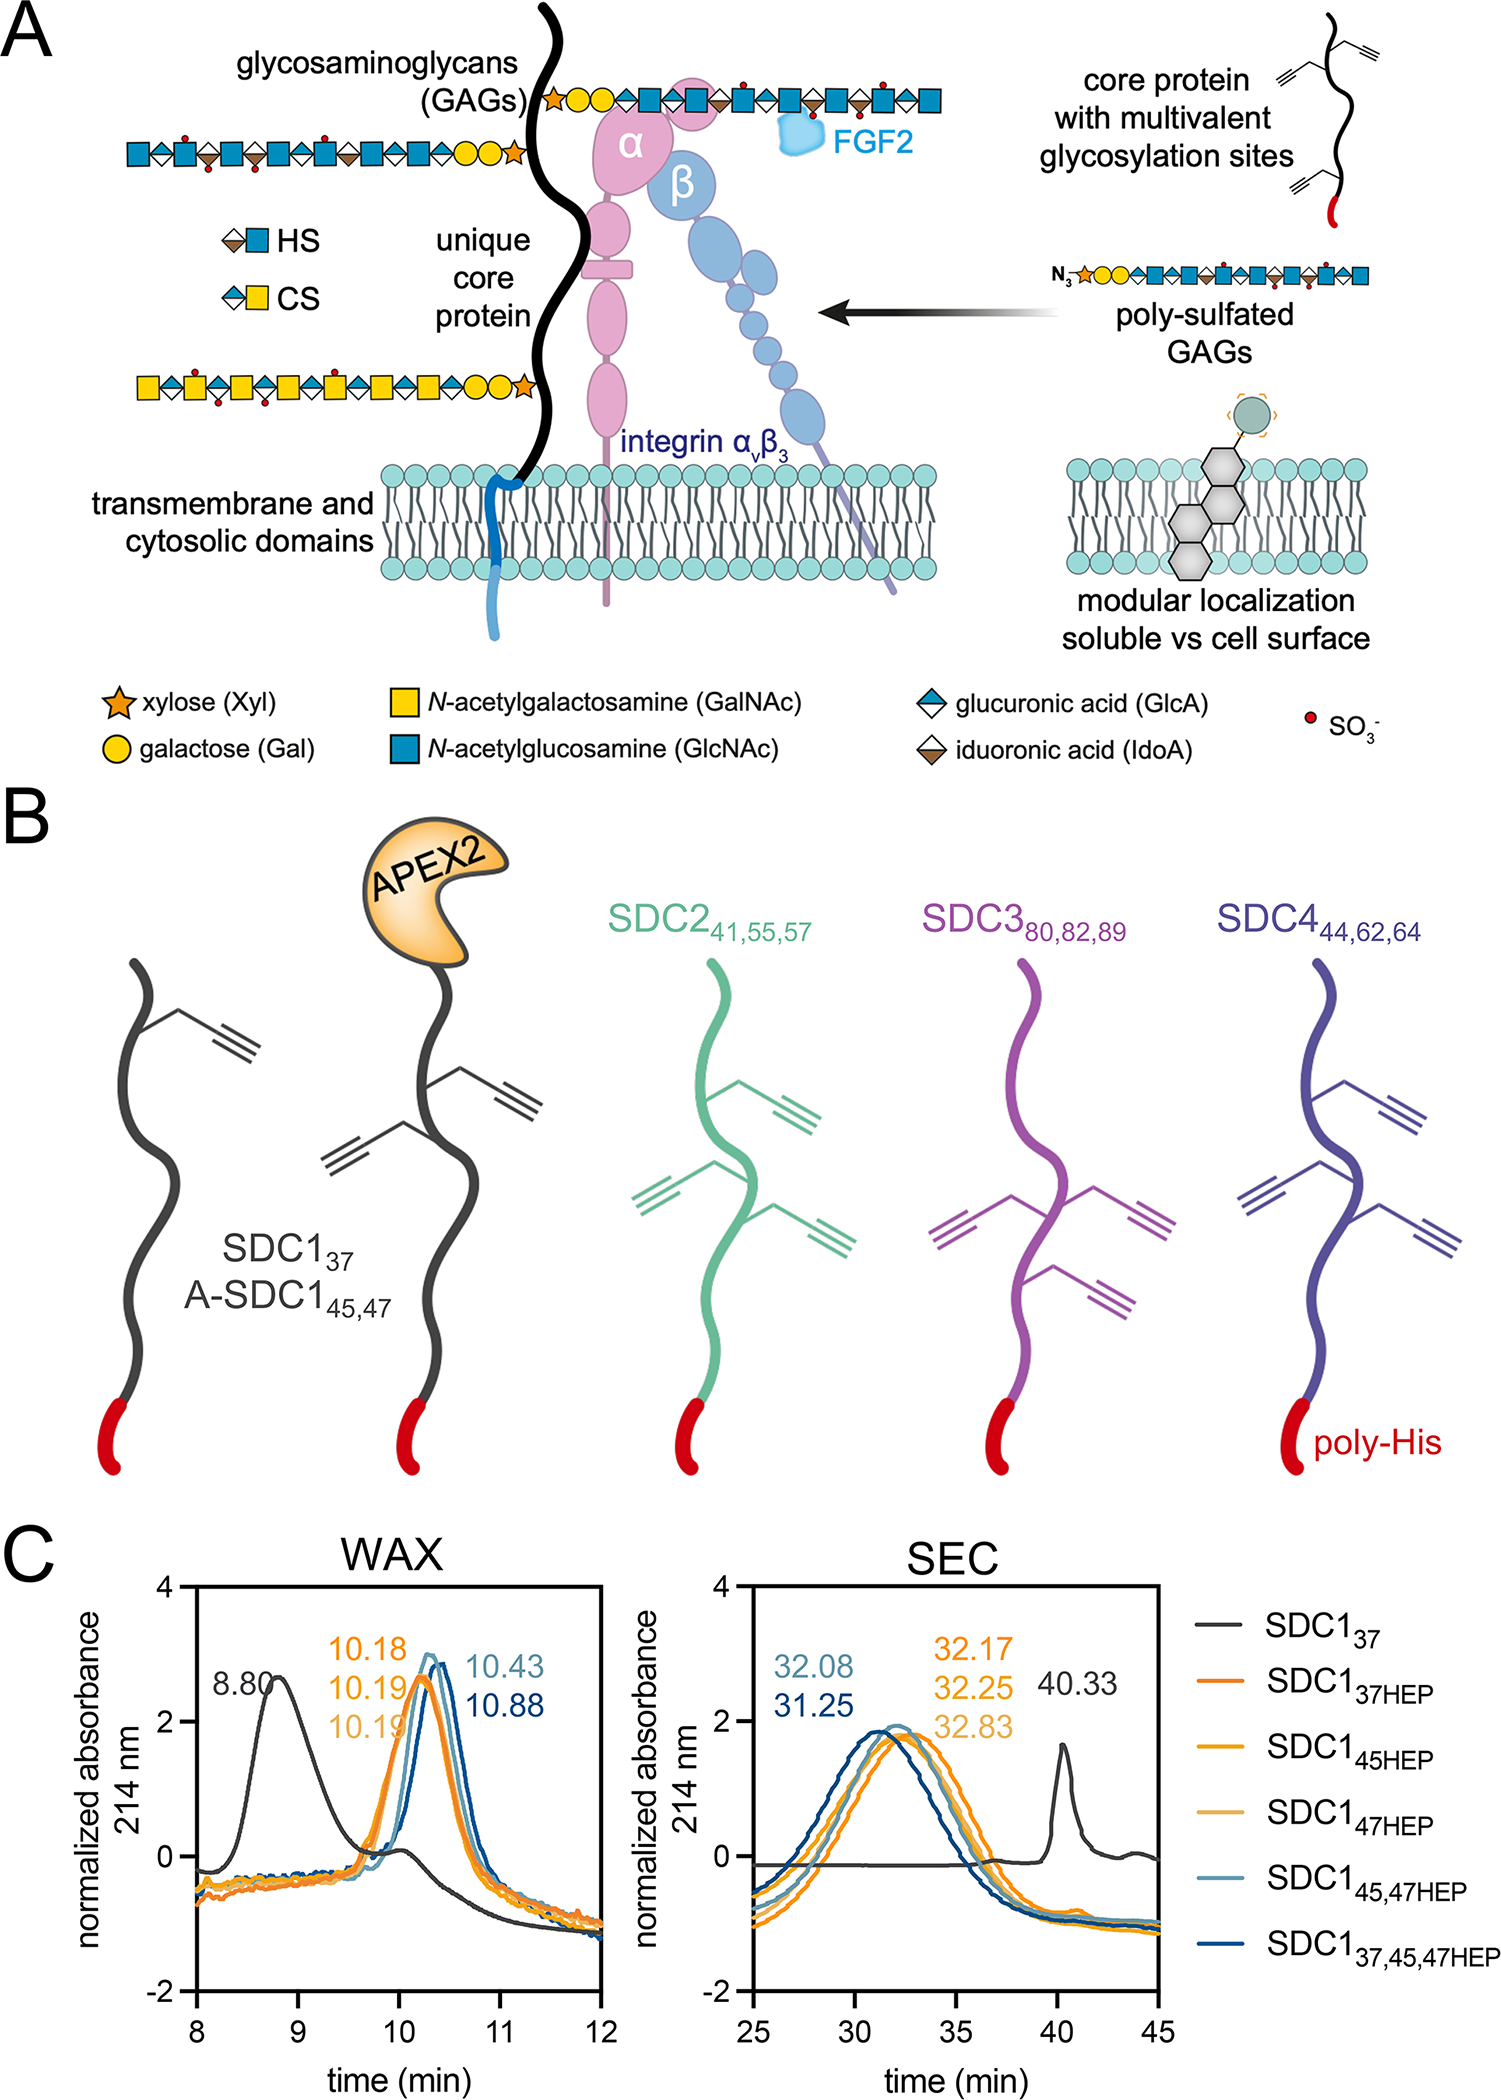
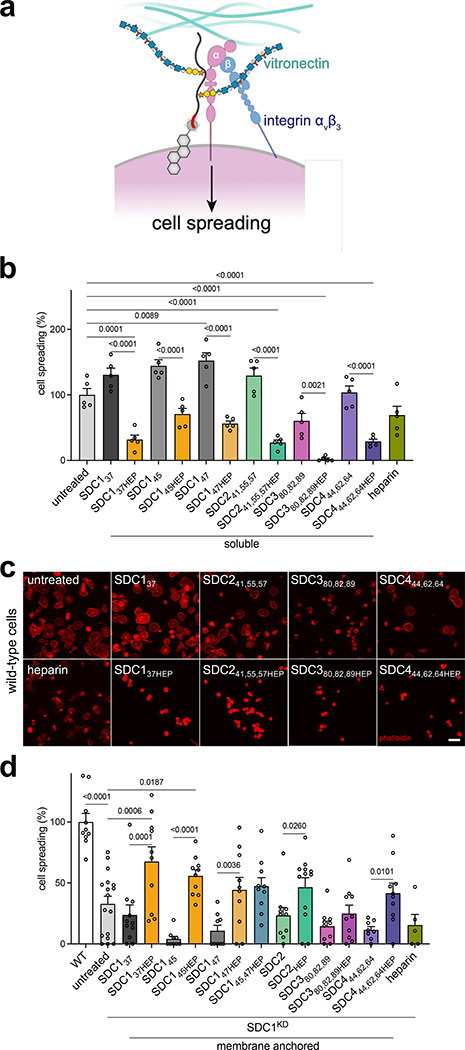
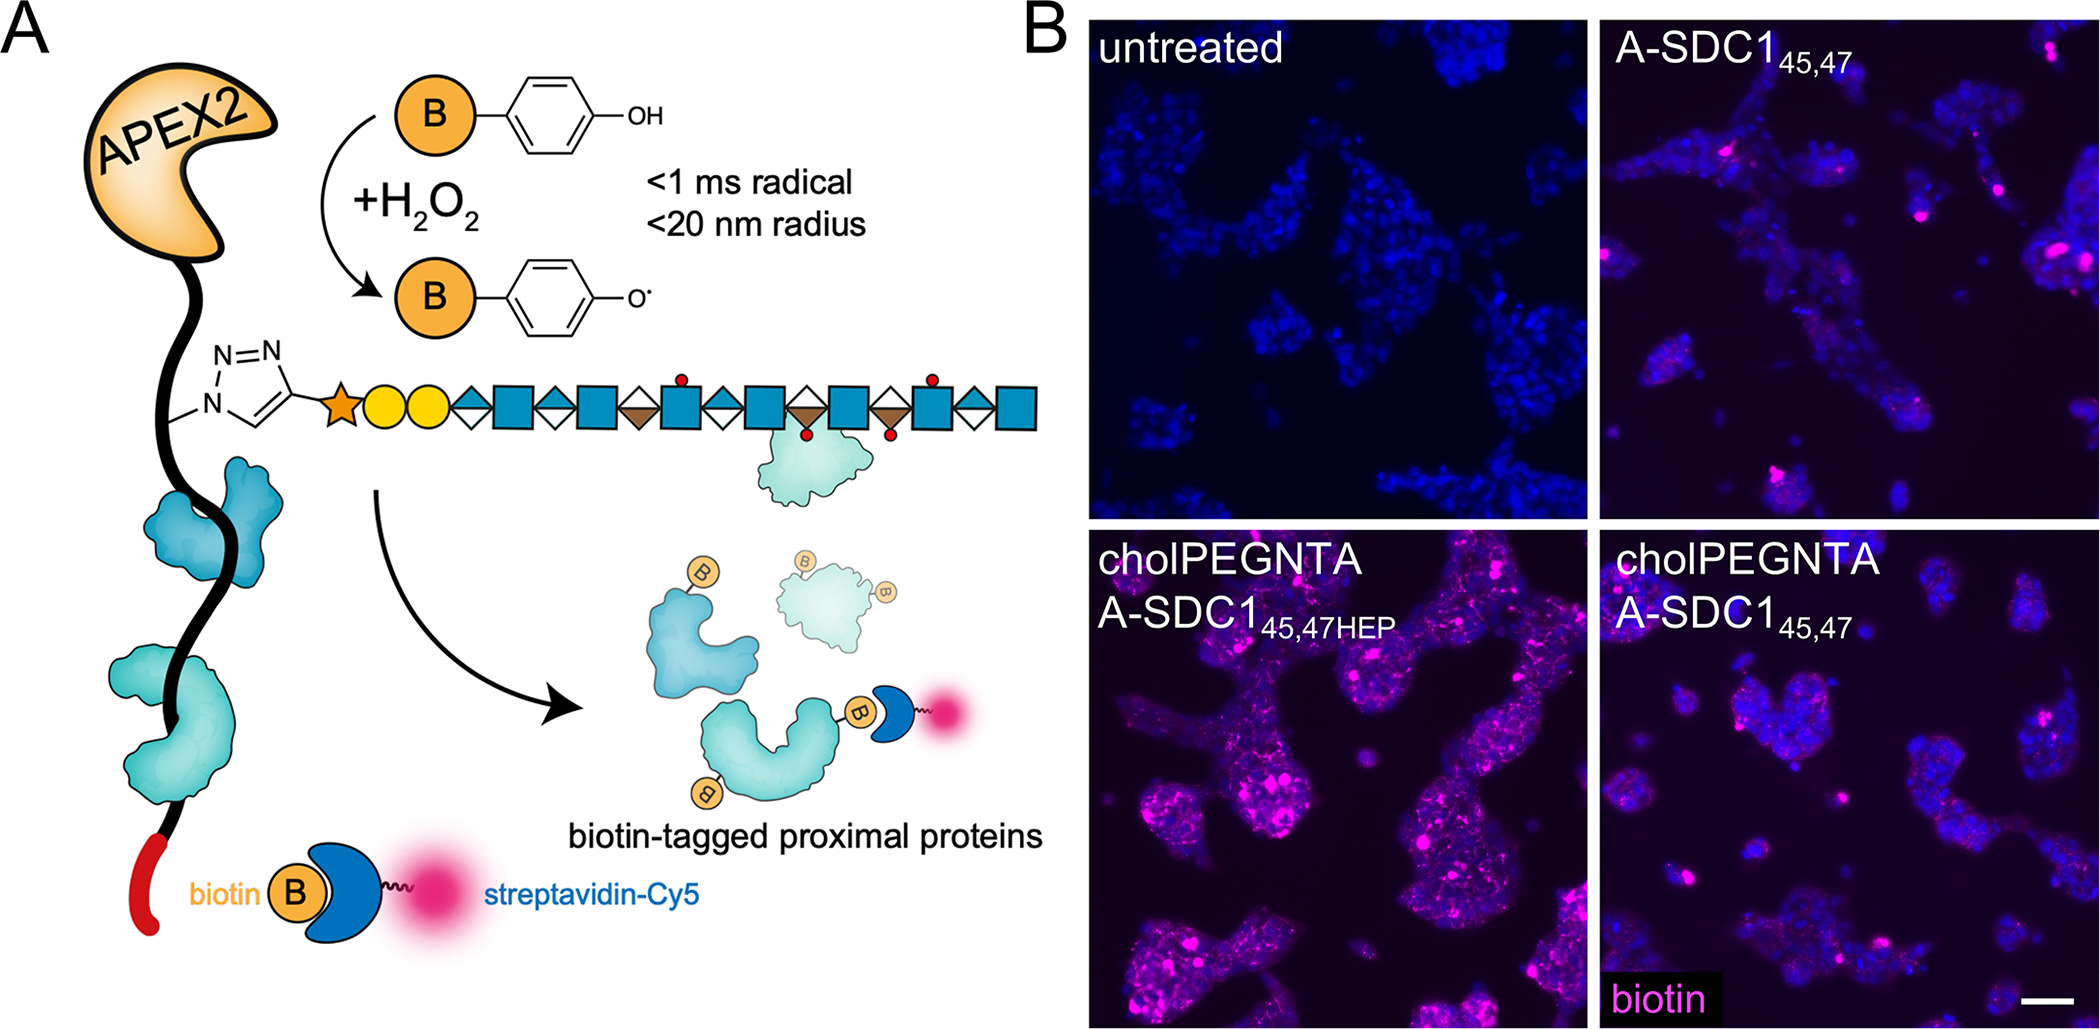
Proteoglycans are heterogeneous macromolecular glycoconjugates that orchestrate many important cellular processes. While much attention has focused on the poly-sulfated glycosaminoglycan chains that decorate proteoglycans, other important elements of their architecture, such as core proteins and membrane localization, have garnered less emphasis. Hence, comprehensive structure-function relationships that consider the replete proteoglycan architecture as glycoconjugates are limited. Here we present an extensive approach to study proteoglycan structure and biology by fabricating defined semisynthetic modular proteoglycans that can be tailored for cell surface display. The expression of proteoglycan core proteins with unnatural amino acids permits bioorthogonal click chemistry with functionalized glycosaminoglycans for methodical dissection of the parameters required for optimal binding and function of various proteoglycan-binding proteins. We demonstrate that these sophisticated materials can recapitulate the functions of native proteoglycan ectodomains in mouse embryonic stem cell differentiation and cancer cell spreading while permitting the analysis of the contributing architectural elements toward function.


Conflict of interest statement

Competing Interests Statement

The authors declare no competing interests.

Figures

Extended Data Fig. 1
Characterization of engineered proteoglycan proteins (A) SDS-PAGE analysis and subsequent Coomassie (top) and fluorescence (bottom) imaging of SDC1, SDC2, SDC3 and SDC4 ectodomains reacted with TMR-azide confirms successful incorporation of pPY. As highly disordered proteins, SDCs run anomalously by SDS-PAGE. Representative of two technical replicates, molecular weight ladder in kDa. (B) Western blot analyses of SDC1 ectodomains probed with anti-SDC1 clone 281–2. (C) Intact mass spectrometry of SDC ectodomains confirms expected masses and demonstrates fidelity of pPY incorporation. Representative of two technical replicates, molecular weight ladder in kDa. N-terminal MQ residues were missing in some constructs, consistent with production and processing by E. coli. (D) Fluorescence microscopy images of beads following treatment with proteases or buffer with p-aminophenylmercuric acetate (PAPMA, required to activate MMP) shows SDC137TMR is only cleaved by MMP9 and trypsin (positive control). The TMR fluorophore is released from the beads after being washed, as it does not contain a poly-His tag sequence that enables the C-terminal fragment to remain anchored onto the nickel bead. (E) Circular dichroism (CD) spectrum of SDC1 ectodomains show >57% disordered conformations. APEX2 fusion proteins (A-SDC145,47 and A-SDC137,45,47) display enhanced helical structure relative to their non-fused counterparts due to the helical APEX2 domain. Ten readings were taken per sample to create an average CD spectrum. (F) Quantification of predicted secondary structures, generated by CAPITO analysis.
Extended Data Fig. 2
Characterization of recombinant and azido-GAG (A) Graphical representation of heparan sulfate (HS) glycosaminoglycan biosynthesis in the endoplasmic reticulum (ER) and Golgi apparatus. The common HS and CS tetrasaccharide linker (Xyl-Gal-Gal-GlcA) is synthesized in the ER before being elongated by Ext1/2 enzyme complexes to create the HS repeating disaccharide motif. (B) Synthetic strategy to produce azidoxyloside 2. (C) Xyloside 2 was docked (AutoDock Vina) into the active site of β4GalT7 in complex with the UDP-Gal donor (teal, PDB ID 4M4K). Top poses for the docked compounds showed positioning of the xyloside C4 oxygen within 3–4 Å of the C1 atom on the galactose ring of UDP-galactose. The binding affinity of the five lowest energy poses for each simulation was averaged. Comparison of the average binding energies showed the addition of azido group into the aromatic ring component did not exact a substantial binding penalty. (D) Suspension CHO (CHO-S) cells are incubated with 2 (400 μM; 72 hr) and conditioned media is harvested for isolation of soluble recombinant, azido-GAGs (azGAGs). (E) SDS-PAGE analysis using AF546-appended rGAGs confirms that azide-primed GAGs are present mostly in the conditioned medium (CM) compared to cell extracts (E). Selective degradation of rGAGs by chondroitinase (Csase) results in a collapsed signal, indicative of our CM consisting primarily of CS. Representative of two biological replicates, molecular weight ladder in kDa. (F) azGAGs were analyzed by SDS-PAGE after copper-catalyzed azide-alkyne cycloaddition (CuAAC) with AF546 fluorophore and digestion with chondroitinase (CSase) or heparinase (HSase). The presence of a collapsed lower molecular-weight band upon CSase digestion suggests large amounts of primed CS. Representative of two biological replicates, molecular weight ladder in kDa. (G) Through dibenzocyclooctyne (DBCO) bead capture and subsequent disaccharide analysis, the proportion of azide-functionalized HS (orange) and CS (green) in the rGAG mixture can be quantified, with 27% being azido-HS (azHS), which mimics endogenous GAG ratios. (H) Standard curve of HS disaccharides. (I) Disaccharide analysis of endogenous HS (grey) from untreated cells, soluble non-primed HS (blue), azHS (orange) show similar sulfation profiles. Similarly, functionalization of free heparin (HEP, green) to azido-primed heparin (azHEP, yellow) did not affect sulfation. As expected, heparin is substantially more sulfated than HS. HS chains for mSDC1 (pink) were also analyzed. (J) Standard curve of CS disaccharides. (K) Disaccharide analysis of CS from endogenous (grey), azCS (green), rCS (blue) and mSDC1 (pink). (L) Proportion of CS and HS GAGs isolated from commercial, mammalian expressed mSDC1, calculated by disaccharide analysis. Analyses and graphs generated with GraphPad Prism 9. Bar graphs represent means and error bars represent SEM representative from two technical replicates.
Extended Data Fig. 3
Glycoconjugation of pPY-modified proteins by CuAAC (A) Weak anion exchange (WAX) traces demonstrating successful conjugation of azHEP to form SDC241,55,57HEP (mint), SDC380,82,89HEP (pink) and SDC444,62,64HEP (dark purple). SDC444,62,64 core protein (light purple) included as reference point for SDC core proteins (. (B) Intact mass spectrometry of pPY-modified GFP (GFPyne(His)6), used as a model protein, confirms the appropriate mass shift (+630.4 Da) when reacted with tetramethylrhodamine (TMR)-azide. (C) WAX traces after reaction of GFPyne(His)6 with azHEP demonstrates a shift to the more anionic product (dark green). When the reaction is performed without copper (-Cu, red), the trace overlaps with WT GFP (grey). (D) WAX traces after reaction with azGAG (green) demonstrate a less anionic glycoconjugate than GFPyne + azHEP (dark green). Copper-free controls overlap with WT GFP peak. (E) SDS-PAGE analysis of WT and GFPyne(His)6 (Y) confirms the incorporation of pPY by TMR detection only in Y. azHEP conjugation results in a higher molecular weight smear, only in the presence of copper. Representative of two technical replicates, molecular weight ladder indicates kDa. (F) Circular dichroism spectra of heparin (red), SDC137 (grey), SDC137HEP (orange) and HEK239T expressed mSDC1 (pink). (G) Analysis of the predicted structures from CD spectra indicates that glycosylation of SDC137 does not impart a change, or increase, in protein structures and native, glycosylated SDC1 is highly disordered.
Extended Data Fig. 4
Additional AlphaScreen and ELISA binding data, including SDC380,82,89 and SDC444,62,64 glycoconjugates (A) Left: Graphical depiction of AlphaScreen assay using biotinylated interactors (FGF2, FGFR, vitronectin (VN)) attached to streptavidin donor beads and Ni-NTA acceptor beads which bind His-tagged SDC proteins and present them uniformly. Right: Graphical depiction of ELISA performed with randomly oriented immobilized SDC1 and recombinant integrin αvβ3. (B) AlphaScreens performed with biotinylated FGF2. (C) AlphaScreen performed with biotinylated FGFR1. (D) AlphaScreen performed with biotinylated FGFR1 with the addition of non-tagged FGF2 to stimulate ternary complex formation. (E) AlphaScreen performed with His-tagged SDC1 ectodomains and biotinylated vitronectin (VN). (F) ELISA performed with immobilized SDC1 and recombinant integrin αvβ3. Curves represent core proteins (filled, dotted), heparin conjugates (filled, dashed) and HS conjugates (open, dashed) of SDC380,82,89 (purple) and SDC444,62,64 (pink). (G) Bar graphs of EC50 from trivalent heparin (solid) and HS (dashed) SDC137,45,47, −380,,82,89 and −444,62,64 glycoconjugates. Graphs were fitted using non-linear regression plotted using GraphPad Prism 9. Bar graphs represent means and error bars represent SEM generated from two technical replicates. (H) Tabulated apparent affinity constants (EC50) shown for SDC1 core proteins, SDC3 and SDC4 constructs, and heparan sulfate proteoglycan (HSPG)-binding proteins; FGF2, FGFR vitronectin (VN) and integrin αvβ3. mSDC1 represents HEK239T expressed recombinant mouse SDC1 ectodomain. EC50 tabulated at 1 significant figure.
Extended Data Fig. 5
Characterization of mESC remodeling by cholPEGNTA and additional differentiation data (A) Flow cytometry gating of EXT1−/− mESCs incubated with 10 μM cholPEGNTA for single cells (left), and GFP-negative population (right). (B) Treatment of EXT1−/− mESCs with 10 μM cholPEGNTA alone (untreated), or further incubation with varying concentrations of GFP(His)6 (3, 10 and 20 μM) demonstrates dose-dependent fluorescence. Comparisons of geometric mean GFP fluorescence from cells treated with 10 μM cholPEGNTA to GFP calibration beads allows for quantification of molecules of equivalent soluble fluorochrome (MESF) of protein on each cell. Saturation is observed at 10 μM GFP(His)6 at ~650,000 MESF. (C) Representative microscopy image of EXT1−/− cells treated with 10 μM cholPEGNTA for 1 hr and fixed at the indicated time points (hours after end of cholPEGNTA treatment) with 4% PFA/PBS. Cells were incubated with 10 μM GFP(His)6 and 100 μM Ni(OAc)2 for 1 hr in PBS before Hoechst staining. NTA headgroup remains accessible to His-tagged proteins for at least 8 hr. Data representative of two biological replicates. (D) Cartoon representation of EXT1−/− mESC treatment and ultracentrifugation for isolation of lipid rafts/caveolae in membrane fractions (green). (E) Dot blots from cholPEGNTA and GFP(His)6 treated EXT1−/− mESCs demonstrates significant overlap of CAV-1 (top) and SDC1 (middle) in lipid rafts. GFP(His)6 (bottom) was detected by fluorescence plate reader and quantified as a percentage of cholPEGNTA in each fraction (right). (F) Representative fluorescence microscopy images of mESCs on D6 of neuronal differentiation. Untreated EXT1−/− cells retain high Nanog expression, indicative of a pluripotent state, whilst mESCs differentiated with SDC1 constructs or soluble heparin lose Nanog expression (green). (G) RT-qPCR analysis of differentiated cells demonstrates decreased Nanog expression compared to untreated. Cells remodeled with cholPEGNTA for cell surface display of SDC1 proteins had lesser Nanog expression. (H) RT-qPCR analysis demonstrates significantly decreased expression of pluripotency marker Nanog at D6 upon treatment with heparin or SDC1 constructs. (I) Similar results to SDC1 are observed for Nanog expression when cells are treated with SDC3 and SDC4 proteins. (J) RT-qPCR analysis at D6 shows increased SOX1 expression when cells are treated with SDC3 and SDC4 proteins, both deglycosylated and as glycoconjugates. SDC4 shows significant differences between core protein (light purple) and its azHEP conjugate (purple), and between azHEP and azHS conjugates (dark purple). All experiments performed in technical triplicate in two biological replicates. One-sided ANOVA with Tukey’s post-hoc, p values indicated on graph, (****) p <0.0001. Bar graphs represent means and error bars represent SEM.
Extended Data Fig. 6
Characterization of SDC1 knockdown by RNAi and CRISPR (SDC1KD) and additional cell spreading experiments (A) Representative microscopy images from soluble addition of monovalent SDC1 to wild-type MDA-MB-231. Data representative of three biological replicates. (B) Flow cytometry gating of wild-type MDA-MB-231 cells. (C) MDA-MB-231 cells treated with 100 nM (blue) or 200 nM (red) pooled SDC1 dsRNAi exhibit reduced SDC1 expression compared to non-targeting DsiRNA control (orange). Unstained cells (gray) are those incubated with secondary antibody only. (D) Quantification of SDC1 expression in MDA-MB-231 cells after knockdown with 100 nM and 200 nM pooled DsiRNA as a percent of non-targeting DsiRNA control. (E) Cartoon depiction of remodeling strategy of MDA-MB-231 cells, performed whilst cells are suspended in 96-well round bottom plates. Remodeled cells are plated on vitronectin-coated surfaces and allowed to spread for 2 hr. (F) Representative microscopy images of MDA-MB-231 cells treated with 200 nM hSDC1 siRNA or non-target. Only cell surface, glycosylated SDC1 proteins can rescue cell spreading. Data representative of three biological replicates. (G) Quantification of cell spreading on vitronectin. (H) Flow cytometry gating of wild-type MDA-MB-231 cells. (I) Quantification of SDC1 protein levels in CRISPR-generated SDC1KD cells by flow cytometry. Data represents the mean fluorescence intensity noramalised to WT MDA-MB-231 cells. (J) qRT-PCR confirms knockdown of SDC1 in SDC1KD cells using two primer sets targeting SDC1. Data presented is fold change of SDC1 mRNA as a percent of WT MDA-MB-231 cells, as calculated by delta delta CT. Bar graphs represent means and error bars represent SEM. One-sided ANOVA with Tukey’s post-hoc test with Šidák correction for multiple comparisons was performed; p values indicated on graph, (****) p <0.0001. For each condition, n >10 images examined across two biological replicates.
Extended Data Fig. 7
APEX-SDC145,47 glycoconjugation yields and additional proximity labeling data (A) Weak anion exchange (WAX) traces demonstrating successful conjugation of azHEP to A-SDC145,47 (grey) and formation of the more anionic product A-SDC145,47HEP (blue). CuAAC performed at quantitative yields. (B) Dose dependent fluorescence generated after live cell proximity labeling with cell surface (10 μM cholPEGNTA) A-SDC145,47 at 5 μM, 2 μM and 1 μM. Biotinylation is detected by Cy5-streptavidin (pink) with fluorescence mostly localized to cell surfaces. Representative images from three biological replicates.
Figure 1.
Figure 1.. Production of pPY-functionalized proteoglycan (PG) core protein and azido-GAGs to generate defined ectodomains.
(A) PG architecture is composed of a core protein covalently decorated with glycosaminoglycan (GAG) chains, with a common tetrasaccharide (GlcA-Gal-Gal-Xyl) linker, followed by disaccharide repeating units. The elongated GAG chains are typically heparan (HS, IdoA-GlcNAc) or chondroitin sulfate (CS, GlcA-GalNAc). SDC1 N-terminal GAG attachment sites (S37,45,47) are usually occupied by HS. PGs can bind a variety of biomolecules (e.g. FGF2, αvβ3 integrin), yet which components are responsible for binding and how GAG chain multivalency influences these interactions, are unclear. The modular platform outlined herein utilizes protein engineering to produce PG ectodomains with p-propargyltyrosine (pPY)-functionalized amino acids for bioorthogonal glycosylation with azido-GAGs. The presentation of native PGs as membrane-anchored or soluble ectodomains is mimicked by remodeling cells with or without a lipid anchor, respectively. (B) The incorporation of pPY into E. coli expressed PG ectodomains at the conserved GAG attachment sites (indicated by subscripts) provides a handle for chemical glycosylation. (C) Weak anion exchange (WAX, left) and size exclusion (SEC, right) chromatography discern deglycosylated (gray), monovalent (orange, SDC137HEP, SDC145HEP, SDC147HEP), divalent (SDC145,47HEP, light blue) and trivalent (SDC137,45,47, dark blue) glycoconjugates. Representative data from duplicate experiments.
Figure 2.
Figure 2.. Binding of SDC1 to HSPG-binding proteins is influenced by GAG identity and multivalency.
AlphaScreen assays performed with (A) His-tagged SDC1 ectodomains and biotinylated FGF2, or (B) His-tagged SDC1 ectodomains and biotinylated FGFR1. (C) Scatter plots of average EC50 values depicting multivalent GAG chain relationships with binding FGF2 or FGFR1. (D) AlphaScreen assay to probe for ternary complex formation among His-tagged SDC1 ectodomains, biotinylated FGFR1, and soluble FGF2. (E) Scatter plots of average EC50 values depicting multivalent GAG chain relationships with ternary complex formation. (F) AlphaScreen assay performed with His-tagged SDC1 ectodomains and biotinylated VN. (G) ELISA performed with immobilized SDC1 and recombinant αvβ3 integrin. (H) Scatter plots of average EC50 values depicting multivalent GAG chain relationships with VN and αvβ3 integrin. All data points were constructed as the average of two experimental duplicates. Graphs were fitted using non-linear regression plotted using GraphPad Prism 9.
Figure 3.
Figure 3.. Membrane remodeling with engineered SDC1 ectodomains provides insight into regulation of mESC differentiation by proteoglycans.
(A) HS-deficient (Ext1−/−) mESCs fail to differentiate due to their reduced ability to bind FGF2 (blue). The formation of ternary complexes among FGF2, FGFR, and HSPGs promotes differentiation. (B) A two-step complexation strategy is used to present engineered SDC1 ectodomain variants onto cell surfaces. Live mESCs are first incubated with cholPEGNTA (10 μM, 1 hr, 37°C), followed by Ni(OAc)2 (100 μM, teal) and the SDC1 ectodomain equipped with a poly-His tag (red tail; 2 μM, 1 hr, 37°C). Excess material is washed off at each step. (C) A six-day protocol for mESC differentiation, illustrating the loss of pluripotency marker Nanog and gain of SOX1 expression, indicative of neuroectoderm differentiation. Ext1−/− cells are incubated with engineered SDC1 constructs, with or without prior cell surface engineering, for 1 hr on D0 or a single treatment with soluble heparin (5 μg/mL) until D2. (D) GAG-conjugated SDC1 ectodomains (2 μM) can rescue differentiation of Ext1−/− mESCs, as evidenced by expression of neural precursor markers Sox1 (green) and Tubb3 (red). Scale bar: 50 μm. Data representative of three biological replicates. (E) RT-qPCR analysis at D6 of differentiation shows decreased Nanog expression of treated (heparin or SDC1) compared to untreated cells. Cells remodeled with cholPEGNTA before addition of SDC1 proteins demonstrated increased SOX1 expression. (F) RT-qPCR analysis at D6 of differentiation demonstrates increased expression of neural differentiation marker SOX1 with addition of glycosylated SDC1. All proteins are displayed on cell surface (+cholPEGNTA, 10 μM). All experiments performed in technical triplicate in two biological replicates. One-way ANOVA with Tukey’s post-hoc, (*) p <0.0332, (**) p <0.0021, (***) p <0.0002, (****) p <0.0001. Bar graphs represent means and error bars represent SEM.
Figure 4.
Figure 4.. Adhesion and spreading of mammary carcinoma cells.
(A) Cartoon depiction of murine SDC1-mediated cell spreading of MDA-MB-231 mammary carcinoma cells occurring through both protein- and GAG-mediated interactions with integrin αvβ3 and GAG-mediated interactions with vitronectin (VN), for which αvβ3 is the canonical receptor. Note: human and mouse SDC1 are highly homologous (78%) in the region responsible for αvβ3 integrin-mediated activation. (B) Quantification of cell spreading of wild-type MDA-MB-231 cells on vitronectin surfaces. (C) Representative fluorescence microscopy images of wild-type MDA-MB-231 cells plated in media supplemented with indicated SDC family proteins (2 μM) or heparin (0.4 μM). Adhesion and spreading of cells were inhibited by addition of soluble glycoconjugates and SDC380,82,89. Cells were fixed and stained for phalloidin (red) after 2 hr on VN matrix. Scale bar: 50 μm. Data representative of three biological replicates. (D) Quantification of cell spreading in wild-type (WT) and SDC1 knockdown (SDC1KD) cells. Bar graphs represent means and error bars represent SEM. One-way ANOVA with Tukey’s post-hoc, (*) p <0.0332, (**) p <0.0021, (***) p <0.0002, (****) p <0.0001. Error bars represent SEM. For each condition, n >10 images across two biological replicates.
Figure 5.
Figure 5.. Proximity tagging with A-SDC145,47 to capture interactomes in live cells.
(A) Cartoon depicting proximity tagging with APEX2 fused SDC145,47HEP (A-SDC145,47HEP). After incubation of live cells with A-SDC145,47HEP, excess unbound protein is washed away and cells are incubated with biotin phenol (yellow circle, 0.5 mM, 30 min). The APEX2 peroxidase catalyzes the formation of short lived biotinyl radicals that react with proximal proteins upon addition of H2O2. (B) Ext1−/− mESCs subjected to the proximity tagging protocol qualitatively demonstrate differences in interactomes (biotin, purple) based on membrane anchoring (+ cholPEGNTA) and glycosylation (A-SDC145,47HEP). Data representative of three biological replicates.

Similar articles

Cited by

References

    1. Hacker U, Nybakken K & Perrimon N Heparan sulphate proteoglycans: the sweet side of development. Nat Rev Mol Cell Biol 6, 530–541, doi:10.1038/nrm1681 (2005). - DOI - PubMed
    1. Critcher M, O’Leary T & Huang ML Glycoengineering: scratching the surface. Biochem J 478, 703–719, doi:10.1042/BCJ20200612 (2021). - DOI - PubMed
    1. Langford JK, Stanley MJ, Cao D & Sanderson RD Multiple heparan sulfate chains are required for optimal syndecan-1 function. J Biol Chem 273, 29965–29971, doi:10.1074/jbc.273.45.29965 (1998). - DOI - PubMed
    1. Bernfield M et al. Biology of the Syndecans - a Family of Transmembrane Heparan-Sulfate Proteoglycans. Annu Rev Cell Biol 8, 365–393, doi:DOI 10.1146/annurev.cb.08.110192.002053 (1992). - DOI - PubMed
    1. Zhang YH et al. Targeting of Heparanase-modified Syndecan-1 by Prosecretory Mitogen Lacritin Requires Conserved Core GAGAL plus Heparan and Chondroitin Sulfate as a Novel Hybrid Binding Site That Enhances Selectivity. Journal of Biological Chemistry 288, 12090–12101, doi:10.1074/jbc.M112.422717 (2013). - DOI - PMC - PubMed

Publication types