. 2022 May;54(5):725-734.
doi: 10.1038/s41588-022-01065-4. Epub 2022 May 12.

Sequence-based modeling of three-dimensional genome architecture from kilobase to chromosome scale

Affiliations

Sequence-based modeling of three-dimensional genome architecture from kilobase to chromosome scale

Jian Zhou. Nat Genet. 2022 May.

Abstract

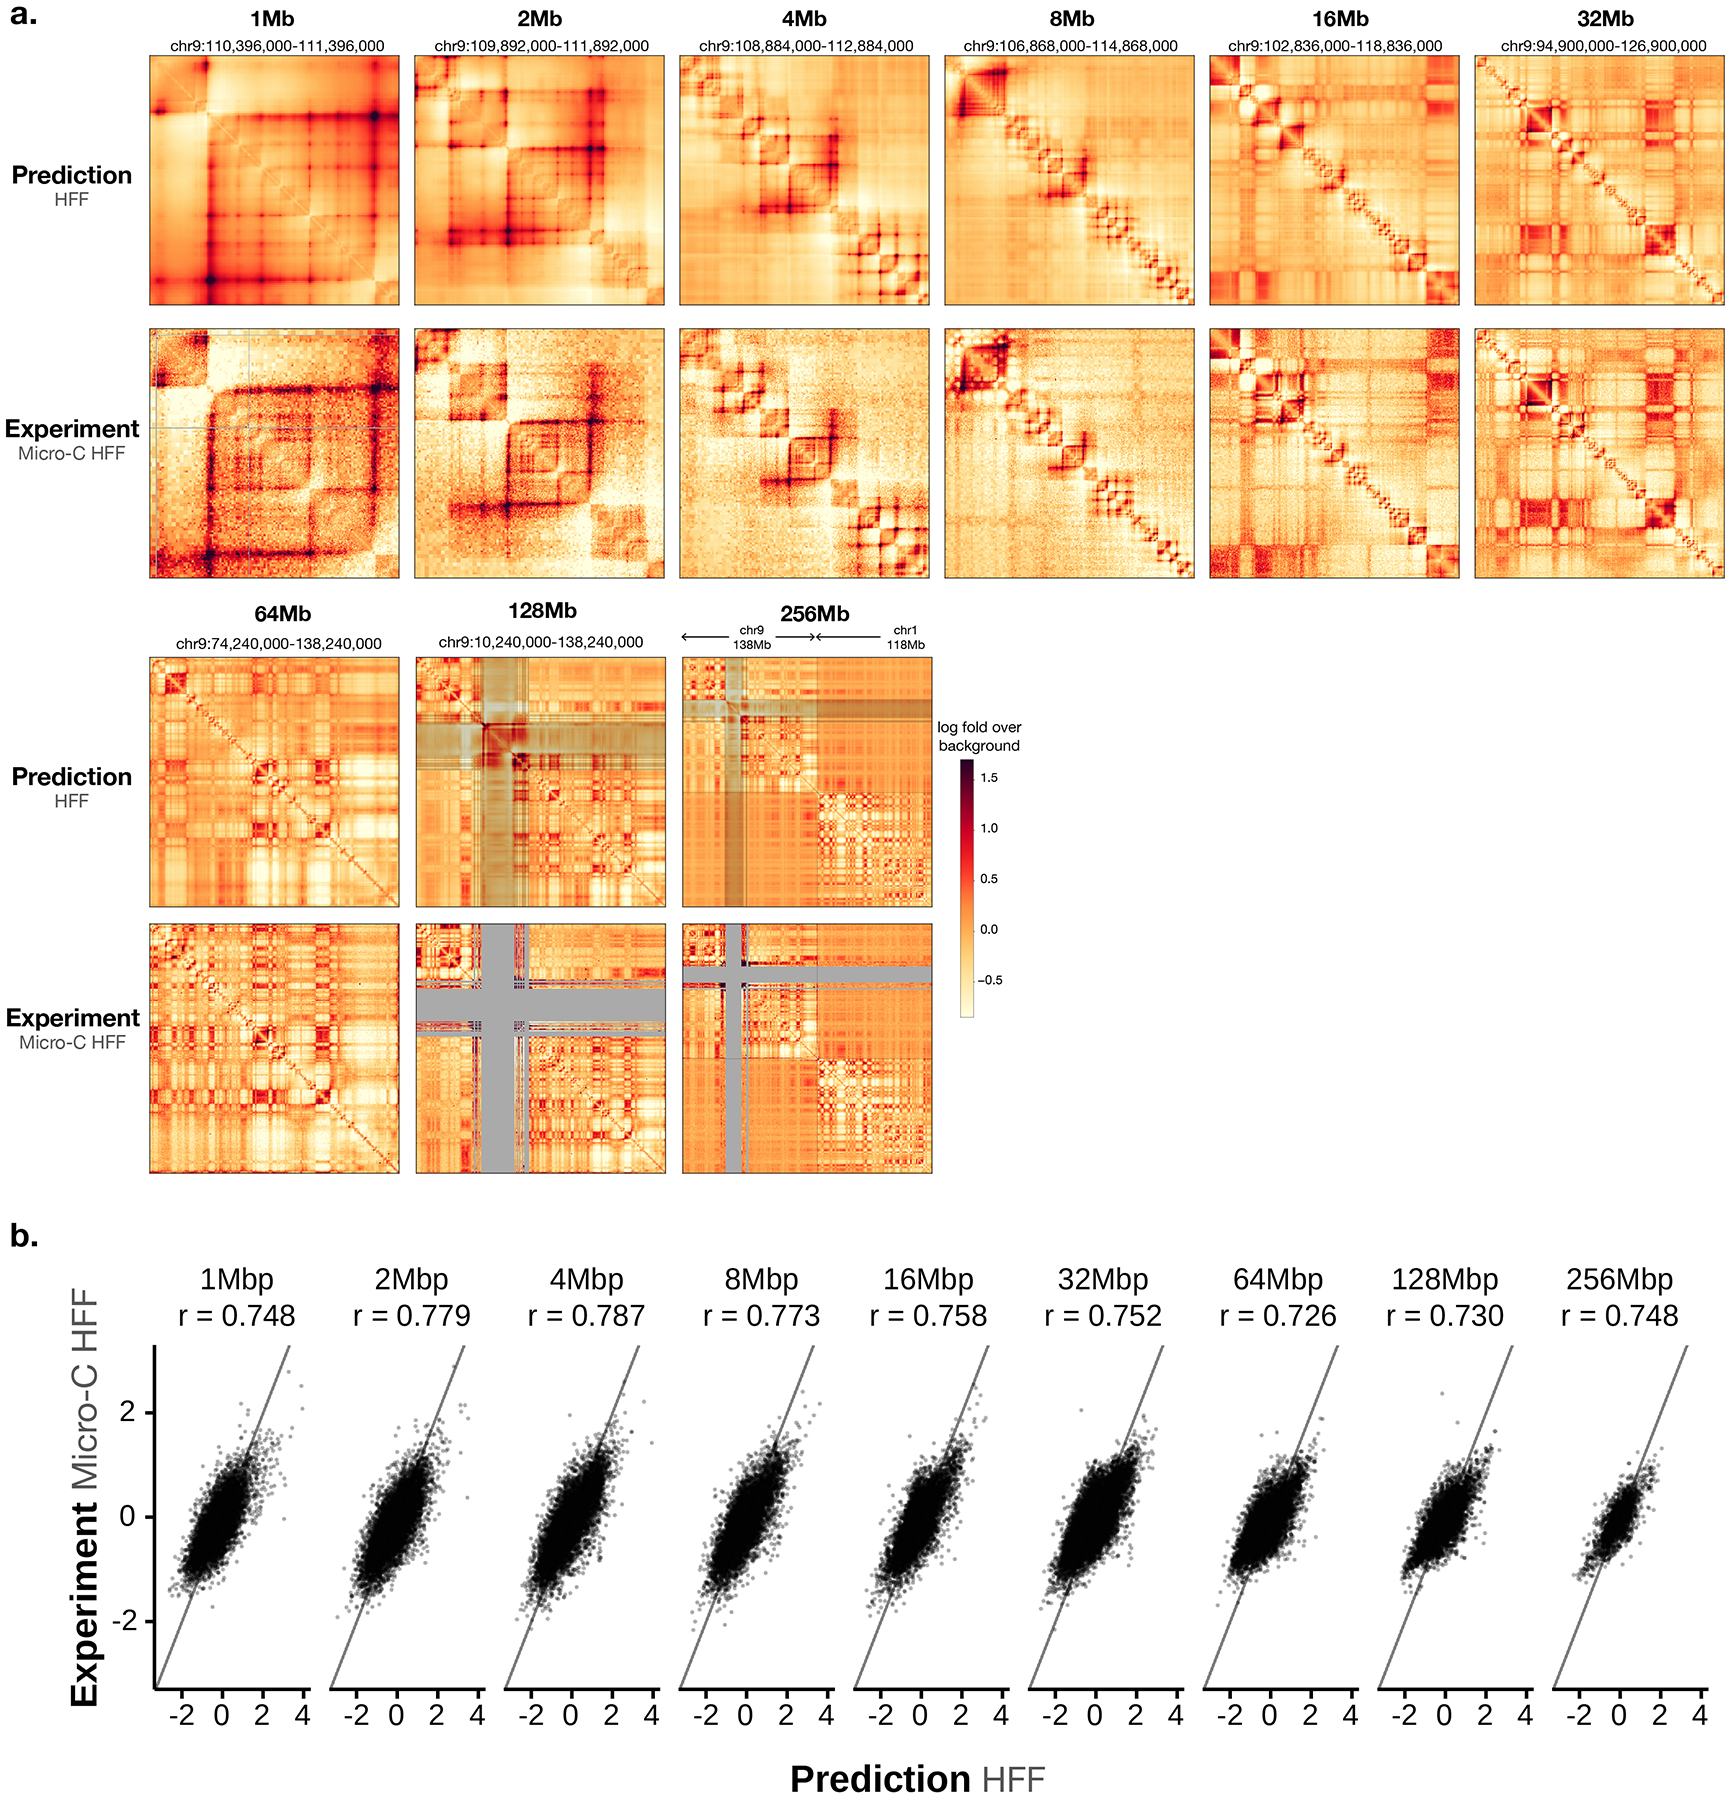
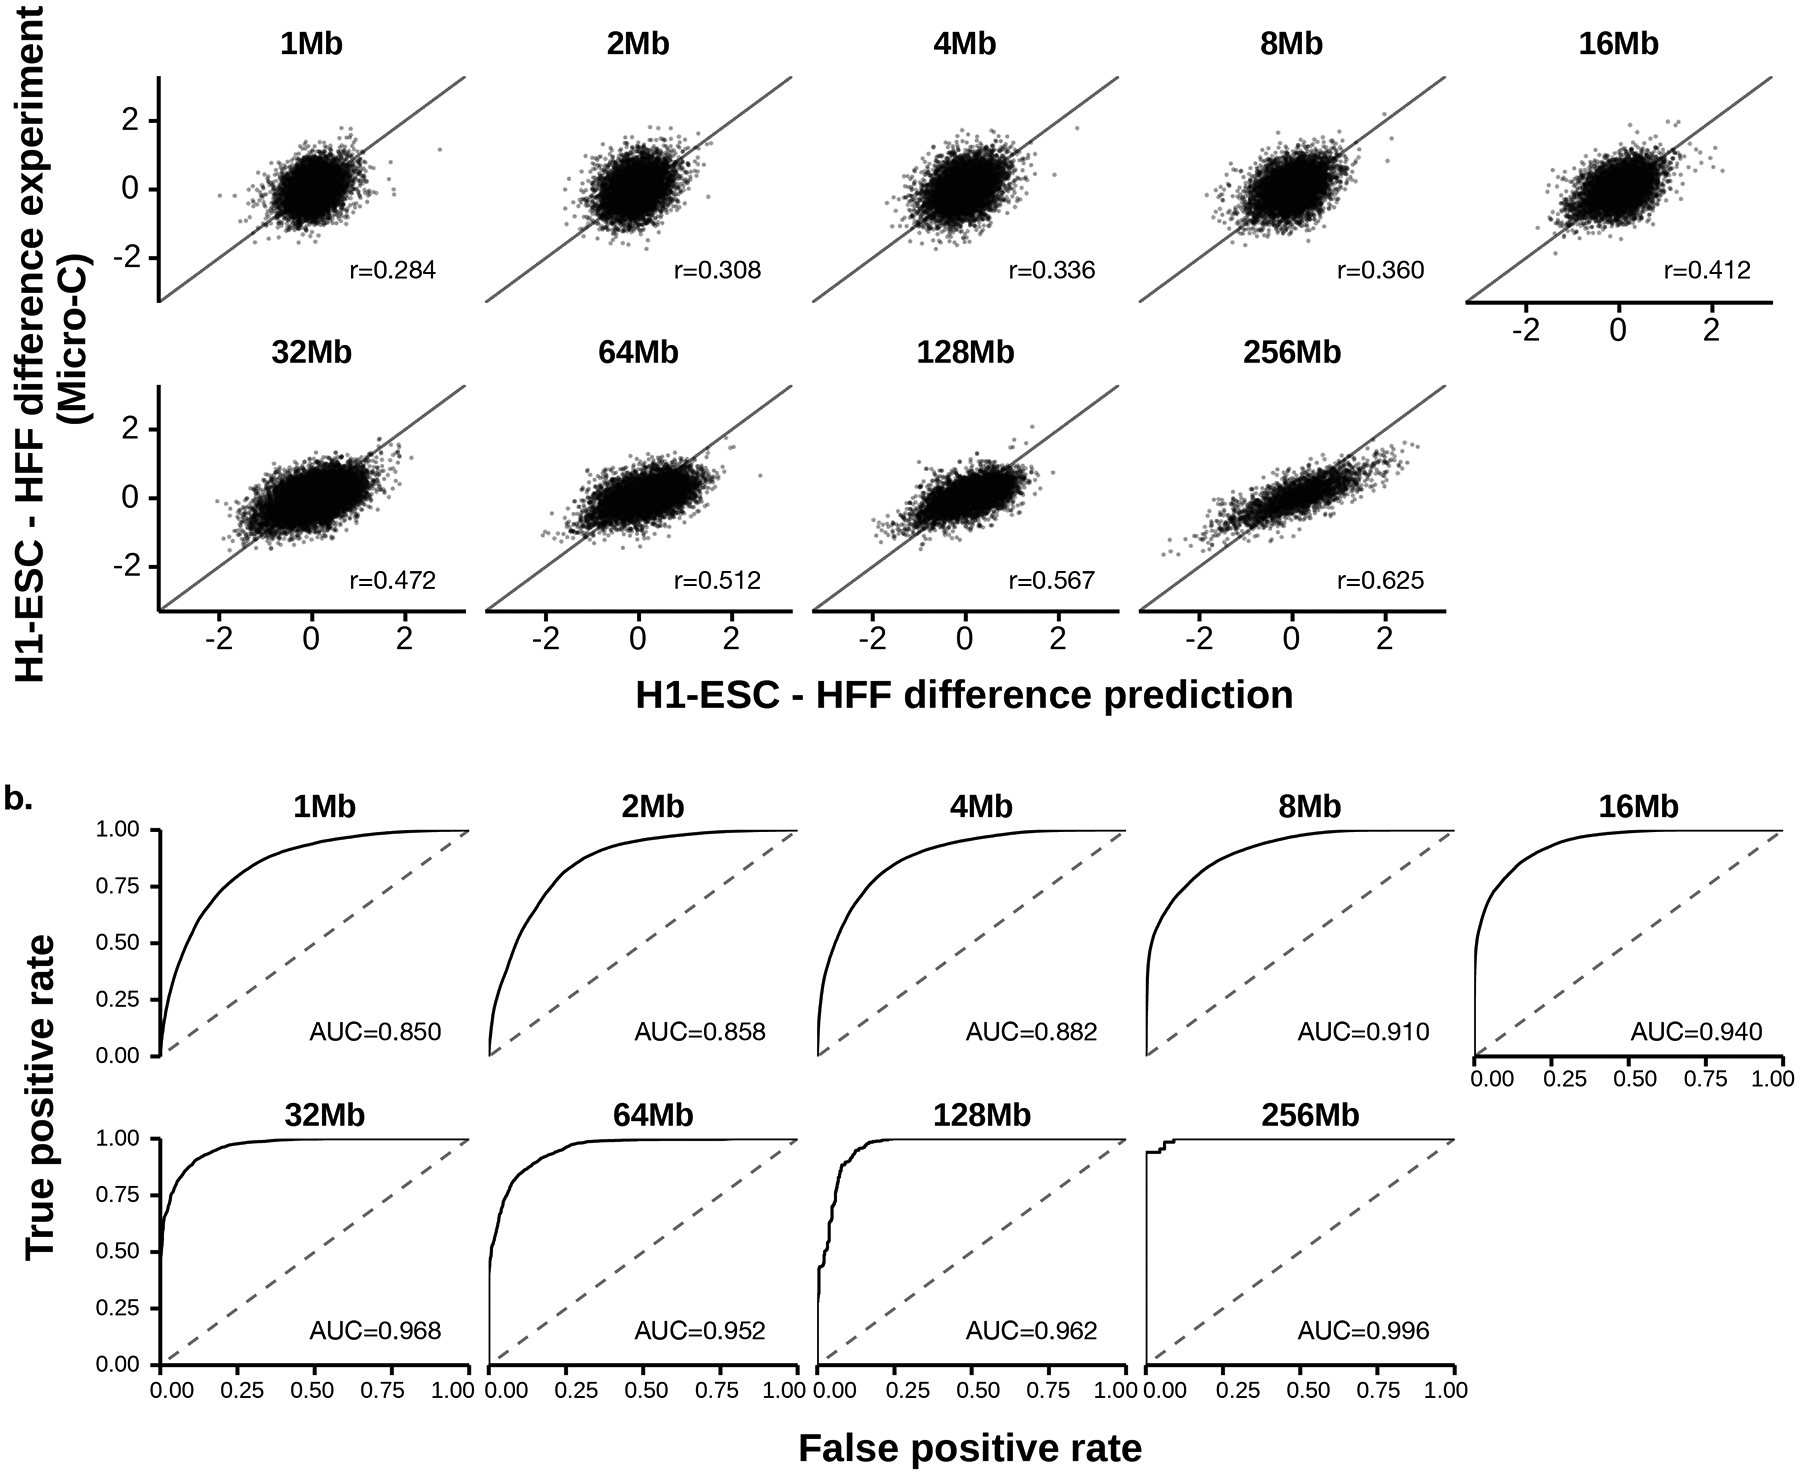
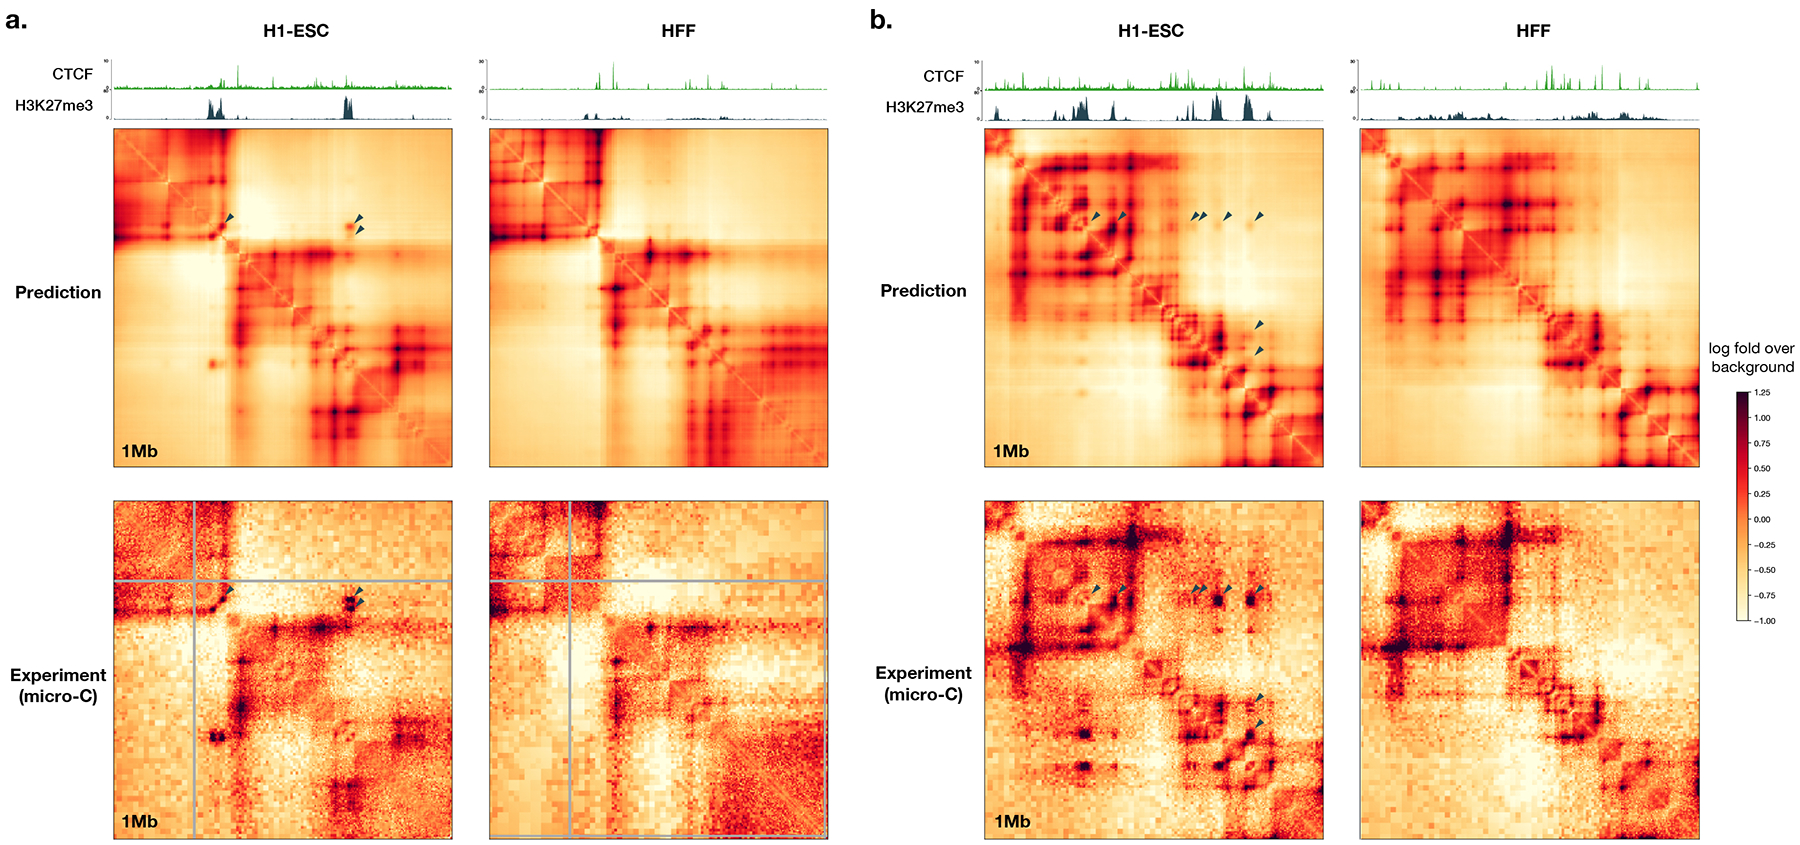
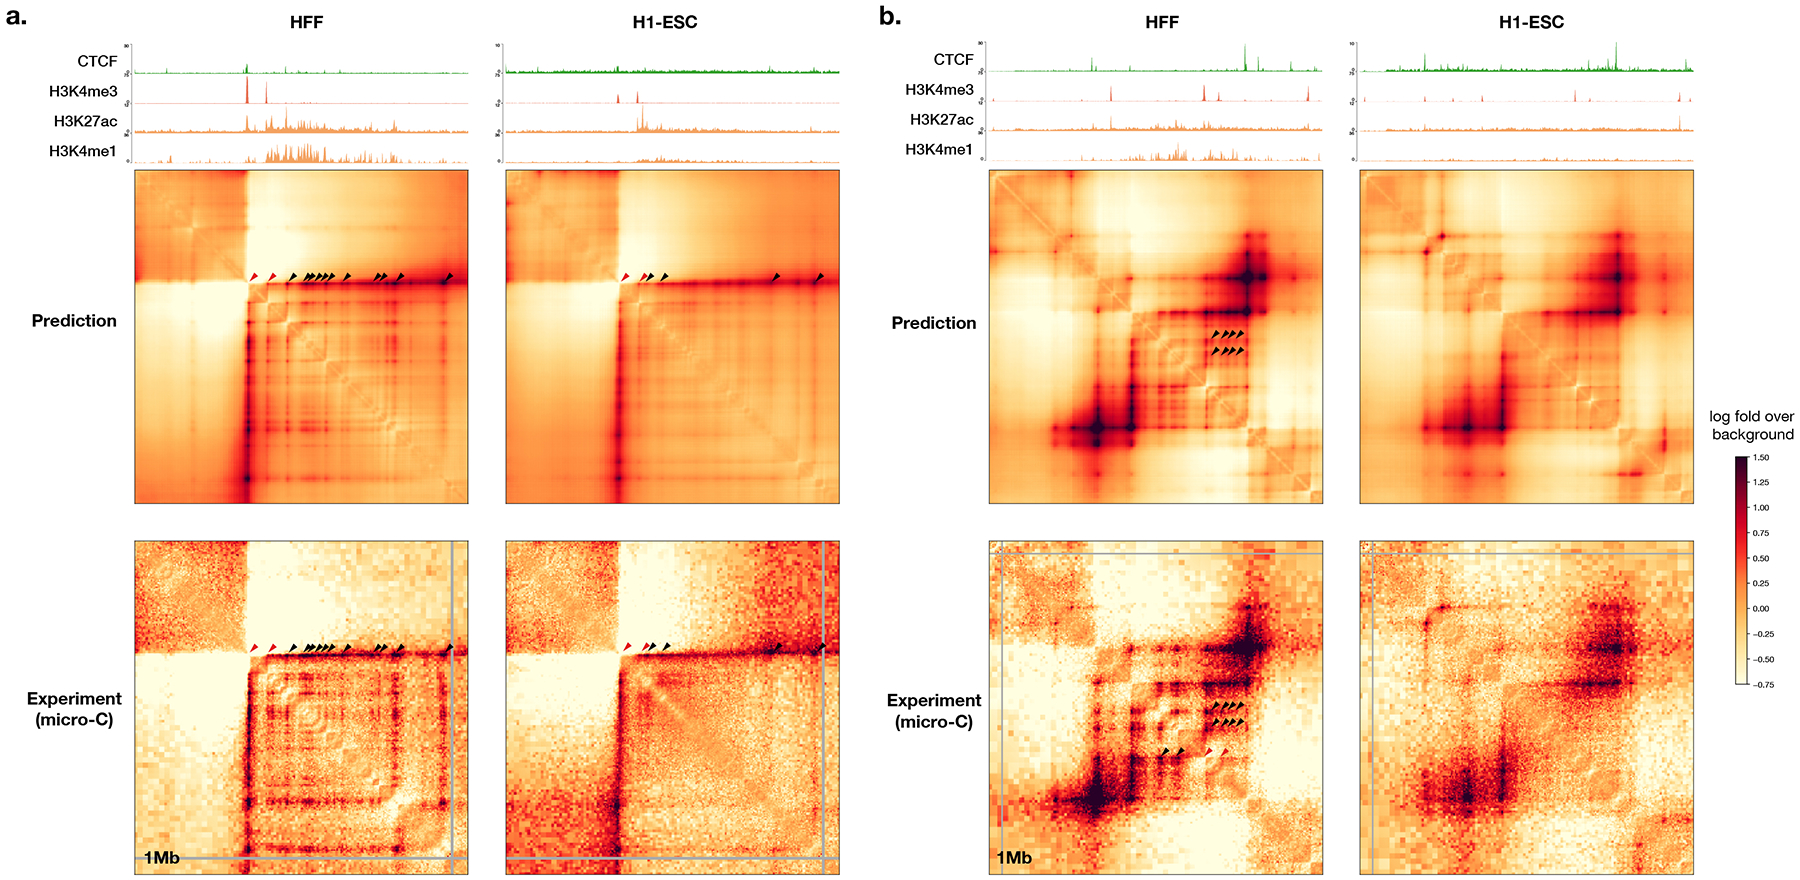
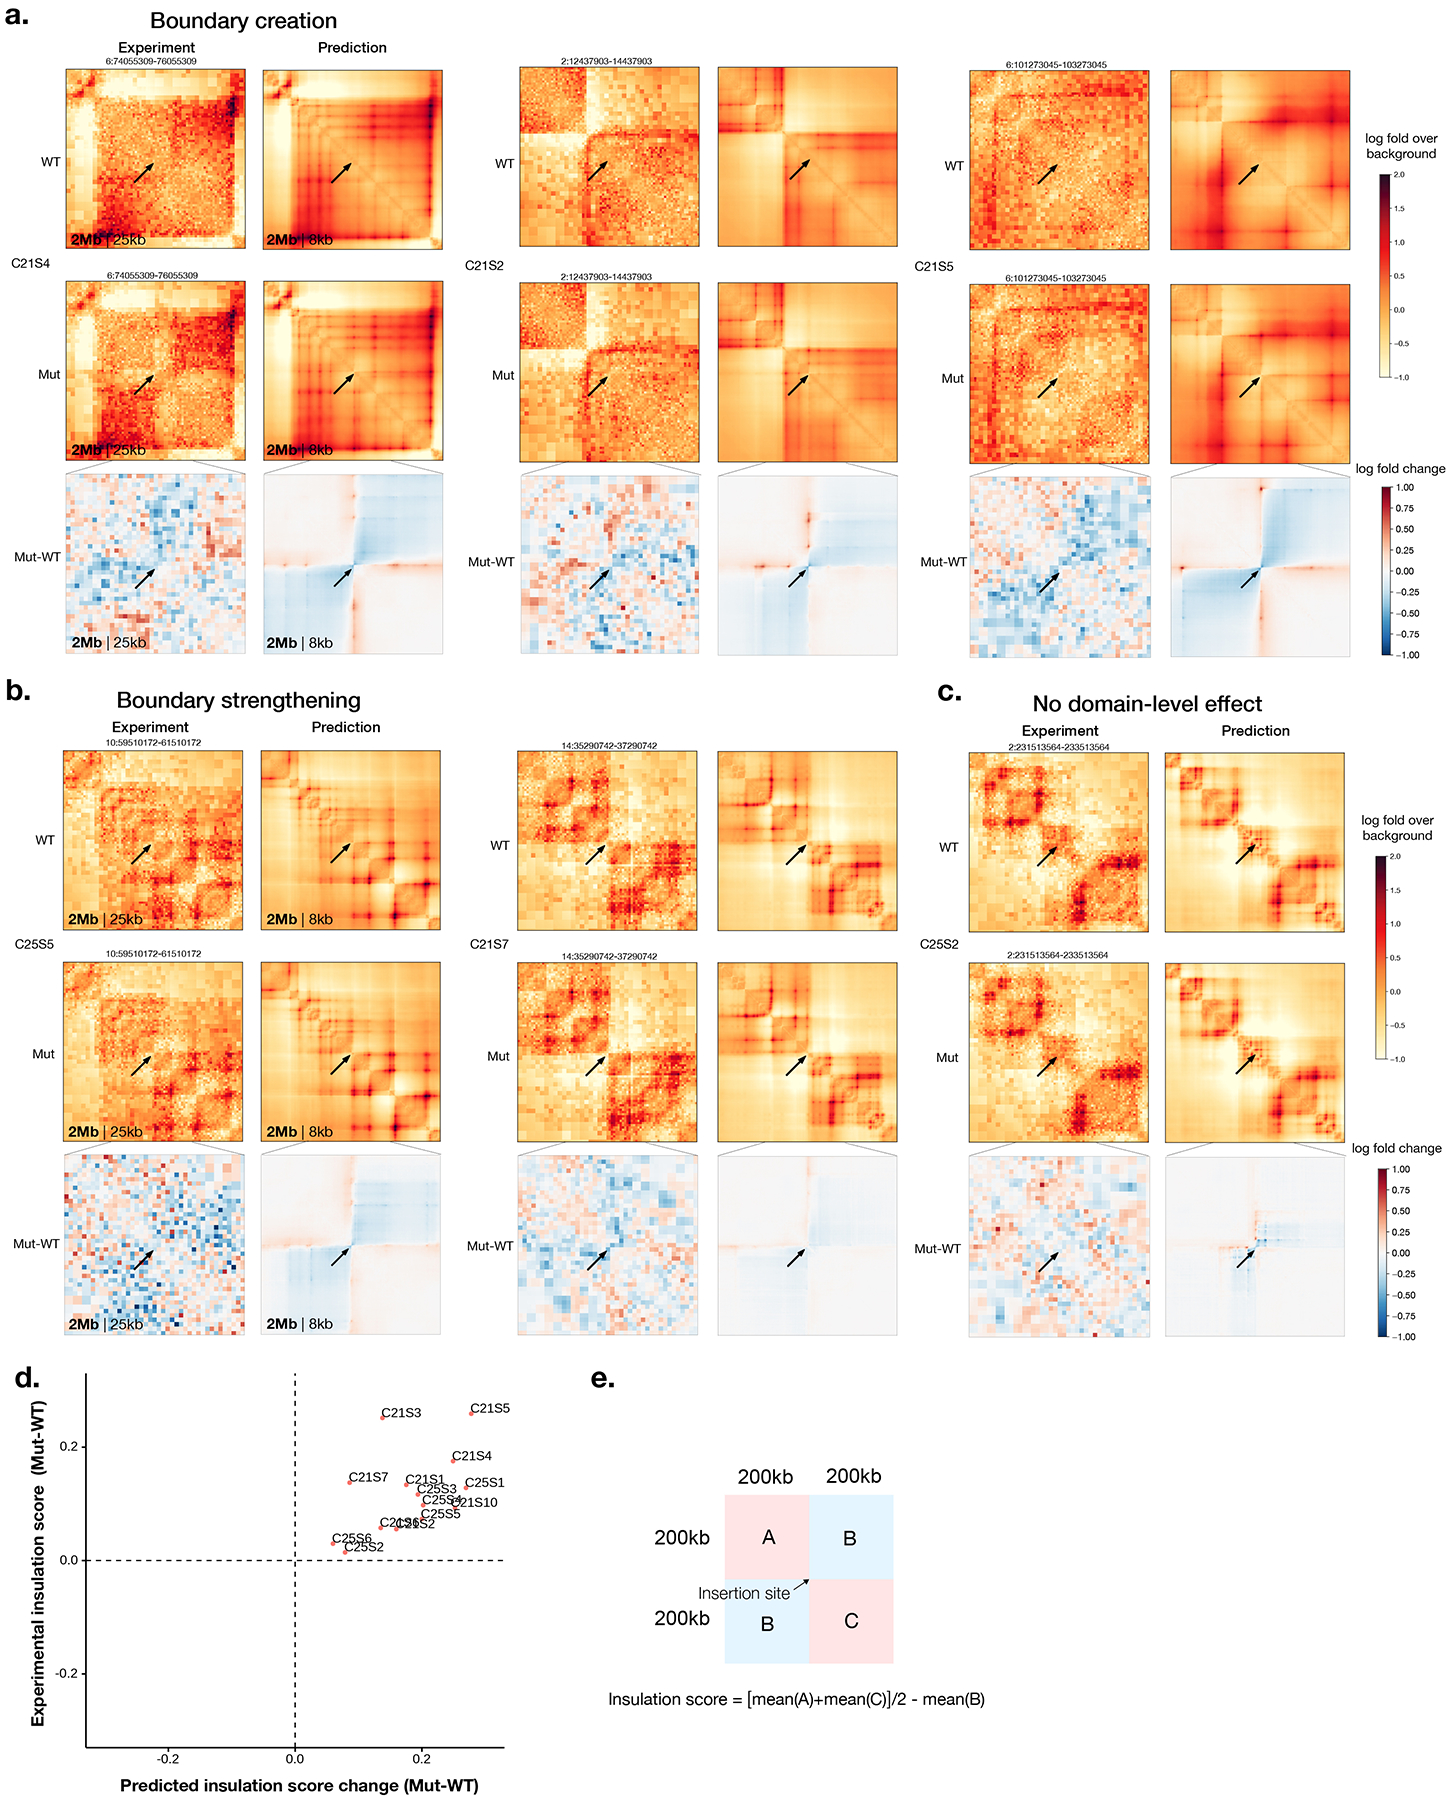
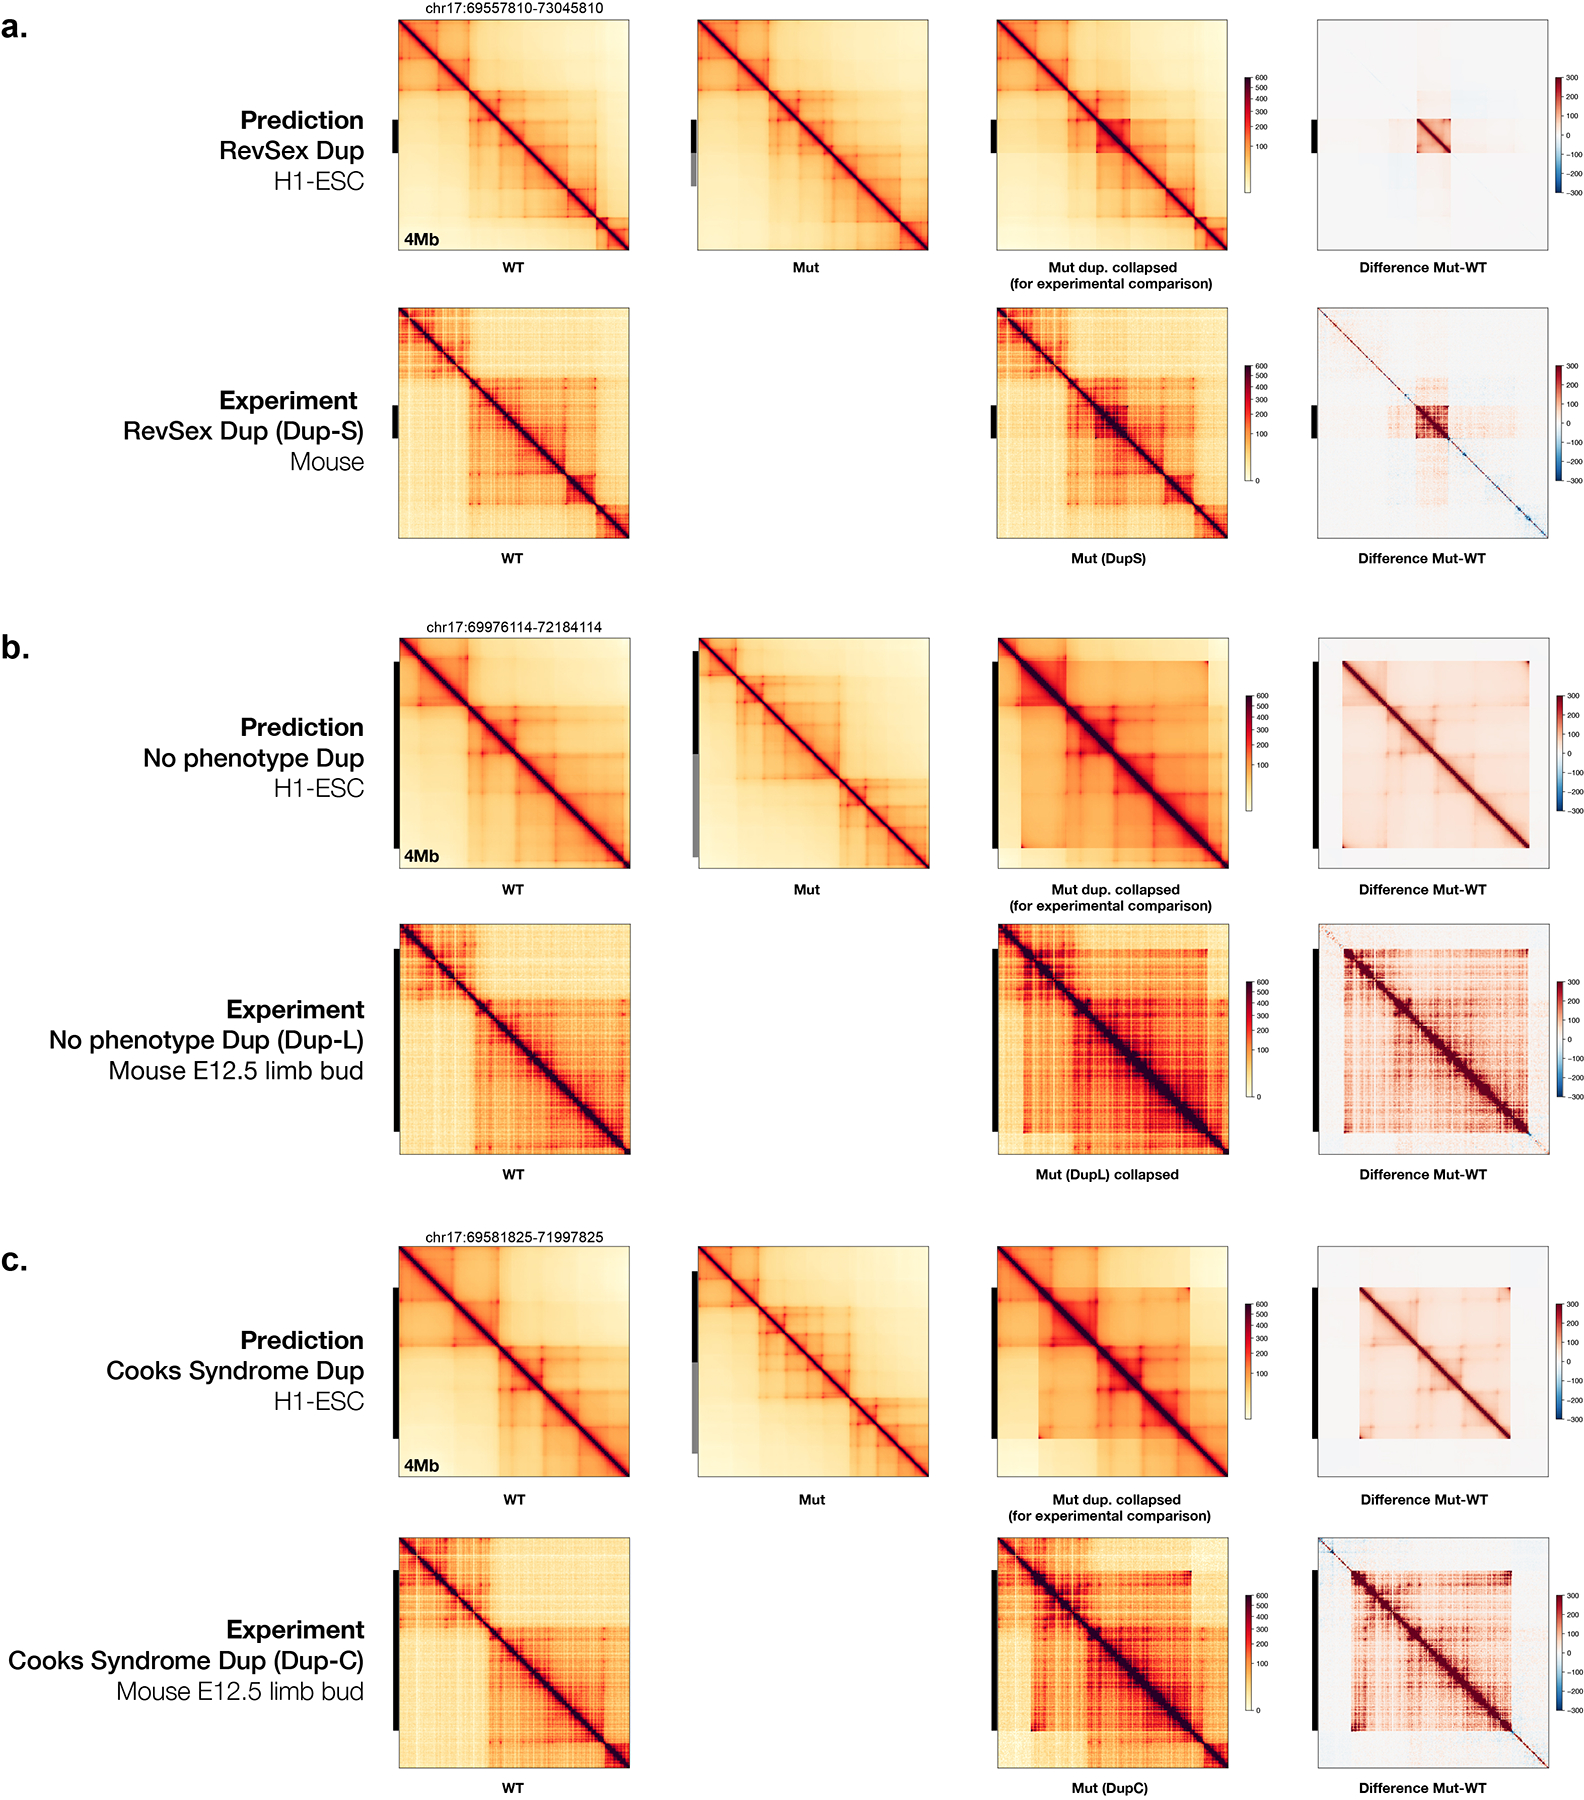
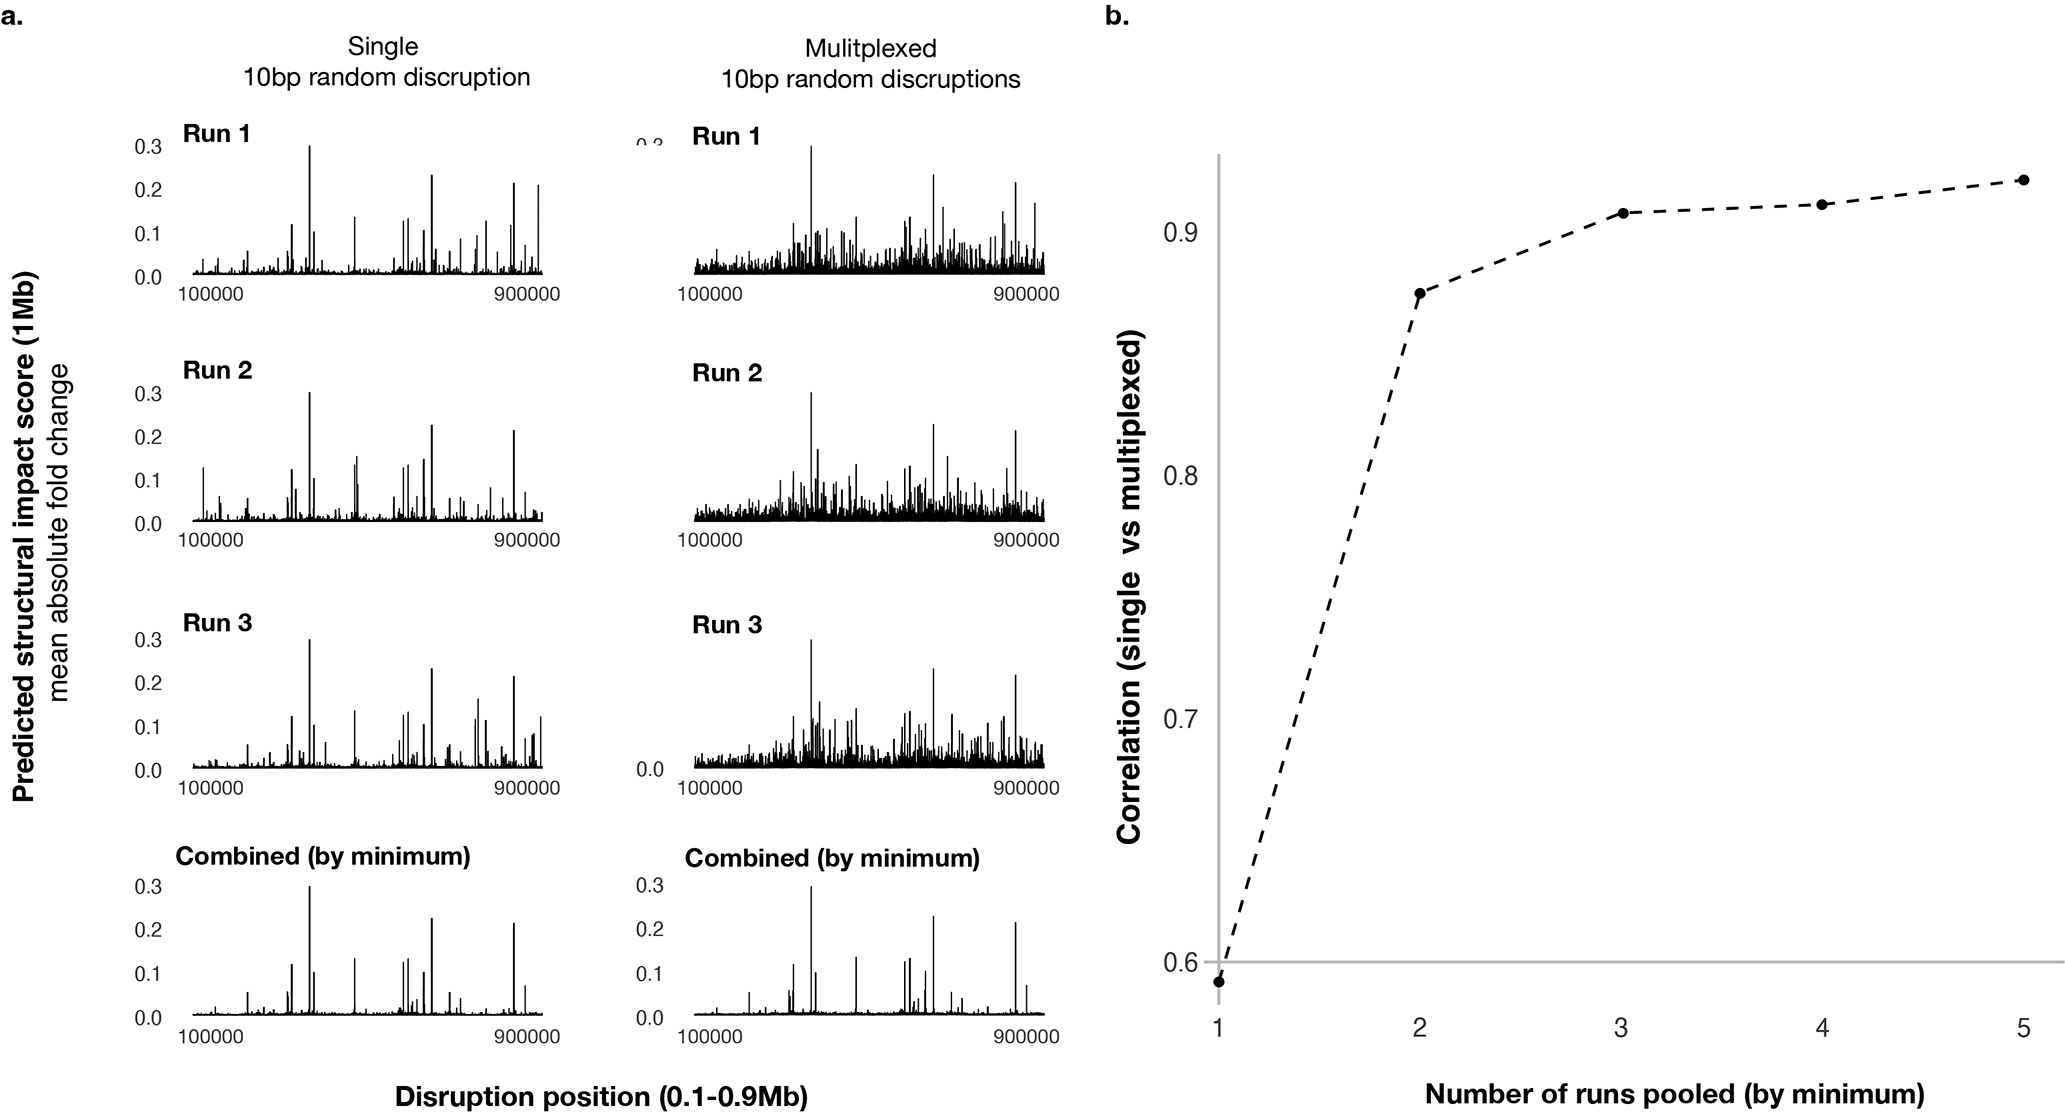
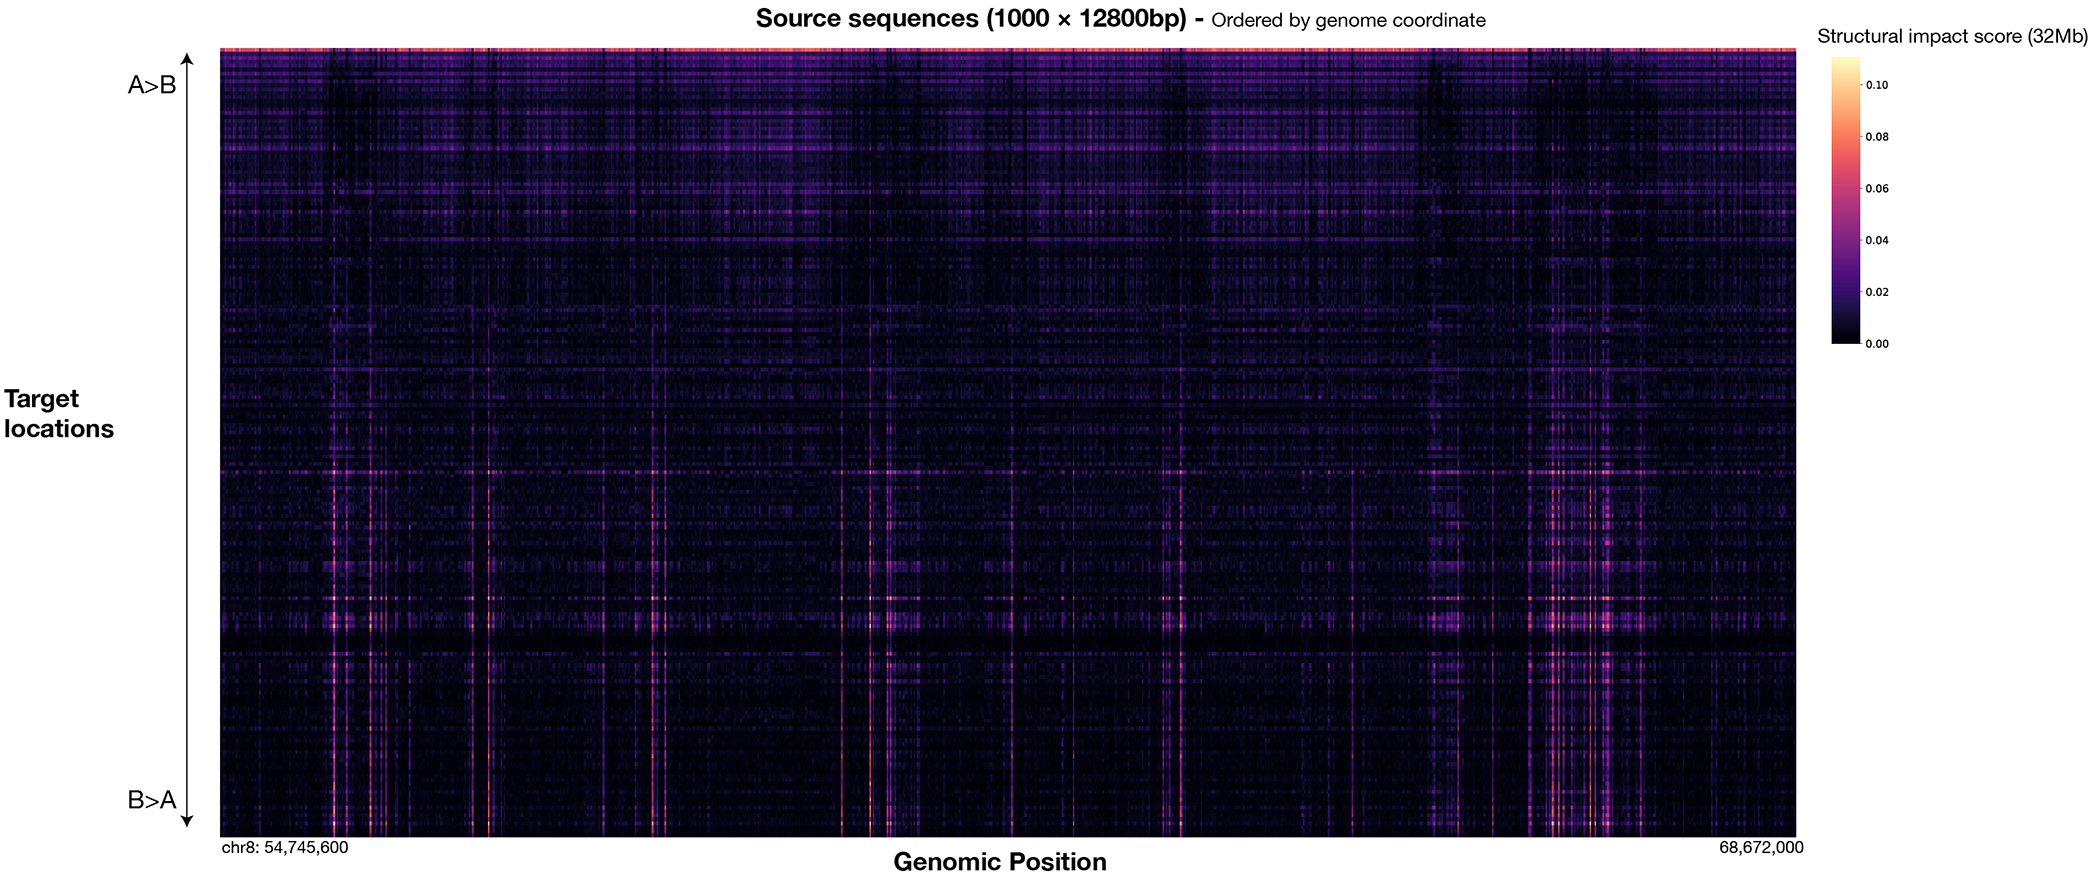
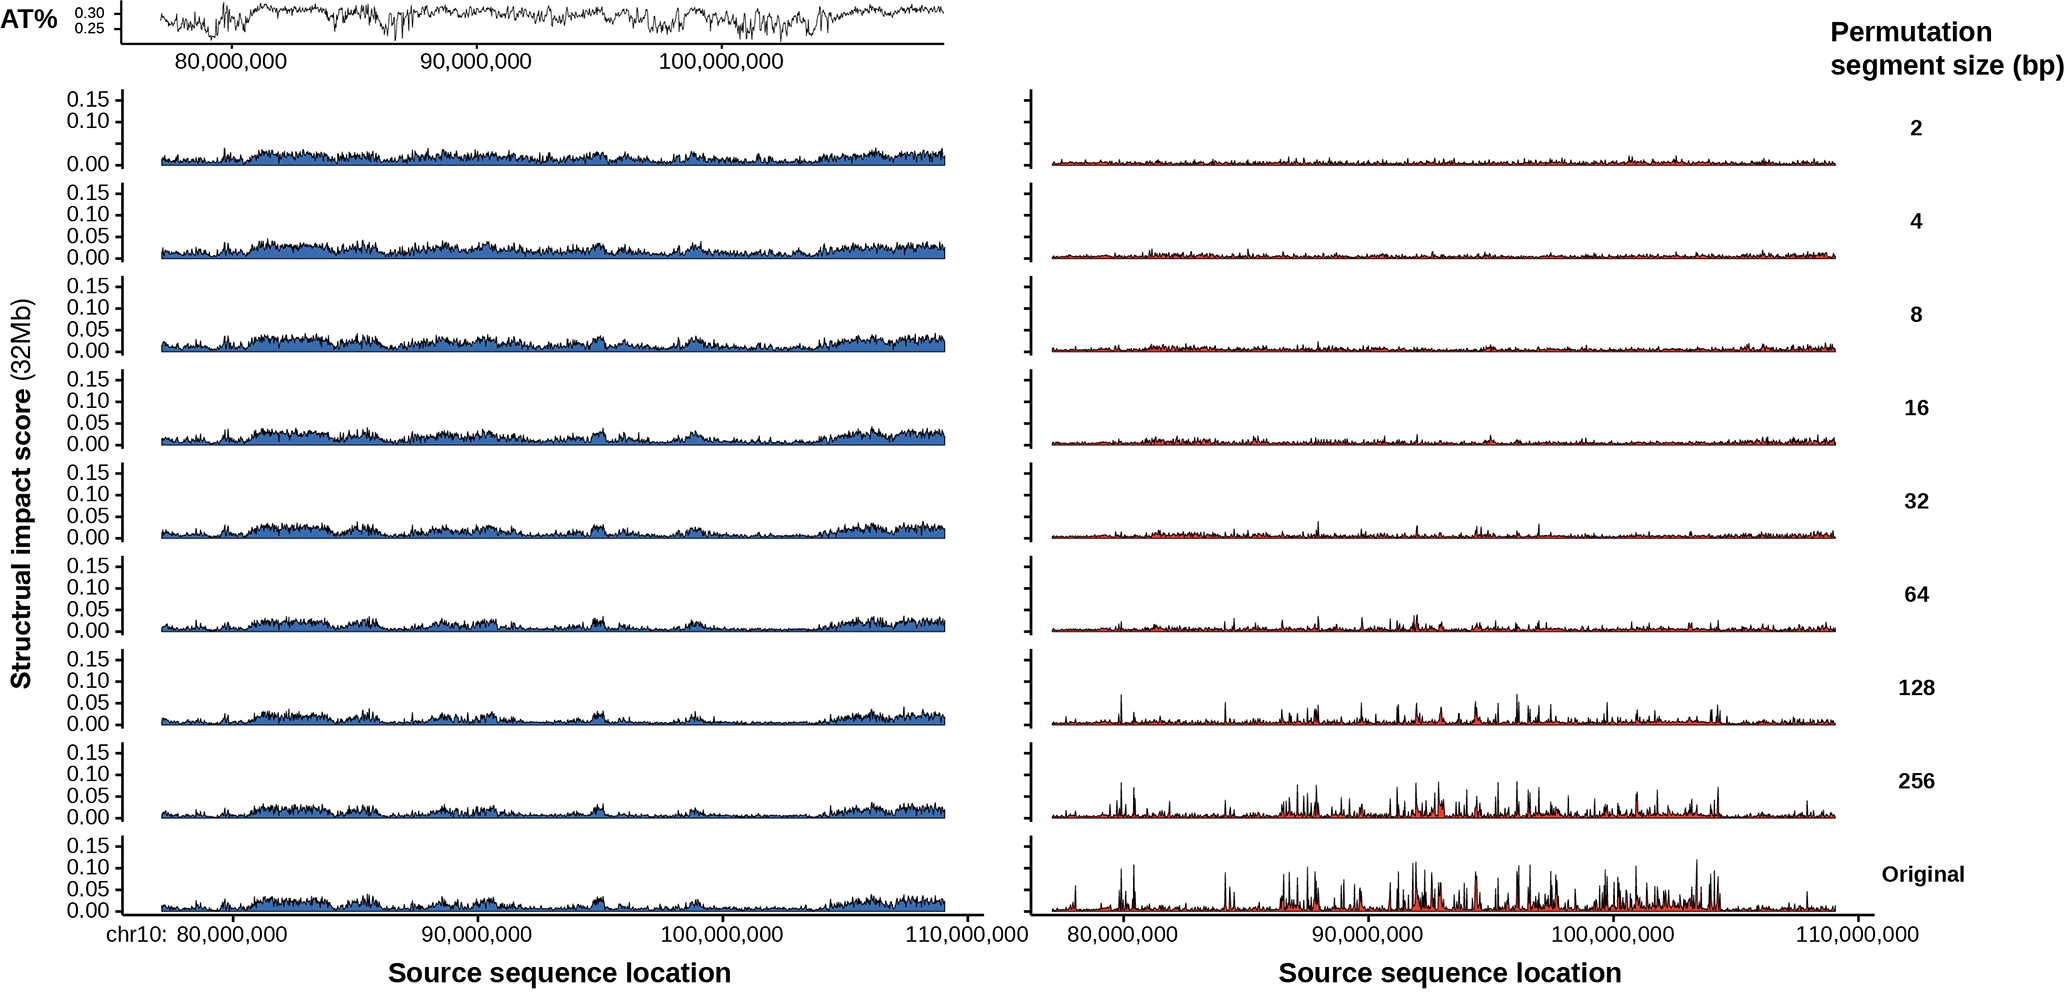
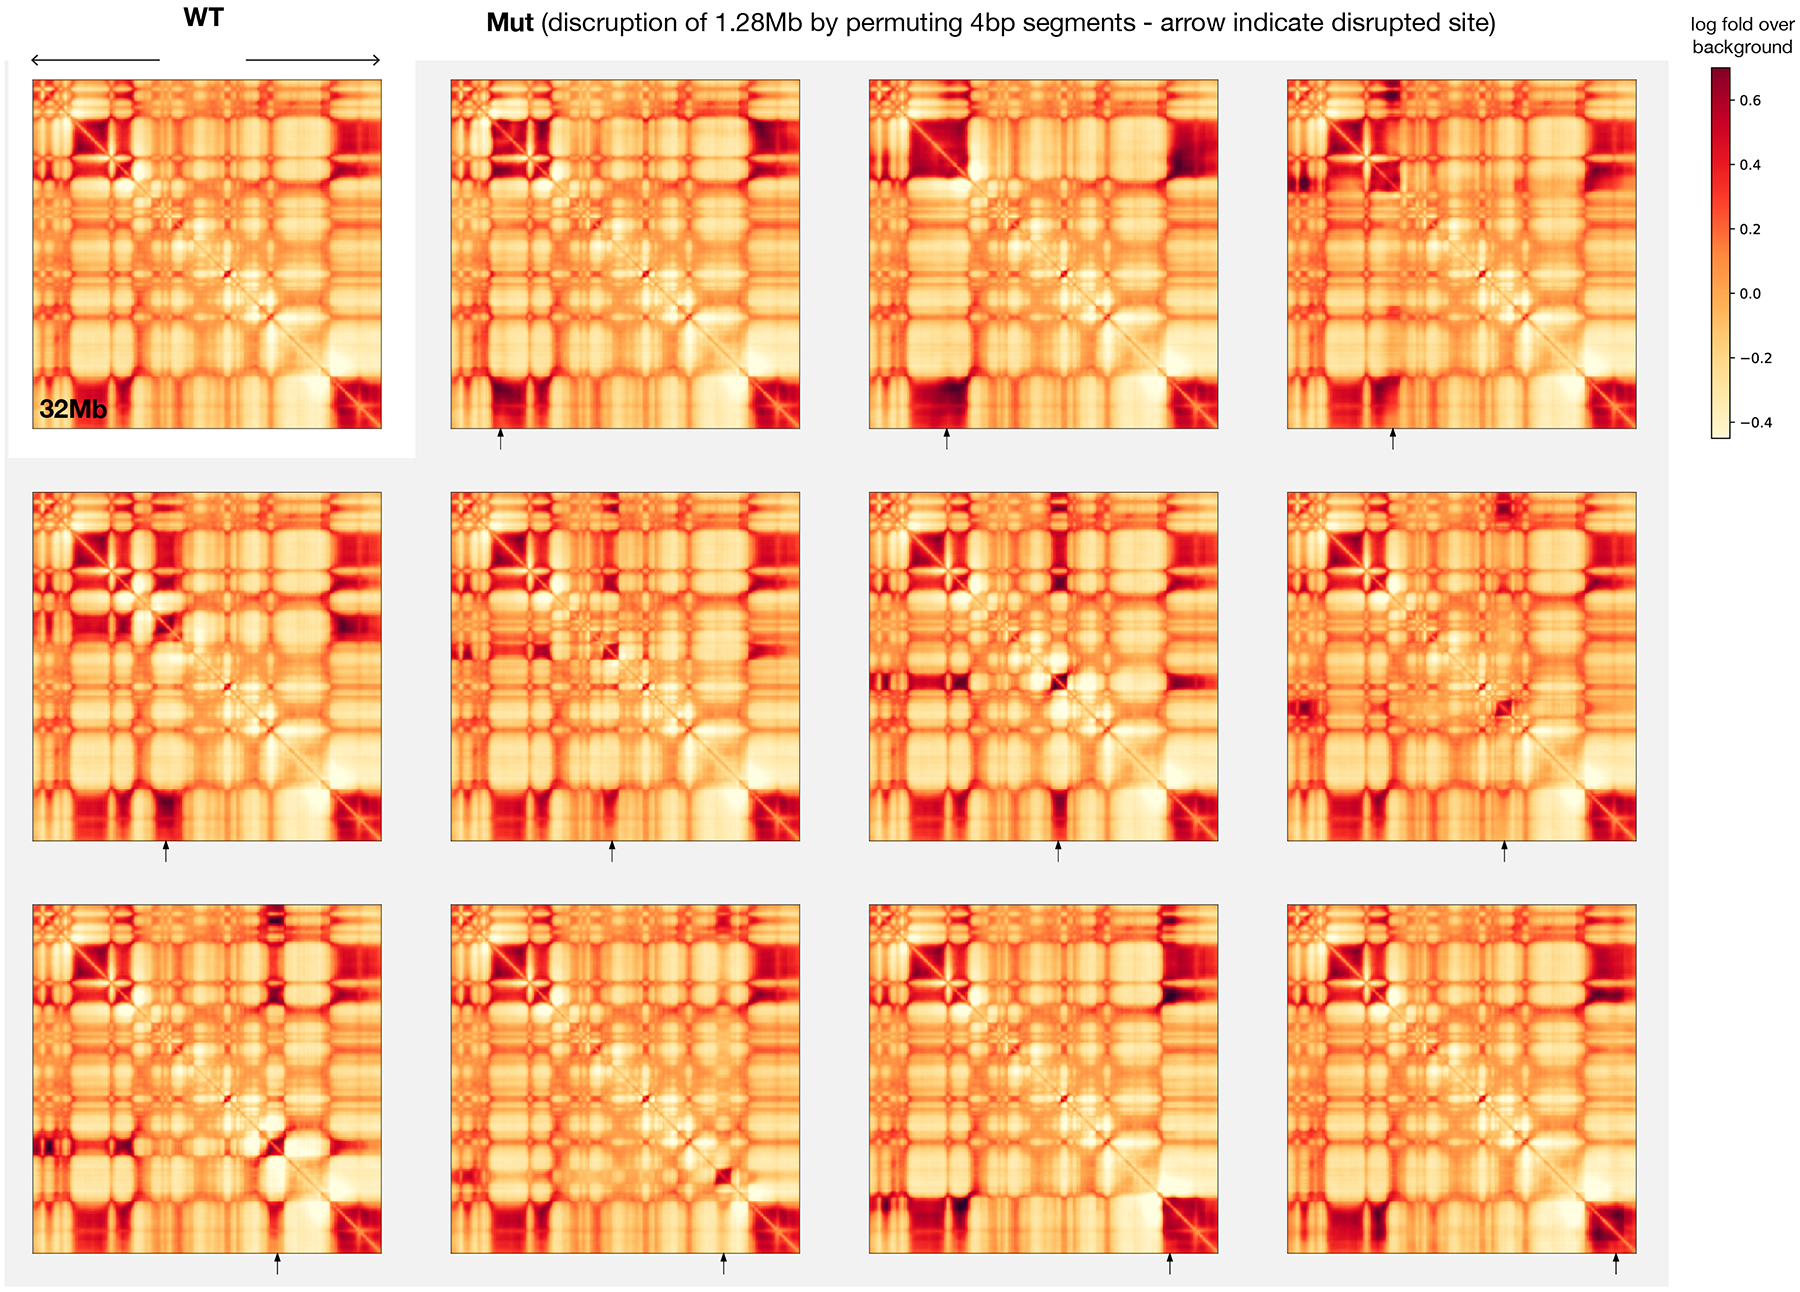
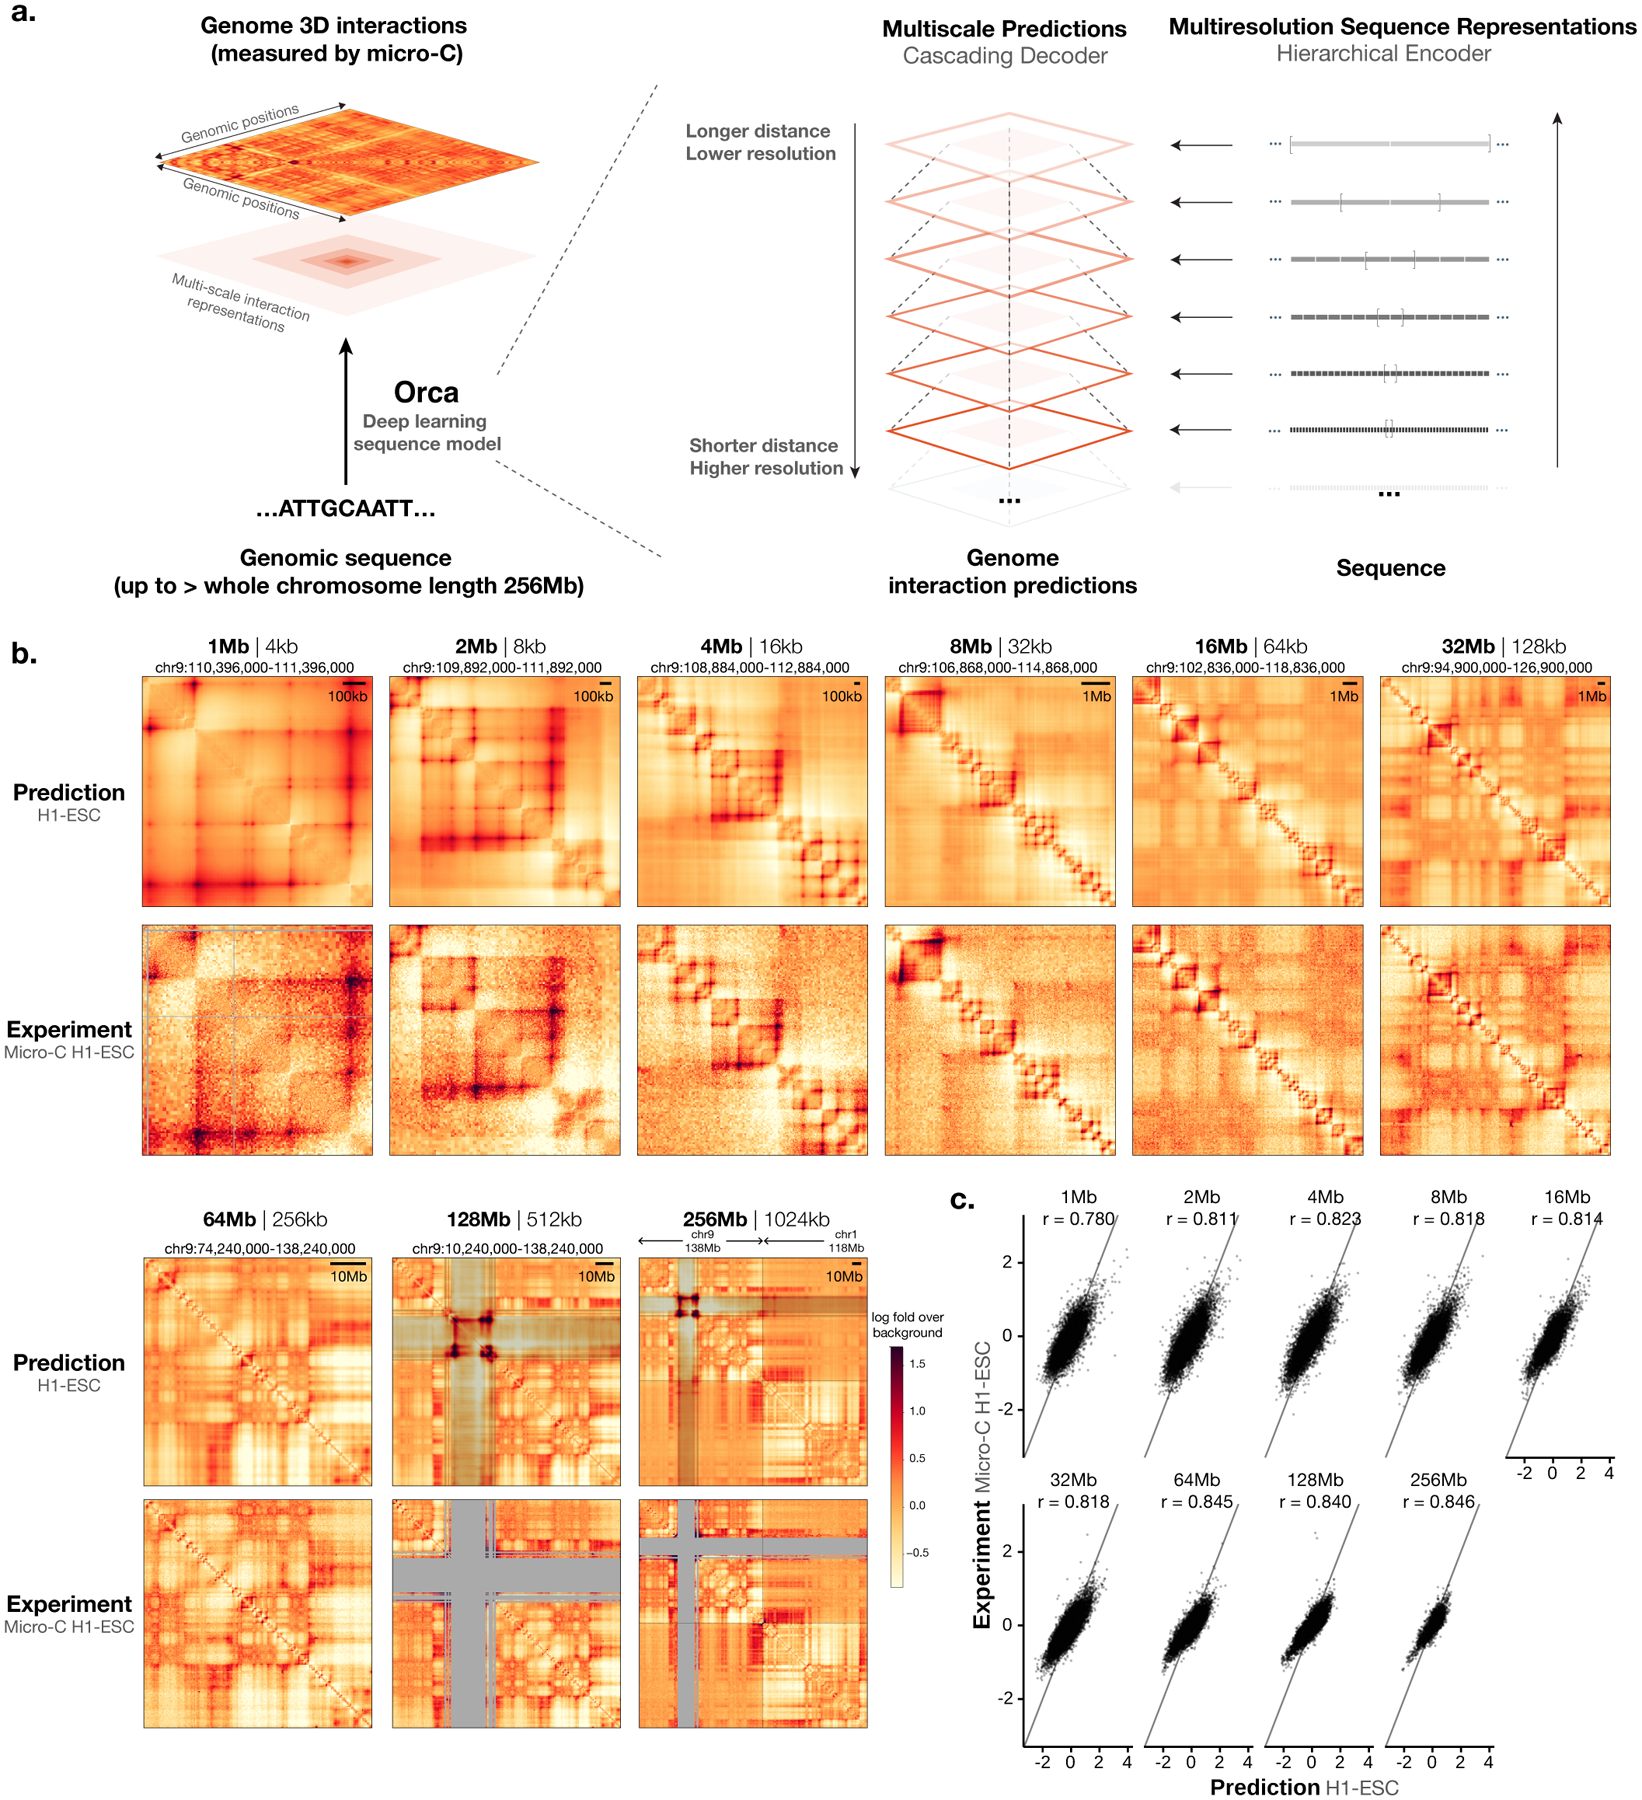
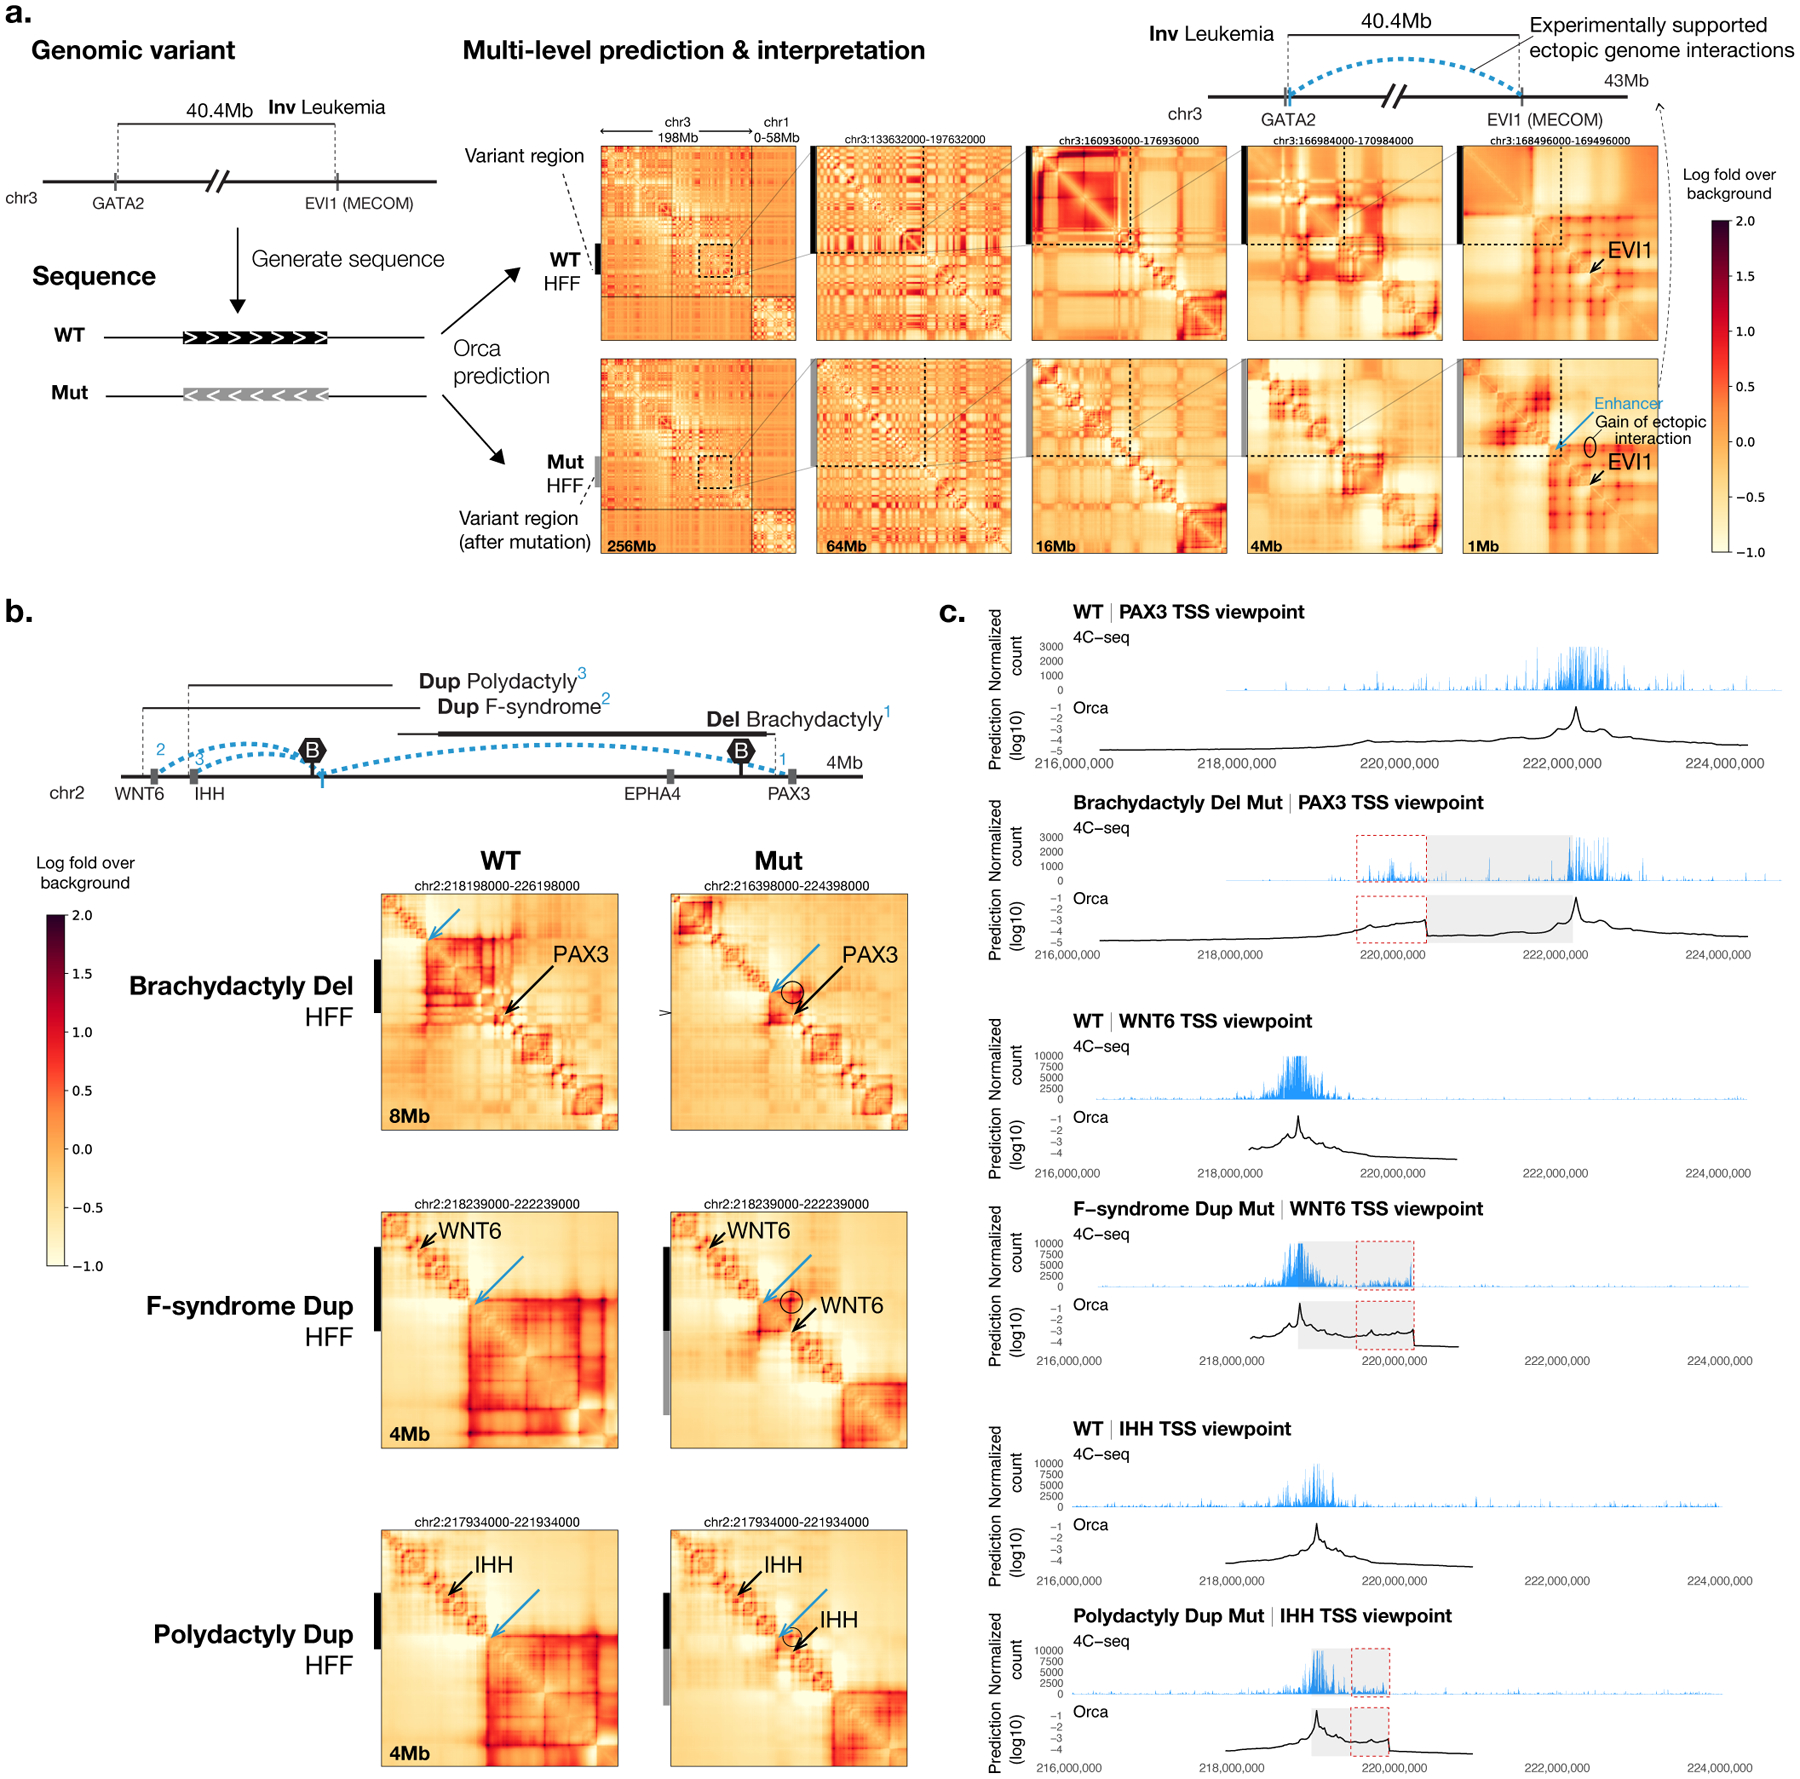
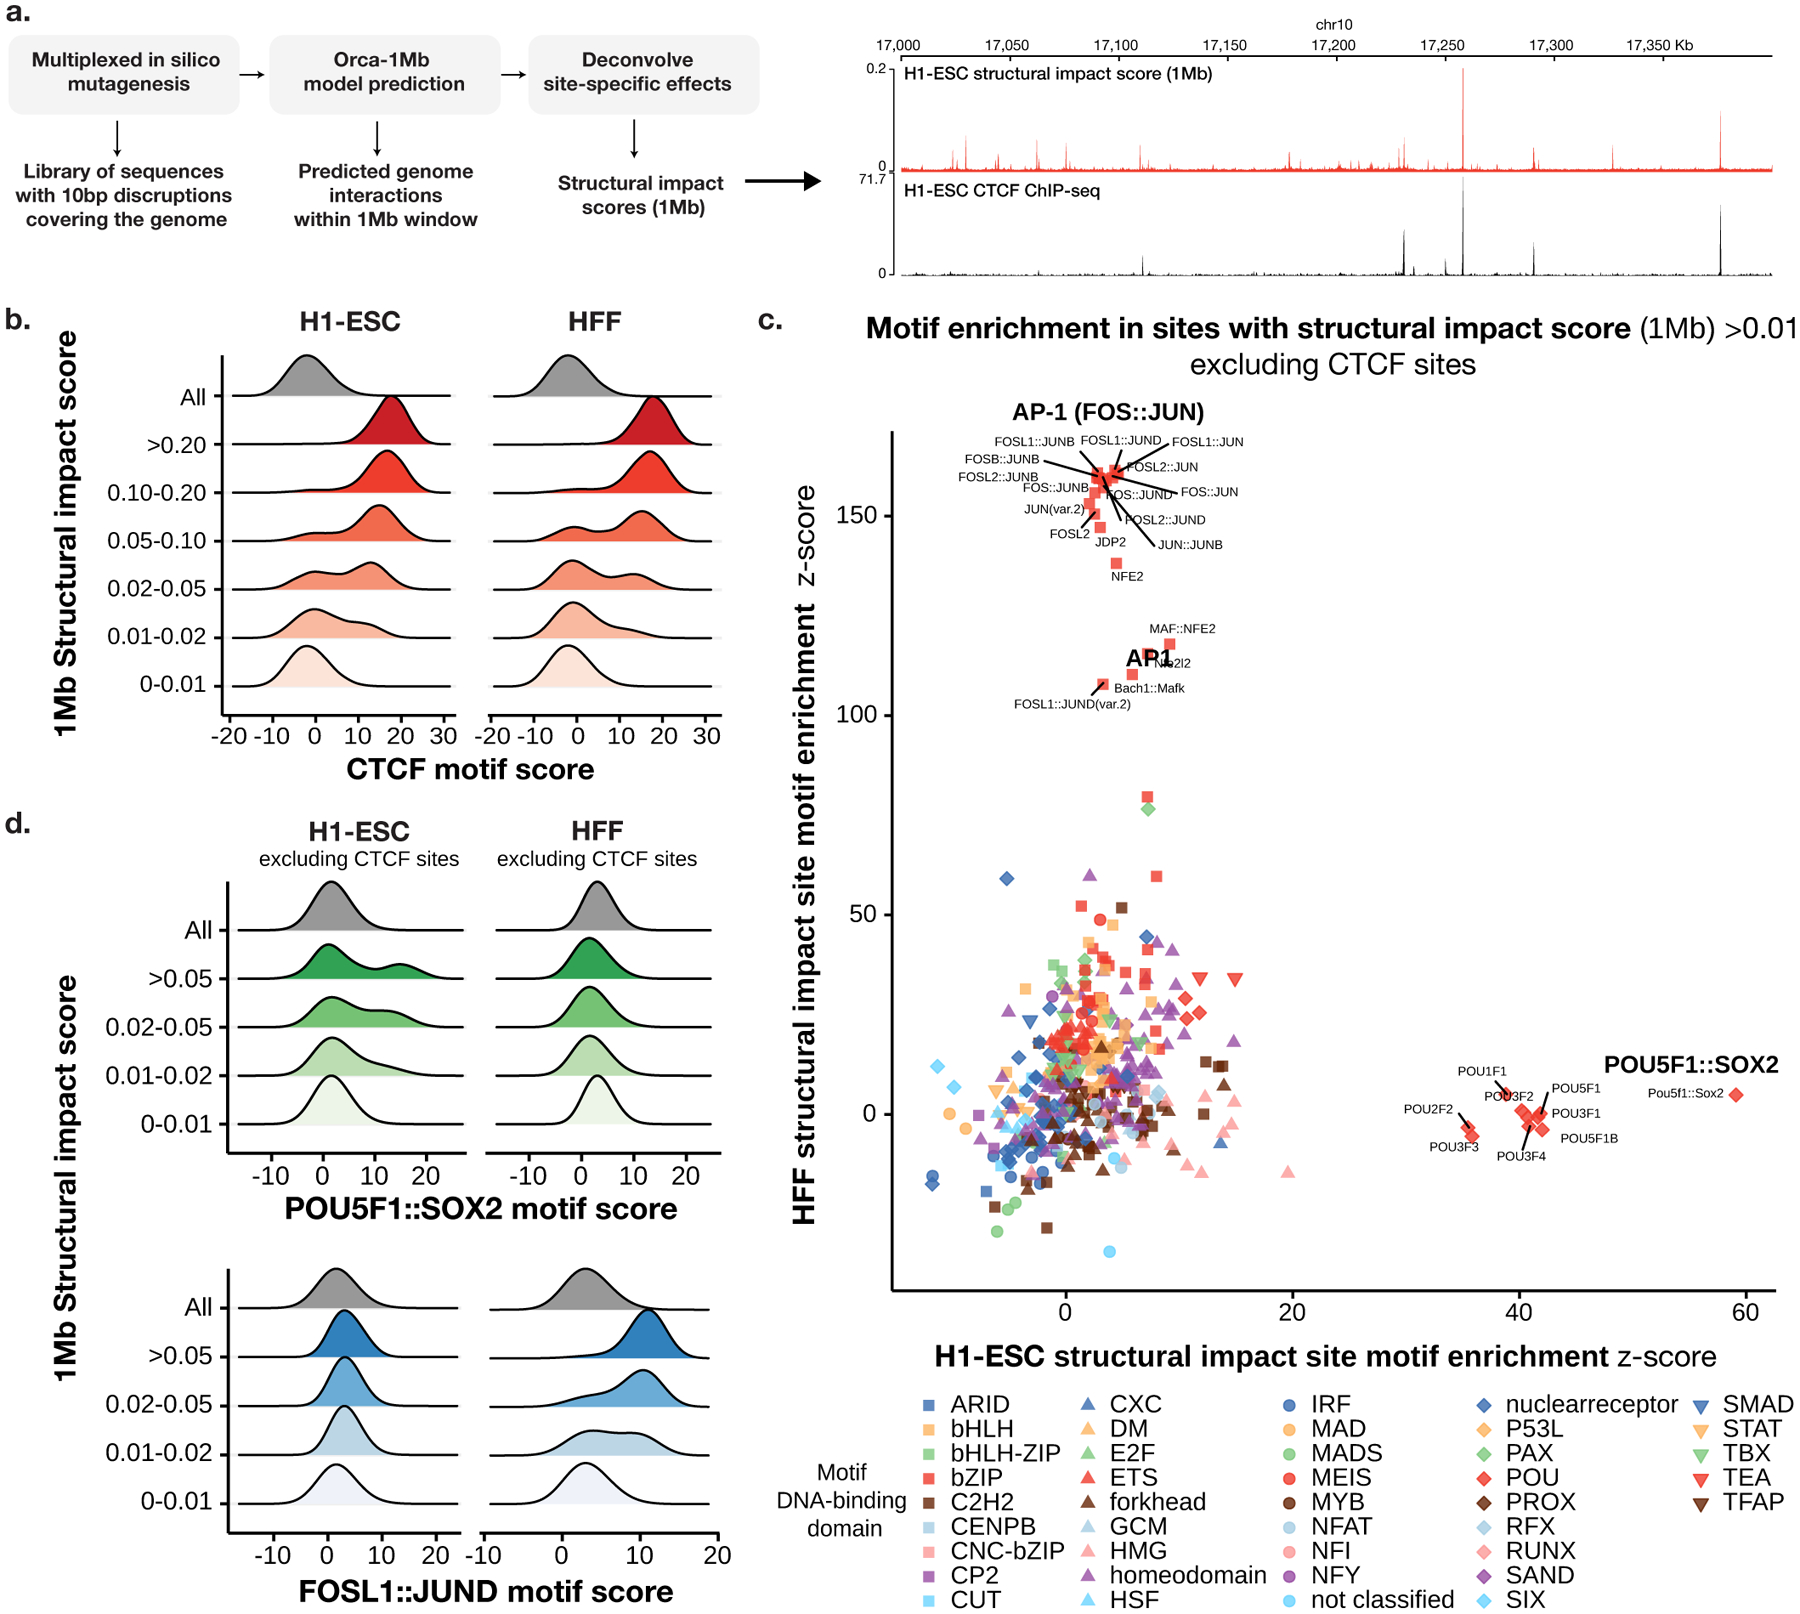
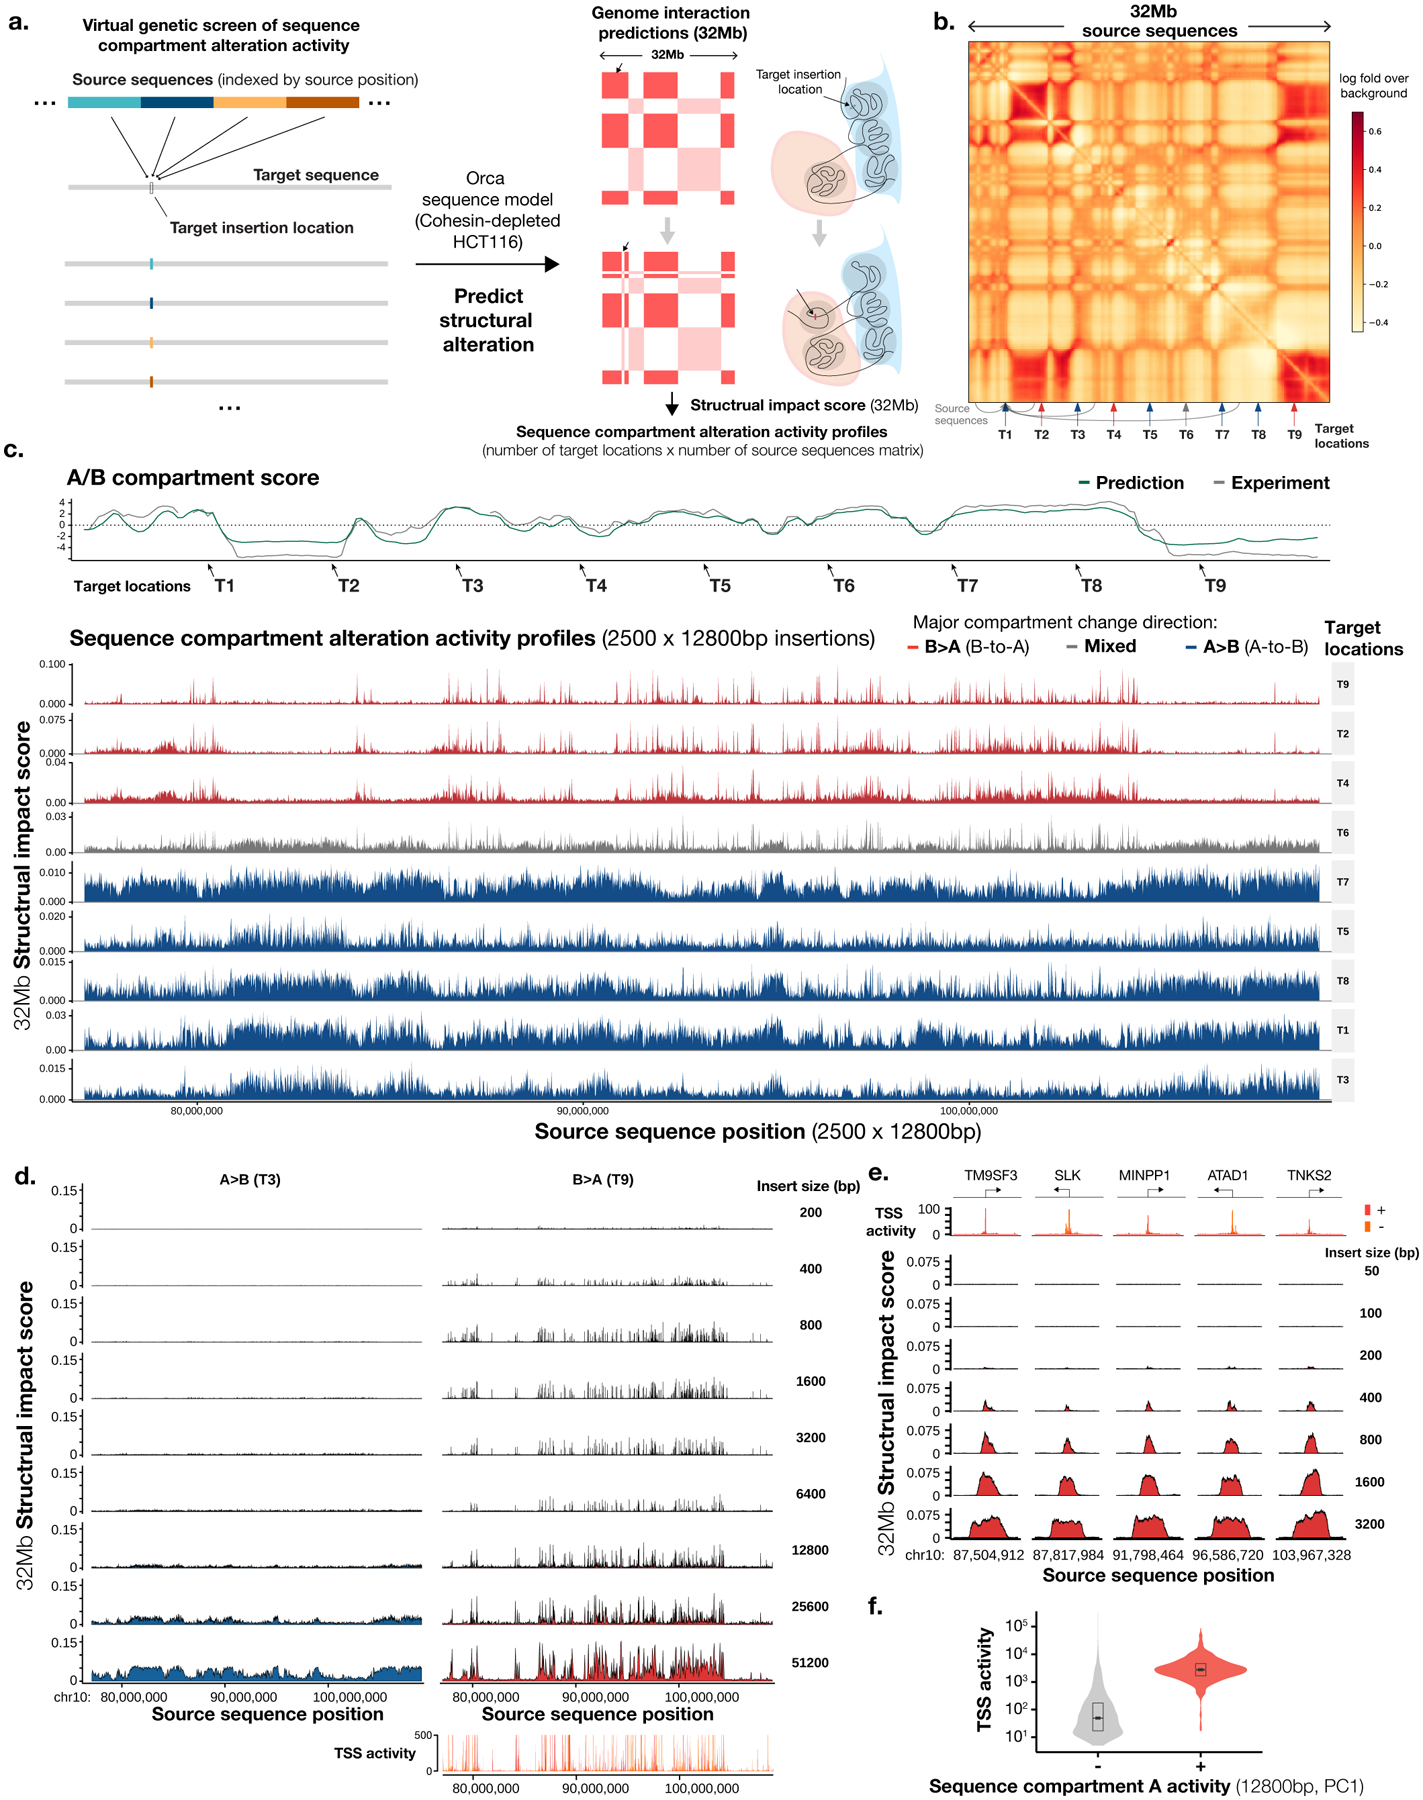
To learn how genomic sequence influences multiscale three-dimensional (3D) genome architecture, this manuscript presents a sequence-based deep-learning approach, Orca, that predicts directly from sequence the 3D genome architecture from kilobase to whole-chromosome scale. Orca captures the sequence dependencies of structures including chromatin compartments and topologically associating domains, as well as diverse types of interactions from CTCF-mediated to enhancer-promoter interactions and Polycomb-mediated interactions with cell-type specificity. Orca enables various applications including predicting structural variant effects on multiscale genome organization and it recapitulated effects of experimentally studied variants at varying sizes (300 bp to 90 Mb). Moreover, Orca enables in silico virtual screens to probe the sequence basis of 3D genome organization at different scales. At the submegabase scale, it predicted specific transcription factor motifs underlying cell-type-specific genome interactions. At the compartment scale, virtual screens of sequence activities suggest a model for the sequence basis of chromatin compartments with a prominent role of transcription start sites.


Conflict of interest statement

Competing Interests

The author declares no competing interests.

Figures

Extended Data Fig. 1
Extended Data Fig. 1. Performance of Orca model predictions for the HFF cell type.
a). A multiscale sequence-based prediction example zooming from whole-chromosome into a position on a holdout test chromosome. Predictions from 1–256Mb scales are compared with micro-C experimental observations. Missing values in micro-C data are shown in gray, and these regions are also indicated in the 64–256Mb prediction heatmaps because predictions at major assembly gaps or unmappable regions are of unknown accuracy. The genome interactions are represented by the log fold over genomic-distance-based background scores for both prediction and experimental data. b). Scatter plot comparison of the predicted interaction scores with the micro-C measured interaction scores (log fold over background) on the holdout test chromosomes. 10,000 randomly subsampled scores are shown in each panel. The overall Pearson correlations across the entire test chromosomes are annotated. The genome interactions are represented by the log fold over background scores for both prediction and experimental data. Predictions for 1–32Mb levels are from the Orca-32Mb model and 64–256Mb levels are from the Orca-256Mb model.
Extended Data Fig. 2
Extended Data Fig. 2. Performance of Orca model predictions for cross-cell-type genome interaction difference.
a). Scatter plot comparison of the predicted cell type differences of genome interactions (HFF - H1-ESC) with the micro-C measured interaction score differences on the holdout chromosomes. 10,000 randomly subsampled scores are shown in each panel. The overall Pearson correlations across the entire test chromosomes are annotated. The genome interactions are represented by the log fold over genomic-distance-based background scores for both prediction and experimental data. b). Prediction performance for position pairs with the strongest absolute log-fold differences between the two cell types (top 1 percentile). The performance of models predicting the cell type labels (the cell type with stronger interaction) is measured by receiver operating characteristic (ROC) curve. The area under the ROC curve (AUROC) is annotated. The AUROC score can be interpreted as the probability of a randomly selected positive example (i.e. stronger in HFF) being ranked higher than a randomly selected example (i.e. stronger in H1-ESC). Predictions for 1–32Mb levels are from the Orca-32Mb models and 64–256Mb levels are from the Orca-256Mb models.
Extended Data Fig. 3
Extended Data Fig. 3. Example Orca predictions of Polycomb-mediated interactions.
Predicted and observed H1-ESC and HFF genome interactions for two regions from a holdout chromosome, a). chr10:116850000-117850000 and b). chr10:100450000-101450000 are shown. The predicted and observed Polycomb-mediated interactions are marked with black triangles. ChIP-seq signal tracks for CTCF and H3K27me3 for the two cell types are also shown. Polycomb-mediated interactions are predicted to be specific to H1-ESC in both examples, consistent with experimental micro-C and ChIP-seq data.
Extended Data Fig. 4
Extended Data Fig. 4. Example Orca predictions of promoter-enhancer interactions.
Predicted and observed H1-ESC and HFF genome interactions for two regions from holdout chromosomes, a) chr8:127400000-128400000 and b) chr9:94360000-95360000 are shown. The predicted and observed enhancer-promoter interactions are marked (promoter positions or promoter-promoter interactions are marked with red triangles, enhancer-promoter or enhancer-enhancer interactions are marked with black triangles; we only marked a subset of all interactions observed). ChIP-seq signal tracks for CTCF and H3K4me3, H3K27ac, and H3K4me1 for the two cell types are also shown. The predicted enhancer-promoter interactions are consistent with micro-C observations and enhancer histone mark signal from ChIP-seq data.
Extended Data Fig. 5
Extended Data Fig. 5. Visualized predictions of transposon-mediated boundary element insertion effects in multiple insertion sites
All insertions with previously categorized effects (boundary creation, boundary strengthening, and no domain-level effect) in Zhang et al. are shown. The experimental measurements by in situ Hi-C in HAP1 cell is compared with H1-ESC model predictions. The genome interactions are represented by the log fold over genomic-distance-based background scores for both prediction and experimental data. Arrows indicate the insertion sites. The genome coordinates are in hg19.
Extended Data Fig. 6
Extended Data Fig. 6. Comparison of Orca prediction with Capture Hi-C experimental measurement for structural variants from Franke et al. 2016.
Capture Hi-C data from mouse with SVs are compared with predictions for effects of equivalent human structural variants. Predicted log fold over background at 4Mb level are scaled with the distance-expectation curve from capture Hi-C.
Extended Data Fig. 7
Extended Data Fig. 7. Multiplexed in silico mutagenesis screen results are highly correlated with single-mutation in silico mutagenesis screen results.
a). Predicted structural impact scores (1Mb) of single disruptions (left) and multiplexed disruptions are shown on the y-axis, with disruption positions on the x-axis. 10bp disruption sites screened cover the center 0.8Mb of the 1Mb region. The first three rows are three independent runs (for single disruption only the disrupted sequences are random across the runs, and for multiplexed disruption both the multiplex design of disruption sites and the disrupted sequences are random), and the last row shows the minimum of the three at each position. b). Relationship between the correlation of single and multiplexed disruption profiles (y-axis) and the number of runs combined (x-axis).
Extended Data Fig. 8
Extended Data Fig. 8. Visualization of virtual screen sequence activity on chromatin compartment alteration.
A subset of 1000 contiguous source sequences among all 27981 12800bp source sequences covering chr8, 9, and 10 are shown. Target locations are ordered by the main mode of compartment change detected at the target site (from top: A>B to bottom: B>A), which is quantified by the loading of the first principal component of the whole sequence structural impact score (32Mb) matrix.
Extended Data Fig. 9
Extended Data Fig. 9. Random sequence permutation effects on sequence compartment A and compartment B activity.
Comparison of chromatin compartment activities of 25600bp sequences permuted by different segment length (at each permutation segment length, 2bp, 4bp, …, 256bp, every 25600bp sequence is divided into segments and the segments are then randomly shuffled and concatenated). Compartment B activity is compared with sequence A/T content at the same locations.
Extended Data Fig. 10
Extended Data Fig. 10. Predicted effects of disrupting genomic regions by randomly permuting sequences.
At each disruption site indicated by the arrow, 1.28Mb sequence centered at the position is permuted by 4bp segments. Permuted compartment A sequences show B compartment interaction patterns, while disrupted compartment B sequences remain to be in B compartment.
Fig. 1.
Fig. 1.. Predicting multiscale 3D genome architecture from sequence.
a) Schematic overview of the deep learning model architecture for genome interaction prediction across all scales. Sequence representations at multiple resolutions are computed by a hierarchical encoder starting from the sequence in a bottom-up (high resolution to low resolution) order, whereas genome interaction matrices are predicted from both the corresponding levels of sequence representation and the higher-level genome interaction prediction in a top-down order (low resolution to high resolution). b) Multiscale sequence-based prediction example zooming from the whole-chromosome into a position on a holdout test chromosome. Predictions from 1–256-Mb scales are compared with micro-C experimental observations. Missing values in micro-C data due to lack of coverage are shown in gray, and these regions are also indicated in the 64–256-Mb predictions because the predictions at major assembly gaps or unmappable regions are of unknown accuracy. The genome interactions are represented by the log fold over genomic-distance-based background scores for both the prediction and the experimental data. The predictions for the same regions for the HFF cell type are also shown in Extended Data Figure 1. c). Scatter plot comparison of the predicted interaction scores with the micro-C measured interaction scores on the holdout test chromosomes. 10,000 randomly subsampled scores are shown in each panel. The overall Pearson correlations across the entire test chromosomes are also annotated. Predictions for 1–32-Mb levels are from the Orca 32-Mb model and 64–256-Mb levels are from the Orca 256-Mb model.
Fig. 2.
Fig. 2.. Multiscale sequence-based prediction of structural variant effects on genome structure.
a) Schematic illustration of sequence-based predictions of multiscale genome interaction effects of SVs. A large 40.5-Mb inversion variant involved in leukemia is shown as an example. Predicted effects are shown by predicted genome interaction matrices based on wild type (WT) sequences and mutated sequences (Mut) at multiple scales. The experimentally supported effects of SVs are illustrated at the top of each panel (a-c), with relevant gene positions, major TAD boundaries (marked with the letter B), and range of variant positions indicated (minimal variant range indicated in bold lines). Experimentally supported increase in ectopic interactions is indicated with blue dashed arcs and blue bars. The Orca genome interaction predictions are represented by the log fold over genomic-distance-based background scores. b) Orca predictions of multiple variants with complex phenotypic outcomes in WNT6-PAX3 region. Positions of the major genes affected by the SVs are indicated by black arrows and known enhancer regions involved are indicated by blue arrows. Ectopic interactions caused by the variants are indicated by circles. Black and gray bars on the left side indicate genomic intervals involved in the SVs pre and post mutation. Full multiscale prediction results for both H1-ESC and HFF cell types as well as micro-C observations in the cell types are included in Supplementary Data 3, and validations results for all SVs are summarized in Supplementary Table 3. c) Comparison with 4C-seq experimental data for variants predicted in b). The normalized counts from 4C-seq and log10 predicted interaction scores (log fold over background) at the 4C-seq point-of-view are shown. The observed and predicted gain of interaction sites relevant to the phenotype are highlighted with the red dashed line box.
Fig. 3.
Fig. 3.. Identification of cell-type-specific motifs that underlie predicted submegabase-scale genome interactions.
a). Overview of the virtual screen for motif-scale (10-bp) sequences with submegabase-scale structural impact. An example of the estimated 1-Mb structural impact score profile and CTCF ChIP-seq for a section of the genome is shown on the right. b). Distribution of CTCF motif scores (log odds) at 10-bp sequences (including 10-bp flanking sequence) stratified by 1-Mb structural impact score ranges in H1-ESC (left) and HFF (right) are shown. c). Comparison of H1-ESC and HFF structural impact motif enrichment at non-CTCF sites with structural impact scores >0.01. Significance z-scores by two-sided t-test for each motif in both cell types are shown in the scatter plot. Motifs are grouped by DNA-binding domain as in. d) Distribution of the cell-type-specific POU5F1∷SOX2 and FOS∷JUN motif scores (log odds) at non-CTCF 10-bp sequences (including 10-bp flanking sequence) stratified by 1-Mb structural impact score ranges in H1-ESC (left) and HFF(right) are shown.
Fig. 4.
Fig. 4.. Virtual screen profiling of sequence-dependencies of chromatin compartments identifies a prominent role of TSS sequences.
a). Design of the virtual genetic screen for sequence activities in altering chromatin compartment. Source sequences tiling a genomic region or whole chromosomes are inserted into one or multiple target locations by swapping out the original sequence. Genome interaction changes within a 32-Mb window are predicted for each source sequence. b). A virtual screen setup for a region of 32 Mb (chr10:77,072,000–109,072,000), with 9 target locations indicated by arrows and source sequences tiling the entire region. c). Sequence chromatin compartment activity profiles of all source sequences (12,800 bp each) from the 32-Mb region at nine target locations. Top panels show predicted (green) and observed (gray) chromatin A/B compartment scores as computed by the first principal component (PC) of the interaction matrix (high score indicates A compartment). Sequence activity profiles are grouped by the principal compartment change direction of targets: B>A (red), A>B (blue), and mixed (gray). The x-axis shows the locations of source sequences and the y-axis shows the 32-Mb structural impact scores, as measured by predicted average absolute log fold change in genome interactions with the insertion site within the 32-Mb window. d). Effects of insertion sequence sizes (200 bp to 51,200 bp) on chromatin compartment alteration activities, compared at two representative target locations T3 (A>B) and T9 (BA activity is compared with TSS activities as represented by FANTOM CAGE signal (max count across samples). e). High-resolution analysis of sequence compartment A activities at loci with the strongest activities. The x-axis shows the center positions of the insertion sequence and the y-axis shows the 32-Mb structural impact scores. Insert sizes are also annotated. f). Comparison of TSS activities of sequences with and without compartment A activity (top 2% and bottom 98% 12,800-bp sequences, see Methods; total n = 27,281), indicated with ‘+’ sign and ‘−’ sign. The center values of the box plot represent the median; the bounds of boxes represent the 25th and the 75th percentiles; and the notch approximates a 95% confidence interval of the median.

References

    1. Rao SSP et al. A 3D Map of the Human Genome at Kilobase Resolution Reveals Principles of Chromatin Looping. Cell 159, 1665–1680 (2014). - PMC - PubMed
    1. Dixon JR et al. Topological domains in mammalian genomes identified by analysis of chromatin interactions. Nature 485, 376–380 (2012). - PMC - PubMed
    1. Nora EP et al. Spatial partitioning of the regulatory landscape of the X-inactivation centre. Nature 485, 381–385 (2012). - PMC - PubMed
    1. van Steensel B & Furlong EEM The role of transcription in shaping the spatial organization of the genome. Nat. Rev. Mol. Cell Biol 20, 327–337 (2019). - PMC - PubMed
    1. Kosak ST et al. Subnuclear compartmentalization of immunoglobulin loci during lymphocyte development. Science 296, 158–162 (2002). - PubMed

Publication types

MeSH terms