

Motor unit recovery following Smn restoration in mouse models of spinal muscular atrophy
- PMID: 35551393
- PMCID: PMC9476628
- DOI: 10.1093/hmg/ddac097
Motor unit recovery following Smn restoration in mouse models of spinal muscular atrophy
Abstract
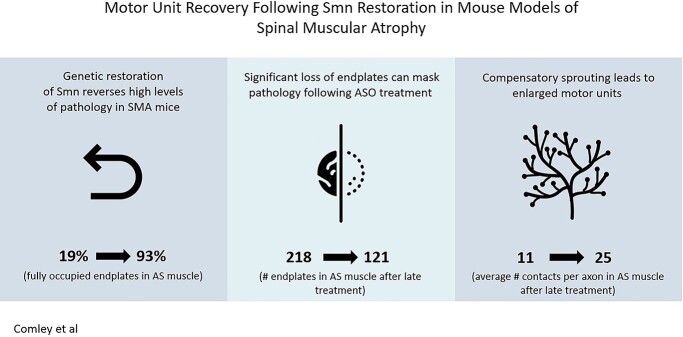
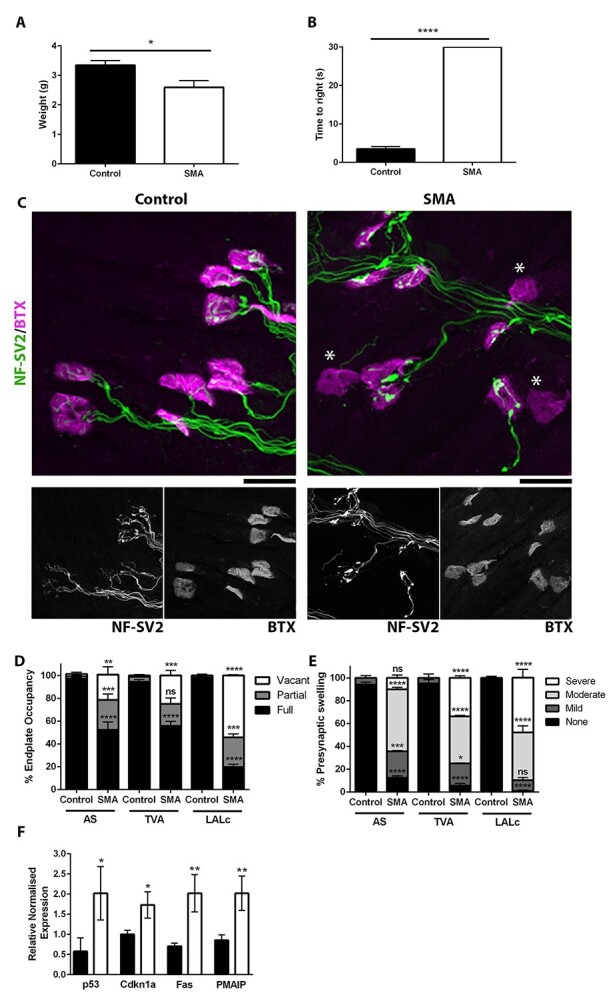
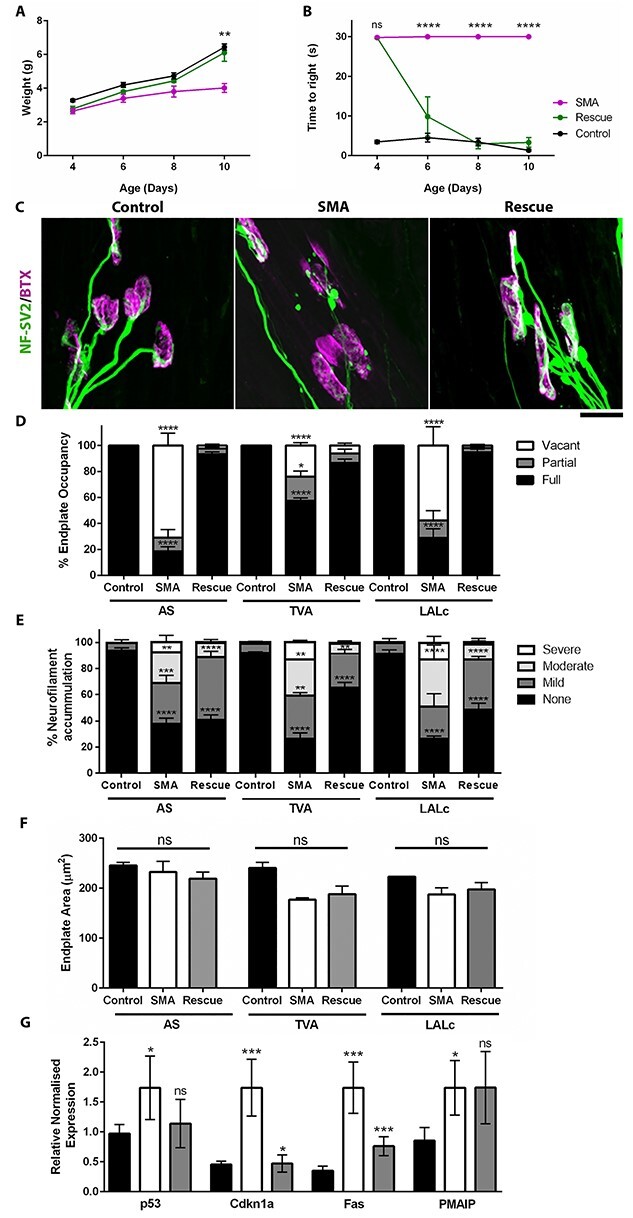
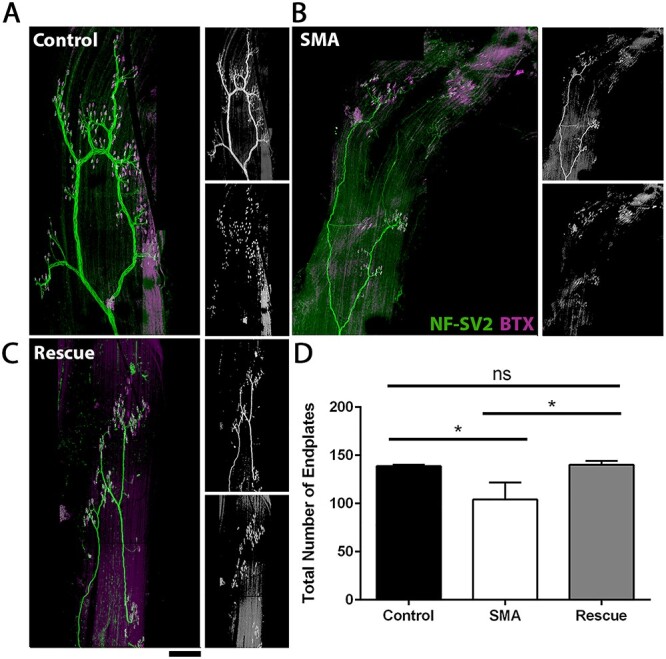
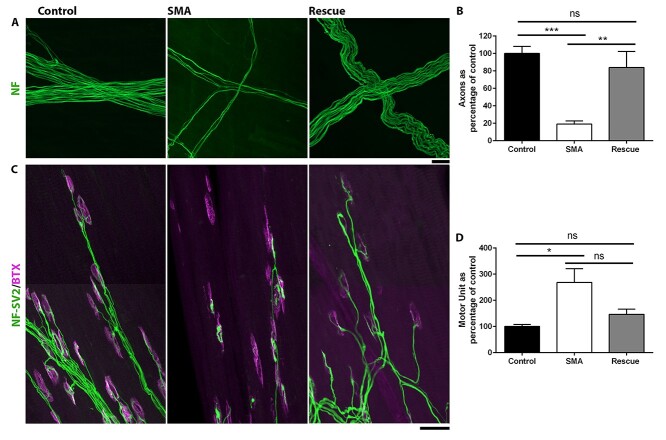
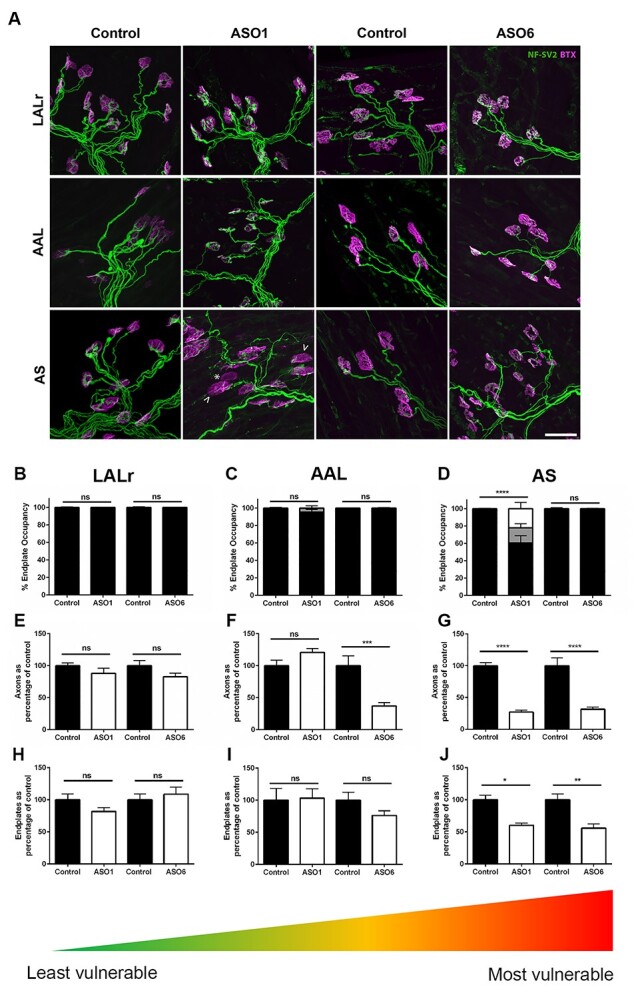
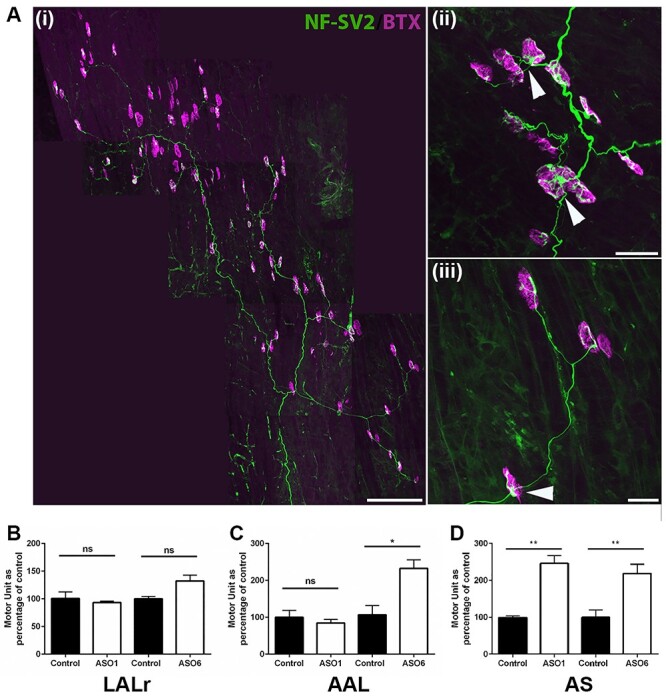
Spinal muscular atrophy (SMA) is a childhood motor neuron disease caused by anomalies in the SMN1 gene. Although therapeutics have been approved for the treatment of SMA, there is a therapeutic time window, after which efficacy is reduced. Hallmarks of motor unit pathology in SMA include loss of motor-neurons and neuromuscular junction (NMJs). Following an increase in Smn levels, it is unclear how much damage can be repaired and the degree to which normal connections are re-established. Here, we perform a detailed analysis of motor unit pathology before and after restoration of Smn levels. Using a Smn-inducible mouse model of SMA, we show that genetic restoration of Smn results in a dramatic reduction in NMJ pathology, with restoration of innervation patterns, preservation of axon and endplate number and normalized expression of P53-associated transcripts. Notably, presynaptic swelling and elevated Pmaip levels remained. We analysed the effect of either early or delayed treated of an antisense oligonucleotide (ASO) targeting SMN2 on a range of differentially vulnerable muscles. Following ASO administration, the majority of endplates appeared fully occupied. However, there was an underlying loss of axons and endplates, which was more prevalent following a delay in treatment. There was an increase in average motor unit size following both early and delayed treatment. Together this work demonstrates the remarkably regenerative capacity of the motor neuron following Smn restoration, but highlights that recovery is incomplete. This work suggests that there is an opportunity to enhance neuromuscular junction recovery following administration of Smn-enhancing therapeutics.
© The Author(s) 2022. Published by Oxford University Press.
Figures
Similar articles
-
Combinatorial ASO-mediated therapy with low dose SMN and the protective modifier Chp1 is not sufficient to ameliorate SMA pathology hallmarks.Neurobiol Dis. 2022 Sep;171:105795. doi: 10.1016/j.nbd.2022.105795. Epub 2022 Jun 18. Neurobiol Dis. 2022. PMID: 35724821
-
Peripheral SMN restoration is essential for long-term rescue of a severe spinal muscular atrophy mouse model.Nature. 2011 Oct 5;478(7367):123-6. doi: 10.1038/nature10485. Nature. 2011. PMID: 21979052 Free PMC article.
-
Normalization of Patient-Identified Plasma Biomarkers in SMNΔ7 Mice following Postnatal SMN Restoration.PLoS One. 2016 Dec 1;11(12):e0167077. doi: 10.1371/journal.pone.0167077. eCollection 2016. PLoS One. 2016. PMID: 27907033 Free PMC article.
-
Spinal muscular atrophy: antisense oligonucleotide therapy opens the door to an integrated therapeutic landscape.Hum Mol Genet. 2017 Oct 1;26(R2):R151-R159. doi: 10.1093/hmg/ddx215. Hum Mol Genet. 2017. PMID: 28977438 Review.
-
New and Developing Therapies in Spinal Muscular Atrophy: From Genotype to Phenotype to Treatment and Where Do We Stand?Int J Mol Sci. 2020 May 7;21(9):3297. doi: 10.3390/ijms21093297. Int J Mol Sci. 2020. PMID: 32392694 Free PMC article. Review.
Cited by
-
Mouse models of SMA show divergent patterns of neuronal vulnerability and resilience.Skelet Muscle. 2022 Sep 12;12(1):22. doi: 10.1186/s13395-022-00305-9. Skelet Muscle. 2022. PMID: 36089582 Free PMC article.
-
Liver SMN restoration rescues the Smn2B/- mouse model of spinal muscular atrophy.EBioMedicine. 2024 Dec;110:105444. doi: 10.1016/j.ebiom.2024.105444. Epub 2024 Nov 7. EBioMedicine. 2024. PMID: 39515026 Free PMC article.
-
Postsynaptic receptors regulate presynaptic transmitter stability through transsynaptic bridges.Proc Natl Acad Sci U S A. 2024 Apr 9;121(15):e2318041121. doi: 10.1073/pnas.2318041121. Epub 2024 Apr 3. Proc Natl Acad Sci U S A. 2024. PMID: 38568976 Free PMC article.
-
Boosting BDNF in muscle rescues impaired axonal transport in a mouse model of DI-CMTC peripheral neuropathy.bioRxiv [Preprint]. 2024 Mar 11:2023.04.09.536152. doi: 10.1101/2023.04.09.536152. bioRxiv. 2024. Update in: Neurobiol Dis. 2024 Jun 1;195:106501. doi: 10.1016/j.nbd.2024.106501. PMID: 38559020 Free PMC article. Updated. Preprint.
-
SMN2 Copy Number Association with Spinal Muscular Atrophy Severity: Insights from Colombian Patients.J Clin Med. 2024 Oct 25;13(21):6402. doi: 10.3390/jcm13216402. J Clin Med. 2024. PMID: 39518541 Free PMC article.
References
-
- Mercuri, E. (2021) Spinal muscular atrophy: from rags to riches. Neuromuscul Disord, 31, 998–1003. - PubMed
-
- Hoy, S.M. (2018) Nusinersen: a review in 5q spinal muscular atrophy. CNS Drugs, 32, 689–696. - PubMed
-
- Pattali, R., Mou, Y. and Li, X.J. (2019) AAV9 vector: a novel modality in gene therapy for spinal muscular atrophy. Gene Ther., 26, 287–295. - PubMed
-
- Dhillon, S. (2020) Risdiplam: first approval. Drugs, 80, 1853–1858. - PubMed
-
- Ratni, H., Ebeling, M., Baird, J., Bendels, S., Bylund, J., Chen, K.S., Denk, N., Feng, Z., Green, L., Guerard, M.et al. (2018) Discovery of risdiplam, a selective survival of motor neuron-2 (SMN2) gene splicing modifier for the treatment of spinal muscular atrophy (SMA). J. Med. Chem., 61, 6501–6517. - PubMed
Publication types
MeSH terms
Substances
Grants and funding
LinkOut - more resources
Full Text Sources
Medical
Molecular Biology Databases
Research Materials
Miscellaneous
