. 2022 Dec 1;24(12):2078-2090.
doi: 10.1093/neuonc/noac127.

Diagnostic potential of extracellular vesicles in meningioma patients

Affiliations

Diagnostic potential of extracellular vesicles in meningioma patients

Franz L Ricklefs et al. Neuro Oncol. .

Abstract

Background: Extracellular vesicles (EVs) play an important role in cell-cell communication, and tumor-derived EVs circulating in patient blood can serve as biomarkers. Here, we investigated the potential role of plasma EVs in meningioma patients for tumor detection and determined whether EVs secreted by meningioma cells reflect epigenetic, genomic, and proteomic alterations of original tumors.

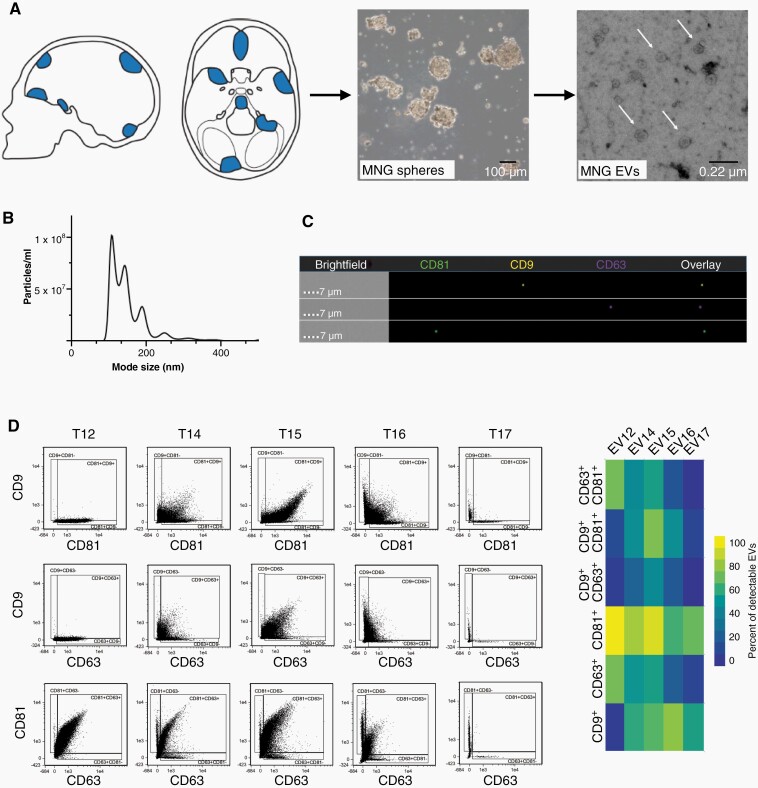
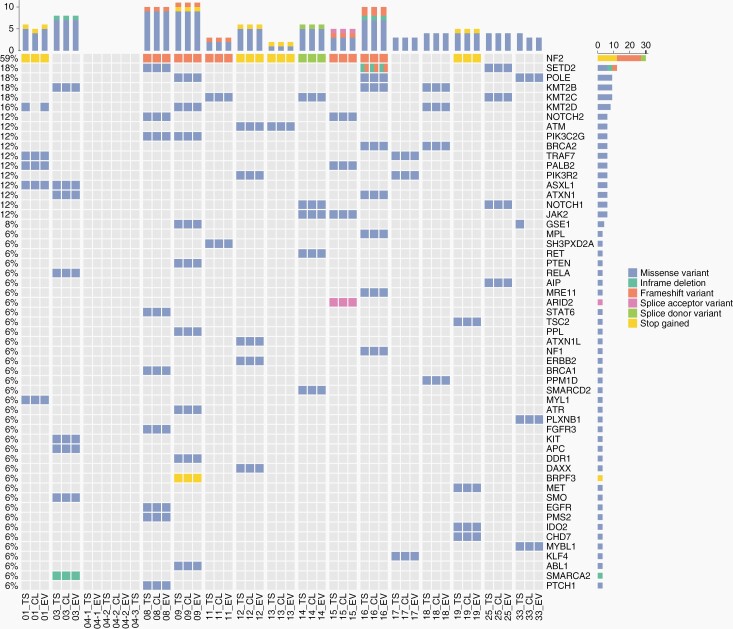
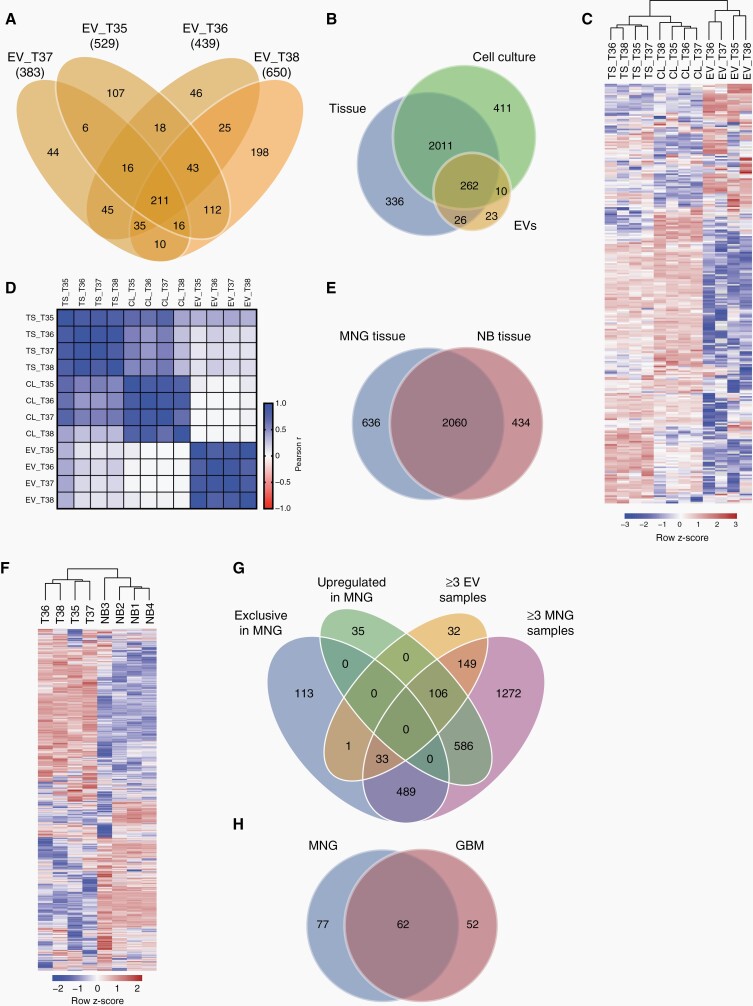
Methods: EV concentrations were quantified in patient plasma (n = 46). Short-term meningioma cultures were established (n = 26) and secreted EVs were isolated. Methylation and copy number profiling was performed using 850k arrays, and mutations were identified by targeted gene panel sequencing. Differential quantitative mass spectrometry was employed for proteomic analysis.

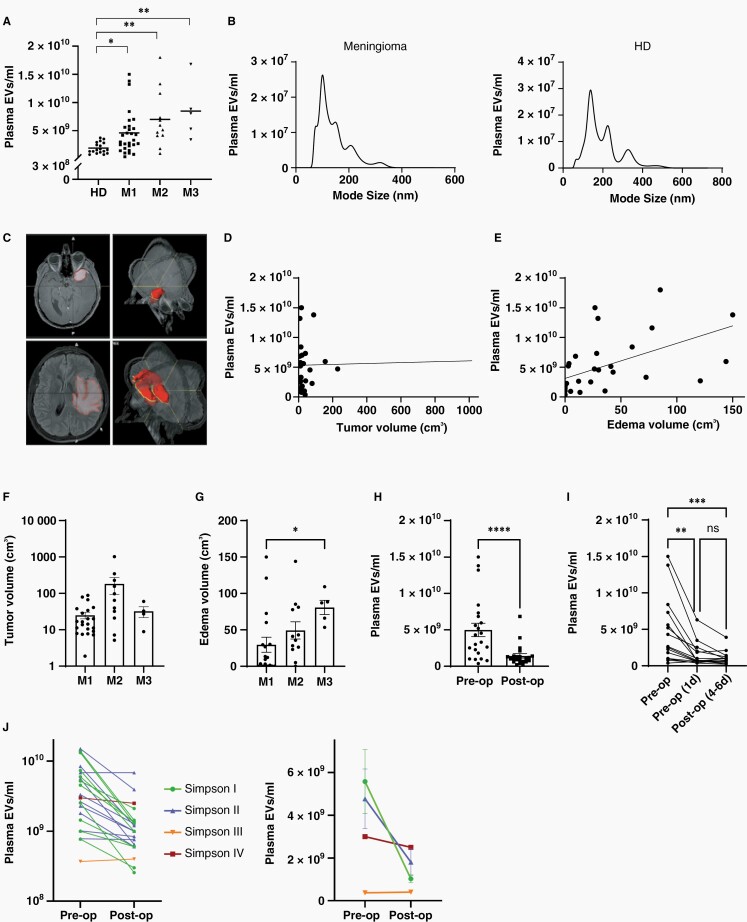
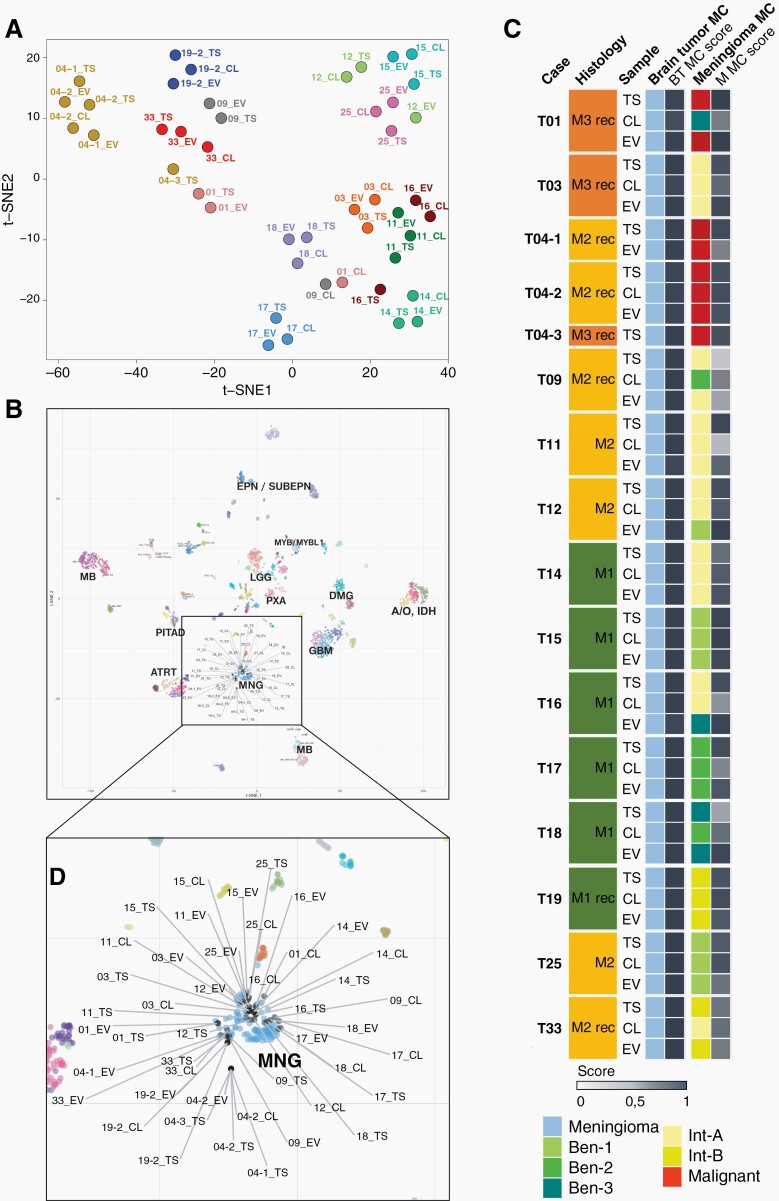
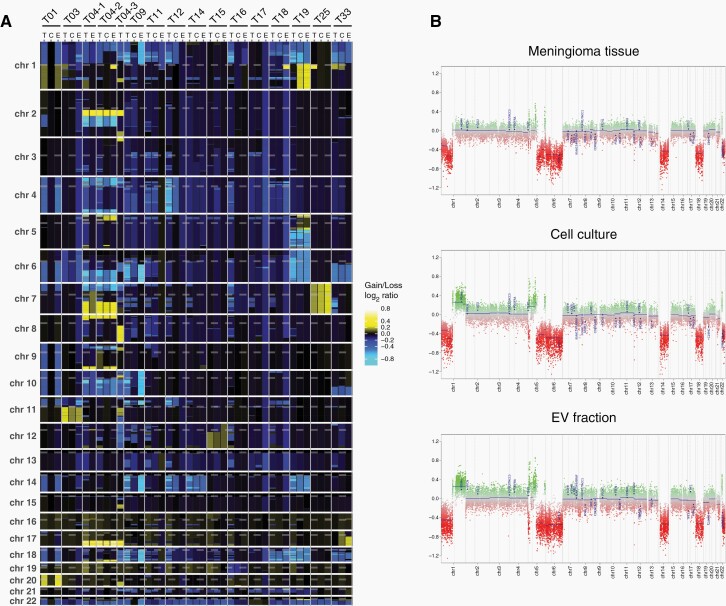
Results: Levels of circulating EVs were elevated in meningioma patients compared to healthy individuals, and the plasma EV concentration correlated with malignancy grade and extent of peritumoral edema. Postoperatively, EV counts dropped to normal levels, and the magnitude of the postoperative decrease was associated with extent of tumor resection. Methylation profiling of EV-DNA allowed correct tumor classification as meningioma in all investigated cases, and accurate methylation subclass assignment in almost all cases. Copy number variations present in tumors, as well as tumor-specific mutations were faithfully reflected in meningioma EV-DNA. Proteomic EV profiling did not permit original tumor identification but revealed tumor-associated proteins that could potentially be utilized to enrich meningioma EVs from biofluids.

Conclusions: Elevated EV levels in meningioma patient plasma could aid in tumor diagnosis and assessment of treatment response. Meningioma EV-DNA mirrors genetic and epigenetic tumor alterations and facilitates molecular tumor classification.

Keywords: cfDNA; exosome; liquid biopsy; meningioma; microvesicle.


Figures

Fig. 1
Fig. 1
Concentration of plasma EVs in meningioma patients. (A) EV levels in the plasma of meningioma patients (WHO grade 1–3) are increased compared to healthy donors (HD), as determined by nanoparticle tracking analysis, (Kruskal–Wallis, Dunn's; horizontal lines represent means). (B) Size distribution of plasma EVs. (C) Volumetric measurement of tumor size (top) and peritumoral edema (bottom) with 3D reconstruction (right). (D) Relationship between tumor volume and plasma EV concentration (r2 = 0,0009). (E) Association between peritumoral edema volume and plasma EV concentration (r2 = 0.2806). (F) Tumor size of meningiomas of different WHO grades. (G) Association of edema with malignancy grade (Kruskal–Wallis, Dunn's). (H) Reduction of EV concentrations to normal levels 4–6 days postoperatively (n = 22, Wilcoxon signed-rank). (I) EV reduction occurred within the first day after the operation (n = 15, Friedman, Dunn's). (J) Comparison of EV concentration changes (4–6 days postoperatively vs. preoperatively) in individual patients with different extent of tumor resection, as defined by Simpson grading (left panel, n = 22). Mean EV concentration changes in patient groups with different extent of resection (right panel). Postoperative EV reduction was only significant in the Simpson grade I group (P =.0093, 2-way ANOVA, Bonferroni). Values in (F)–(H) are means ± SEM. P values are defined as * <.05, ** <.01, *** <.001, and **** <.0001.
Fig. 2
Fig. 2
Meningioma EV isolation and analysis. (A) Meningioma (MNG) tissue was taken into culture using neurosphere conditions and EVs secreted by the tumor cells were analyzed. Electron microscopy demonstrates the typical cup-shaped morphology of EVs (arrows). (B) Size spectrum of EVs isolated from a meningioma culture. (C) Detection of tetraspanin markers by imaging flow cytometry, representative image. (D) Quantification of the percentage of tetraspanin single-positive and double-positive EVs.
Fig. 3
Fig. 3
DNA methylation profiling. (A) t-SNE analysis of genome-wide methylation profiles of EV-DNA, corresponding cells (CL), and tumor tissue (TS). (B) Comparison of samples with the Heidelberg CNS tumor reference cohort. All EV samples, corresponding cells, and tumor tissue (grey) map to the meningioma (MNG) cluster (light blue). (C) Summarized results of methylation profiling reports. In cases where tumor tissue, cells, or EVs displayed mixed epigenetic signatures, corresponding to more than one methylation class, the colour code represents the class with the higher match score.
Fig. 4
Fig. 4
CNV analysis of meningioma EVs. (A) Heatmap representation of genome-wide copy number gains and losses inferred from the DNA methylation analysis. (B) Example of CNV profiles for tumor T19 with corresponding cells and EVs.
Fig. 5
Fig. 5
Oncoprint of mutational frequencies and types of alterations detected by gene panel sequencing.
Fig. 6
Fig. 6
Proteomic profiles of meningioma EVs. (A) Numbers of proteins detected in EVs from cultured meningioma cells by differential quantitative proteomics. (B) Proteins detected in at least 3 of 4 samples each of EVs, cells, and original tumors. (C) Unsupervised clustering based on 262 proteins present in all three sample types. (D) Pearson correlation analysis of the proteomes of EVs, cells (C), and tumor tissue (T). (E) Overlap between proteins presents in ≥3 meningioma (MNG) tissue samples and in ≥3 samples of normal brain (NB). (F) Unsupervised clustering based on all proteins detected in ≥3 MNG samples and ≥3 NB samples. (G) Proteins either exclusively detected in MNG tissue vs NB, upregulated >2-fold in MNG vs NB, present in ≥3EV samples, and in ≥3 MNG tissue samples. (H) Overlap between proteins exclusive or upregulated in MNG tissue and present in ≥3EV samples as well as ≥3 MNG tissue samples, and proteins exclusive or upregulated in glioblastoma (GBM) tissue and present in at least 3 of 4 GBM EV samples as well as 3 of 4 GBM tissue samples (re-analyzed GBM data are from Maire et al.).

Comment in

References

    1. Ostrom QT, Patil N, Cioffi G, et al. CBTRUS statistical report: primary brain and other central nervous system tumors diagnosed in the United States in 2013-2017. Neuro Oncol. 2020; 22(12 Suppl 2):iv1–iv96. - PMC - PubMed
    1. Suppiah S, Nassiri F, Bi WL, et al. Molecular and translational advances in meningiomas. Neuro Oncol. 2019; 21(Suppl 1):i4–i17. - PMC - PubMed
    1. Goldbrunner R, Stavrinou P, Jenkinson MD, et al. EANO guideline on the diagnosis and management of meningiomas. Neuro Oncol. 2021; 23(11):1821–1834. - PMC - PubMed
    1. Preusser M, Brastianos PK, Mawrin C. Advances in meningioma genetics: novel therapeutic opportunities. Nat Rev Neurol. 2018; 14(2):106–115. - PubMed
    1. EL Andaloussi S, Mager I, Breakefield XO, et al. Extracellular vesicles: biology and emerging therapeutic opportunities. Nat Rev Drug Discov. 2013; 12(5):347–357. - PubMed

Publication types

MeSH terms