

The impact of pitolisant, an H3 receptor antagonist/inverse agonist, on perirhinal cortex activity in individual neuron and neuronal population levels
- PMID: 35551460
- PMCID: PMC9098477
- DOI: 10.1038/s41598-022-11032-y
The impact of pitolisant, an H3 receptor antagonist/inverse agonist, on perirhinal cortex activity in individual neuron and neuronal population levels
Abstract
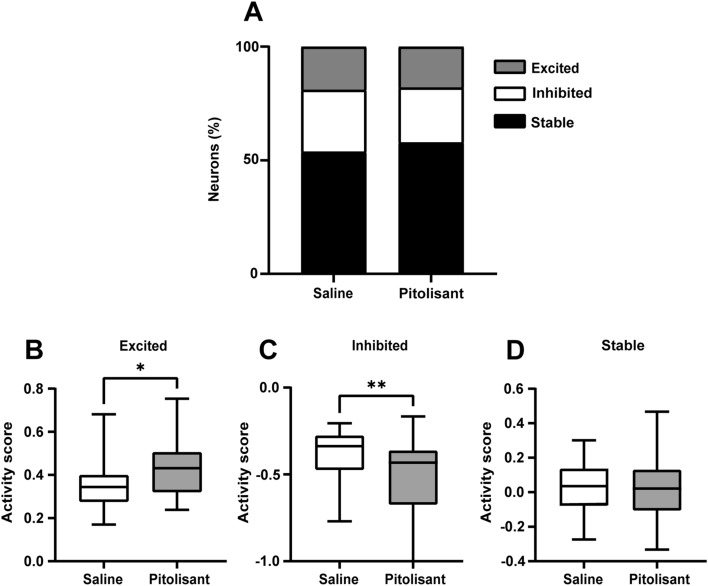
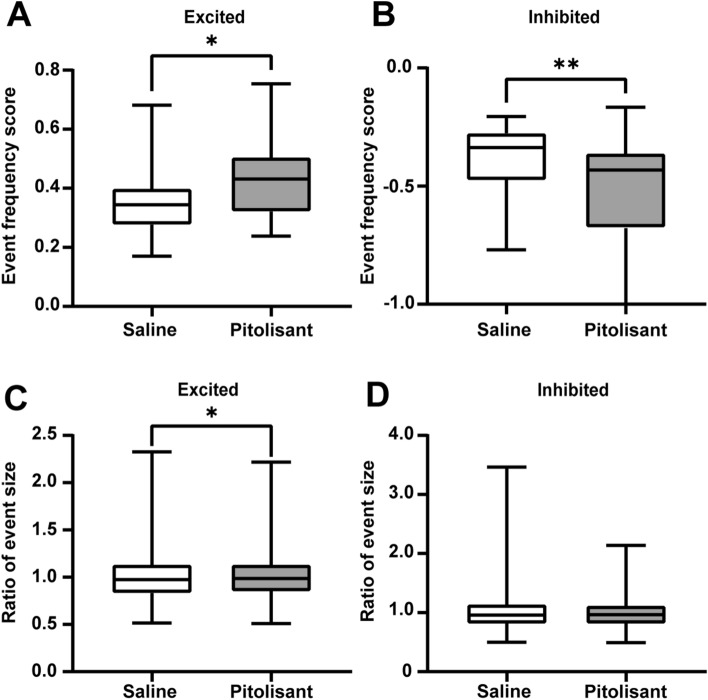
Histamine is a neurotransmitter that modulates neuronal activity and regulates various brain functions. Histamine H3 receptor (H3R) antagonists/inverse agonists enhance its release in most brain regions, including the cerebral cortex, which improves learning and memory and exerts an antiepileptic effect. However, the mechanism underlying the effect of H3R antagonists/inverse agonists on cortical neuronal activity in vivo remains unclear. Here, we show the mechanism by which pitolisant, an H3R antagonist/inverse agonist, influenced perirhinal cortex (PRh) activity in individual neuron and neuronal population levels. We monitored neuronal activity in the PRh of freely moving mice using in vivo Ca2+ imaging through a miniaturized one-photon microscope. Pitolisant increased the activity of some PRh neurons while decreasing the activity of others without affecting the mean neuronal activity across neurons. Moreover, it increases neuron pairs with synchronous activity in excitatory-responsive neuronal populations. Furthermore, machine learning analysis revealed that pitolisant altered the neuronal population activity. The changes in the population activity were dependent on the neurons that were excited and inhibited by pitolisant treatment. These findings indicate that pitolisant influences the activity of a subset of PRh neurons by increasing the synchronous activity and modifying the population activity.
© 2022. The Author(s).
Conflict of interest statement
The authors declare no competing interests.
Figures


Similar articles
-
Histamine H3 receptor inverse agonists/antagonists influence intra-regional cortical activity and inter-regional synchronization during resting state: an exploratory cortex-wide imaging study in mice.Mol Brain. 2024 Nov 27;17(1):88. doi: 10.1186/s13041-024-01165-8. Mol Brain. 2024. PMID: 39605021 Free PMC article.
-
The histamine H₃-receptor inverse agonist pitolisant improves fear memory in mice.Behav Brain Res. 2013 Apr 15;243:199-204. doi: 10.1016/j.bbr.2012.12.063. Epub 2013 Jan 14. Behav Brain Res. 2013. PMID: 23327739
-
Central Histamine Boosts Perirhinal Cortex Activity and Restores Forgotten Object Memories.Biol Psychiatry. 2019 Aug 1;86(3):230-239. doi: 10.1016/j.biopsych.2018.11.009. Epub 2019 Jan 8. Biol Psychiatry. 2019. PMID: 30635130 Clinical Trial.
-
Pitolisant for treating patients with narcolepsy.Expert Rev Clin Pharmacol. 2020 Feb;13(2):79-84. doi: 10.1080/17512433.2020.1714435. Epub 2020 Jan 23. Expert Rev Clin Pharmacol. 2020. PMID: 31937172
-
The histamine H3 receptor: from discovery to clinical trials with pitolisant.Br J Pharmacol. 2011 Jun;163(4):713-21. doi: 10.1111/j.1476-5381.2011.01286.x. Br J Pharmacol. 2011. PMID: 21615387 Free PMC article. Review.
Cited by
-
HIV-1 Tat protein alters medial prefrontal cortex neuronal activity and recognition memory.iScience. 2025 Feb 22;28(3):112075. doi: 10.1016/j.isci.2025.112075. eCollection 2025 Mar 21. iScience. 2025. PMID: 40160418 Free PMC article.
-
Chemogenetic activation of histamine neurons promotes retrieval of apparently lost memories.Mol Brain. 2024 Jun 15;17(1):38. doi: 10.1186/s13041-024-01111-8. Mol Brain. 2024. PMID: 38877480 Free PMC article.
-
Cellular-Resolution and Bulk-Fluorescence Recordings of Calcium Activity Yield Reciprocal Readouts of In Vivo Drug Efficacy.Synapse. 2025 Mar;79(2):e70011. doi: 10.1002/syn.70011. Synapse. 2025. PMID: 40013455 Free PMC article.
-
Is pitolisant safe for clinical use? A retrospective pharmacovigilance study focus on the post-marketing safety.Pharmacol Res Perspect. 2024 Feb;12(1):e1161. doi: 10.1002/prp2.1161. Pharmacol Res Perspect. 2024. PMID: 38174838 Free PMC article.
References
Publication types
MeSH terms
Substances
LinkOut - more resources
Full Text Sources
Miscellaneous
