

Design and validation of a semi-automatic bone segmentation algorithm from MRI to improve research efficiency
- PMID: 35551485
- PMCID: PMC9098419
- DOI: 10.1038/s41598-022-11785-6
Design and validation of a semi-automatic bone segmentation algorithm from MRI to improve research efficiency
Abstract
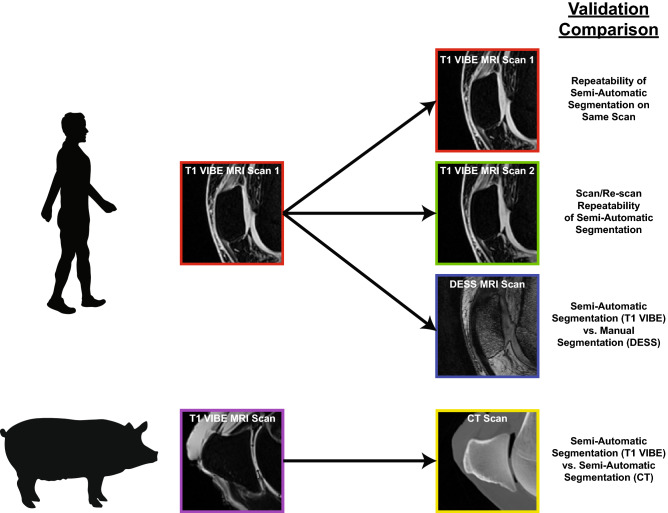
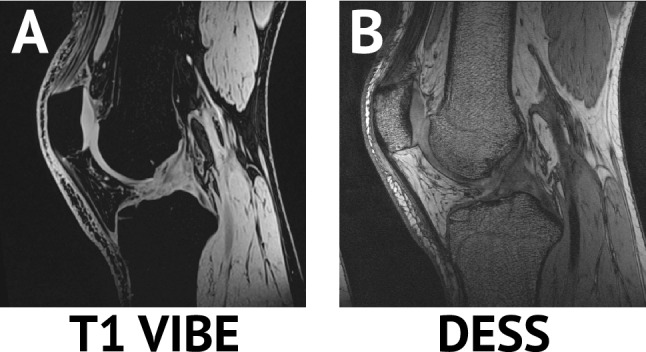
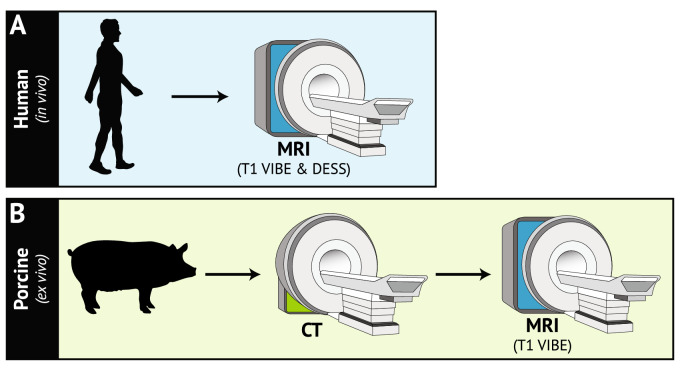
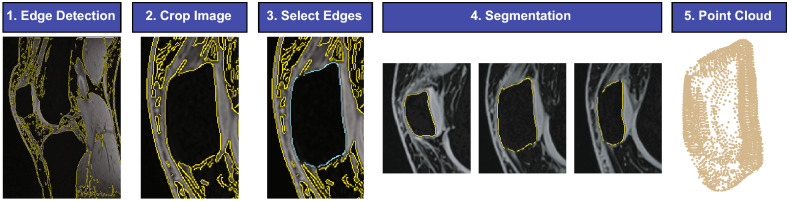
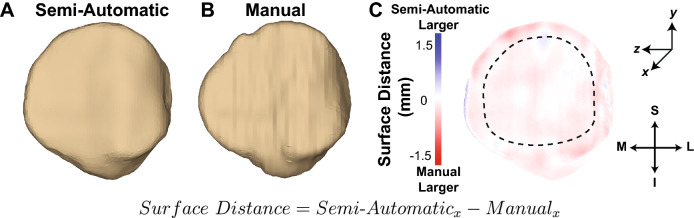
Segmentation of medical images into different tissue types is essential for many advancements in orthopaedic research; however, manual segmentation techniques can be time- and cost-prohibitive. The purpose of this work was to develop a semi-automatic segmentation algorithm that leverages gradients in spatial intensity to isolate the patella bone from magnetic resonance (MR) images of the knee that does not require a training set. The developed algorithm was validated in a sample of four human participants (in vivo) and three porcine stifle joints (ex vivo) using both magnetic resonance imaging (MRI) and computed tomography (CT). We assessed the repeatability (expressed as mean ± standard deviation) of the semi-automatic segmentation technique on: (1) the same MRI scan twice (Dice similarity coefficient = 0.988 ± 0.002; surface distance = - 0.01 ± 0.001 mm), (2) the scan/re-scan repeatability of the segmentation technique (surface distance = - 0.02 ± 0.03 mm), (3) how the semi-automatic segmentation technique compared to manual MRI segmentation (surface distance = - 0.02 ± 0.08 mm), and (4) how the semi-automatic segmentation technique compared when applied to both MRI and CT images of the same specimens (surface distance = - 0.02 ± 0.06 mm). Mean surface distances perpendicular to the cartilage surface were computed between pairs of patellar bone models. Critically, the semi-automatic segmentation algorithm developed in this work reduced segmentation time by approximately 75%. This method is promising for improving research throughput and potentially for use in generating training data for deep learning algorithms.
© 2022. The Author(s).
Conflict of interest statement
Brian D. Lewis is a paid consultant for Stryker, Nanovis, and Zimmer. No other authors have competing interests to disclose.
Figures

Similar articles
-
Accuracy Validation of an Automated Method for Prostate Segmentation in Magnetic Resonance Imaging.J Digit Imaging. 2017 Dec;30(6):782-795. doi: 10.1007/s10278-017-9964-7. J Digit Imaging. 2017. PMID: 28342043 Free PMC article.
-
Semi-supervised learning for automatic segmentation of the knee from MRI with convolutional neural networks.Comput Methods Programs Biomed. 2020 Jun;189:105328. doi: 10.1016/j.cmpb.2020.105328. Epub 2020 Jan 11. Comput Methods Programs Biomed. 2020. PMID: 31958580
-
Automatic segmentation of the glenohumeral cartilages from magnetic resonance images.Med Phys. 2016 Oct;43(10):5370. doi: 10.1118/1.4961011. Med Phys. 2016. PMID: 27782728
-
A Comprehensive Review on MRI-based Knee Joint Segmentation and Analysis Techniques.Curr Med Imaging. 2024;20:e150523216894. doi: 10.2174/1573405620666230515090557. Curr Med Imaging. 2024. PMID: 37189281
-
Automatic segmentation of knee menisci - A systematic review.Artif Intell Med. 2020 May;105:101849. doi: 10.1016/j.artmed.2020.101849. Epub 2020 May 6. Artif Intell Med. 2020. PMID: 32505421
Cited by
-
Improved Repeatability of Mouse Tibia Volume Segmentation in Murine Myelofibrosis Model Using Deep Learning.Tomography. 2023 Mar 7;9(2):589-602. doi: 10.3390/tomography9020048. Tomography. 2023. PMID: 36961007 Free PMC article.
-
Improving the Age Estimation Efficiency by Calculation of the Area Ratio Index Using Semi-Automatic Segmentation of Knee MRI Images.Biomedicines. 2023 Jul 20;11(7):2046. doi: 10.3390/biomedicines11072046. Biomedicines. 2023. PMID: 37509685 Free PMC article.
-
Patient-specific scaphoid prosthesis: surgical technique.Arch Orthop Trauma Surg. 2024 Dec 16;145(1):55. doi: 10.1007/s00402-024-05609-7. Arch Orthop Trauma Surg. 2024. PMID: 39680161 Free PMC article.
-
Impact of bone and cartilage segmentation from CT and MRI on both bone forearm osteotomy planning.Int J Comput Assist Radiol Surg. 2023 Dec;18(12):2307-2318. doi: 10.1007/s11548-023-02929-8. Epub 2023 May 23. Int J Comput Assist Radiol Surg. 2023. PMID: 37219804 Free PMC article.
-
Tibiofemoral cartilage strain and recovery following a 3-mile run measured using deep learning segmentation of bone and cartilage.Osteoarthr Cartil Open. 2024 Dec 5;7(1):100556. doi: 10.1016/j.ocarto.2024.100556. eCollection 2025 Mar. Osteoarthr Cartil Open. 2024. PMID: 39802079 Free PMC article.
References
-
- Prasoon, A. et al. in Medical Image Computing and Computer-Assisted Intervention - MICCAI 2013. (eds Kensaku Mori et al.) 246–253 (Springer, 2013). - PubMed
Publication types
MeSH terms
Grants and funding
LinkOut - more resources
Full Text Sources
Other Literature Sources
Medical
