

3D molecular phenotyping of cleared human brain tissues with light-sheet fluorescence microscopy
- PMID: 35551498
- PMCID: PMC9098858
- DOI: 10.1038/s42003-022-03390-0
3D molecular phenotyping of cleared human brain tissues with light-sheet fluorescence microscopy
Abstract
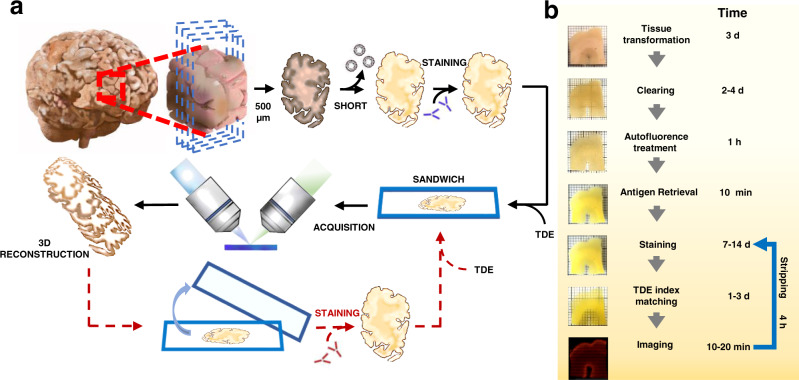
The combination of optical tissue transparency with immunofluorescence allows the molecular characterization of biological tissues in 3D. However, adult human organs are particularly challenging to become transparent because of the autofluorescence contributions of aged tissues. To meet this challenge, we optimized SHORT (SWITCH-H2O2-antigen Retrieval-TDE), a procedure based on standard histological treatments in combination with a refined clearing procedure to clear and label portions of the human brain. 3D histological characterization with multiple molecules is performed on cleared samples with a combination of multi-colors and multi-rounds labeling. By performing fast 3D imaging of the samples with a custom-made inverted light-sheet fluorescence microscope (LSFM), we reveal fine details of intact human brain slabs at subcellular resolution. Overall, we proposed a scalable and versatile technology that in combination with LSFM allows mapping the cellular and molecular architecture of the human brain, paving the way to reconstruct the entire organ.
© 2022. The Author(s).
Conflict of interest statement
The authors declare no competing interests.
Figures


Similar articles
-
Optical Clearing and Labeling for Light-sheet Fluorescence Microscopy in Large-scale Human Brain Imaging.J Vis Exp. 2024 Jan 26;(203). doi: 10.3791/65960. J Vis Exp. 2024. PMID: 38345230
-
Efficient 3D imaging and pathological analysis of the human lymphoma tumor microenvironment using light-sheet immunofluorescence microscopy.Theranostics. 2024 Jan 1;14(1):406-419. doi: 10.7150/thno.86221. eCollection 2024. Theranostics. 2024. PMID: 38164148 Free PMC article.
-
Imaging the mammary gland and mammary tumours in 3D: optical tissue clearing and immunofluorescence methods.Breast Cancer Res. 2016 Dec 13;18(1):127. doi: 10.1186/s13058-016-0754-9. Breast Cancer Res. 2016. PMID: 27964754 Free PMC article.
-
Scalable tissue labeling and clearing of intact human organs.Nat Protoc. 2022 Oct;17(10):2188-2215. doi: 10.1038/s41596-022-00712-8. Epub 2022 Jul 20. Nat Protoc. 2022. PMID: 35859136 Review.
-
3D light-sheet fluorescence microscopy in preclinical and clinical drug discovery.Drug Discov Today. 2024 Nov;29(11):104196. doi: 10.1016/j.drudis.2024.104196. Epub 2024 Oct 4. Drug Discov Today. 2024. PMID: 39368696 Review.
Cited by
-
Frontiers in artificial intelligence-directed light-sheet microscopy for uncovering biological phenomena and multi-organ imaging.View (Beijing). 2024 Oct;5(5):20230087. doi: 10.1002/VIW.20230087. Epub 2024 Sep 3. View (Beijing). 2024. PMID: 39478956
-
Efficient 3D light-sheet imaging of very large-scale optically cleared human brain and prostate tissue samples.Commun Biol. 2023 Feb 13;6(1):170. doi: 10.1038/s42003-023-04536-4. Commun Biol. 2023. PMID: 36781939 Free PMC article.
-
Depicting the anatomy of the gyral white matter: ubi sumus? quo vadimus?.Brain Commun. 2023 Oct 11;5(5):fcad265. doi: 10.1093/braincomms/fcad265. eCollection 2023. Brain Commun. 2023. PMID: 38074075 Free PMC article. Review.
-
A Guide to Perform 3D Histology of Biological Tissues with Fluorescence Microscopy.Int J Mol Sci. 2023 Apr 4;24(7):6747. doi: 10.3390/ijms24076747. Int J Mol Sci. 2023. PMID: 37047724 Free PMC article. Review.
-
Segmentation of supragranular and infragranular layers in ultra-high-resolution 7T ex vivo MRI of the human cerebral cortex.Cereb Cortex. 2024 Sep 3;34(9):bhae362. doi: 10.1093/cercor/bhae362. Cereb Cortex. 2024. PMID: 39264753
References
Publication types
MeSH terms
Substances
Grants and funding
LinkOut - more resources
Full Text Sources
