. 2022 May 12;20(1):225.
doi: 10.1186/s12951-022-01439-0.

Boosting nutrient starvation-dominated cancer therapy through curcumin-augmented mitochondrial Ca2+ overload and obatoclax-mediated autophagy inhibition as supported by a novel nano-modulator GO-Alg@CaP/CO

Affiliations

Boosting nutrient starvation-dominated cancer therapy through curcumin-augmented mitochondrial Ca2+ overload and obatoclax-mediated autophagy inhibition as supported by a novel nano-modulator GO-Alg@CaP/CO

Xuan Wang et al. J Nanobiotechnology. .

Abstract

Background: By hindering energy supply pathway for cancer cells, an alternative therapeutic strategy modality is put forward: tumor starvation therapy. And yet only in this blockade of glucose supply which is far from enough to result in sheer apoptosis of cancer cells.

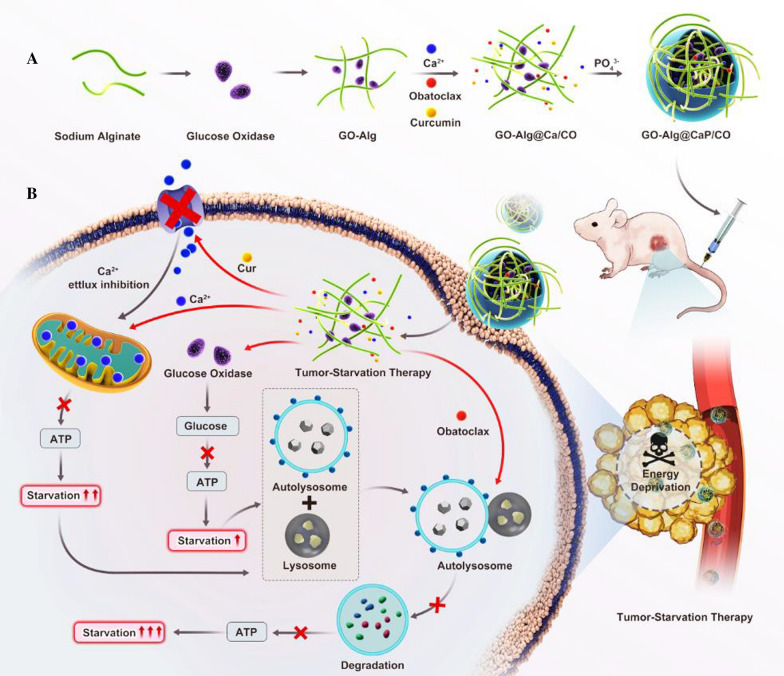
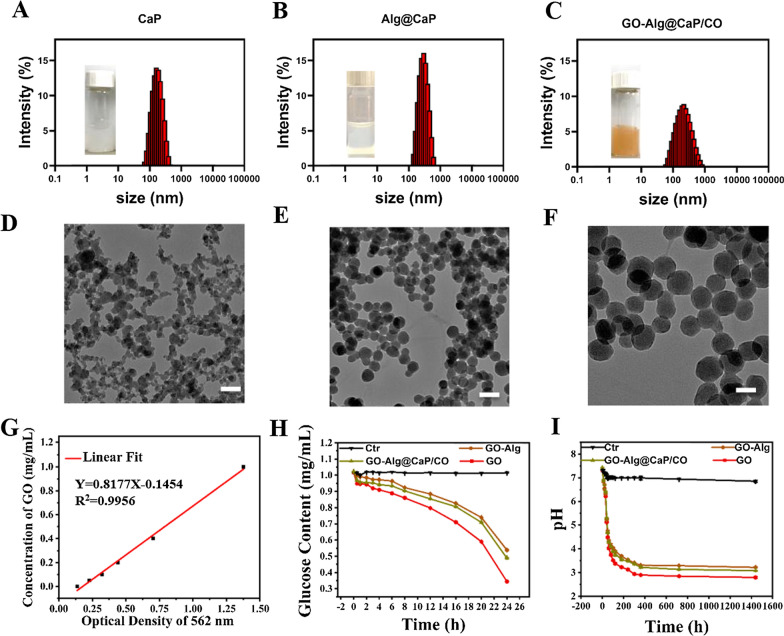
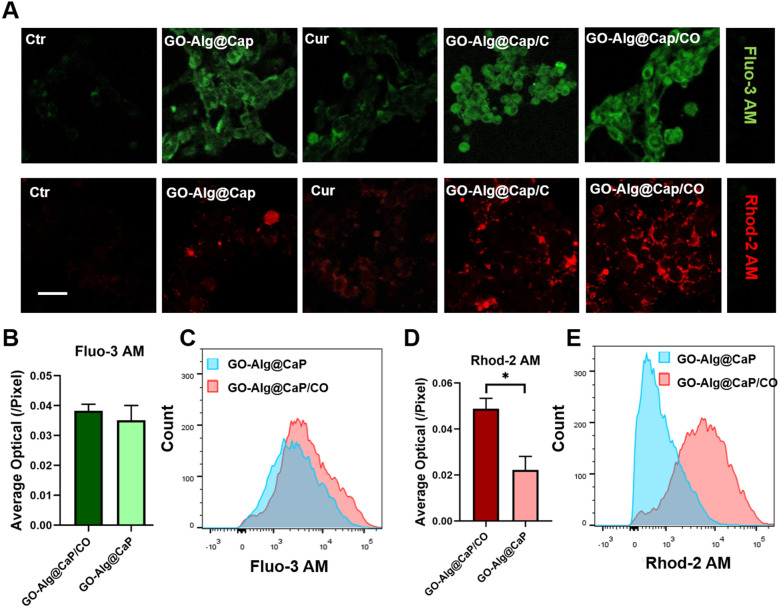
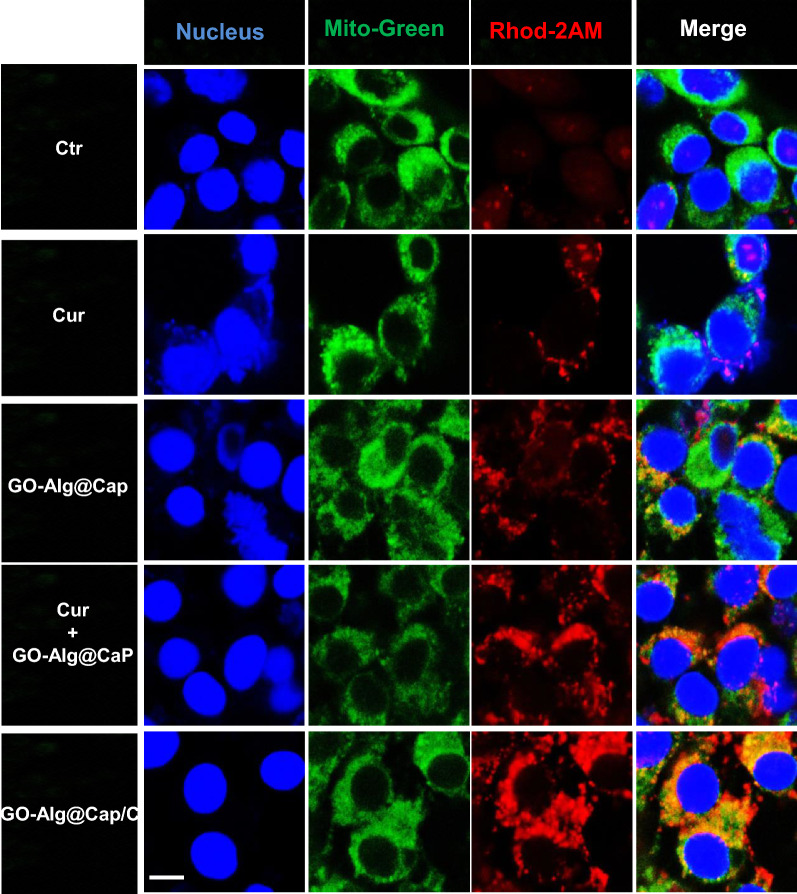
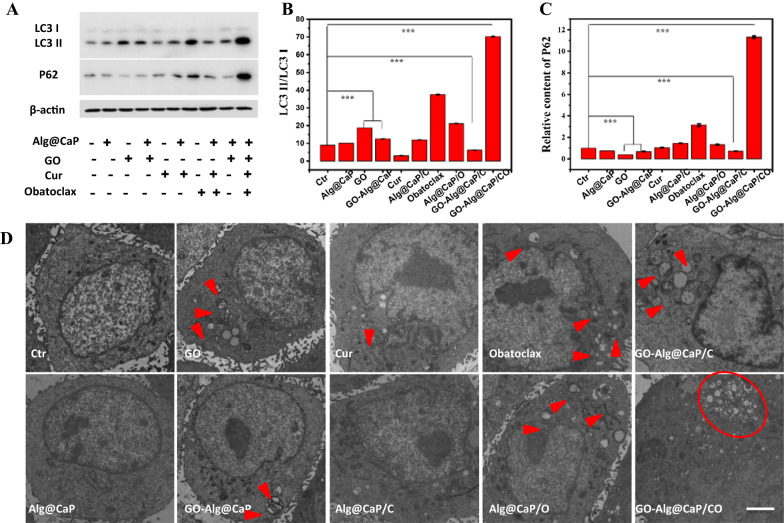
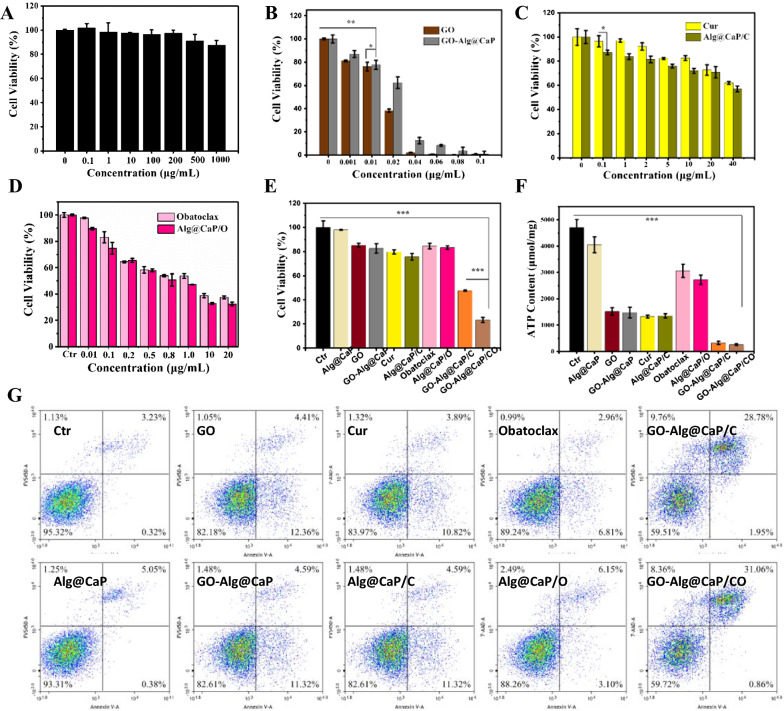
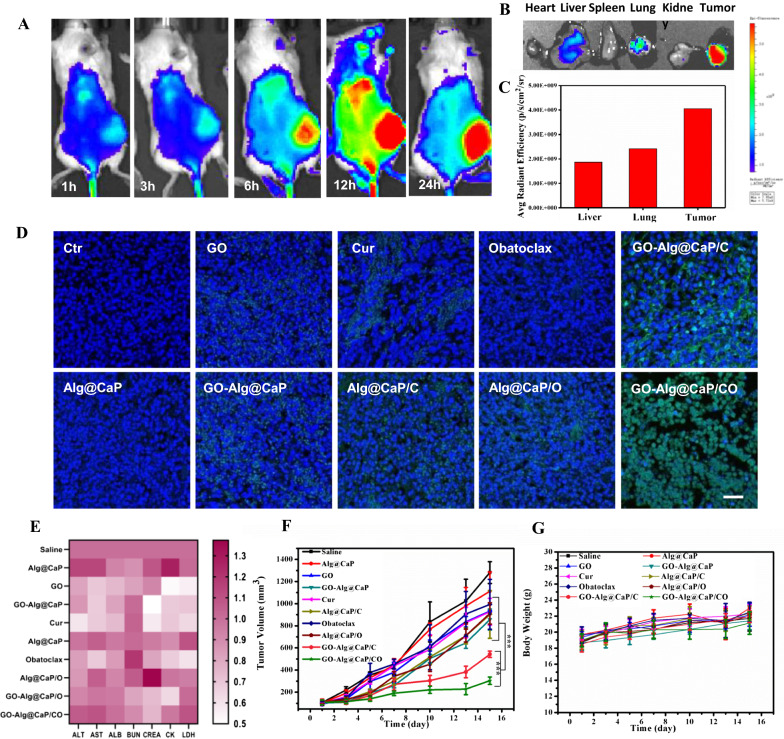
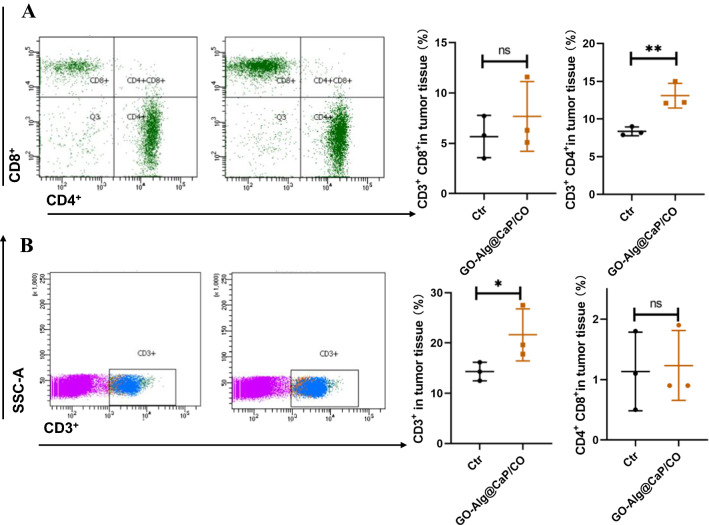
Results: In an effort to boost nutrient starvation-dominated cancer therapy, here a novel mitochondrial Ca2+ modulator Alg@CaP were tailor-made for the immobilization of Glucose oxidase for depriving the intra-tumoral glucose, followed by the loading of Curcumin to augment mitochondrial Ca2+ overload to maximize the therapeutic efficiency of cancer starvation therapy via mitochondrial dysfunctions. Also, autophagy inhibitors Obatoclax were synchronously incorporated in this nano-modulator to highlight autophagy inhibition.

Conclusion: Here, a promising complementary modality for the trebling additive efficacy of starvation therapy was described for cutting off the existing energy sources in starvation therapy through Curcumin-augmented mitochondrial Ca2+ overload and Obatoclax-mediated autophagy inhibition.

Keywords: Autophagy; Cancer metabolism; Complementary modality; Curcumin; Mitochondrial Ca2+ overload; Starvation therapy.


Conflict of interest statement

The authors declare that they have no competing interests.

Figures

Scheme 1
Scheme 1
A Schematic diagram of the novel nano-modulator GO-Alg@CaP/CO. B Schematic illustration of the promising complementary modality for the trebling additive efficacy of starvation therapy which was described for cutting off the existing energy sources in starvation therapy through curcumin-augmented mitochondrial Ca2+ overload and obatoclax-mediated autophagy inhibition
Fig. 1
Fig. 1
Particle sizes of A CaP, B Alg@CaP and C GO-Alg@CaP/CO. These insets showed the images of the corresponding aqueous solution. Transmission electron microscopy (TEM) of D CaP, E Alg@CaP and F GO-Alg@CaP/CO (scale bars were 200 nm). G The standard content curves of GO based on BCA assays. H Variation of glucose concentration and I pH value in glucose solution (1 mg/mL) after the addition of GO, GO-Alg and GO-Alg@CaP/CO with the identical GO concentration (1 mg/mL)
Fig. 2
Fig. 2
Disruption of intramitochondrial Ca2+ homeostasis A intracellular Ca2+ production and mitochondrial Ca2+ concentrations of 4T1 cells treated with different preparations for 6 h. Scale bars were 50 μm. BE Flow cytometry results of 4T1 cells incubated with GO-Alg@CaP and GO-Alg@CaP/C. Data are mean ± SD, n = 3; *P < 0.05, **P < 0.01 and ***P < 0.001
Fig. 3
Fig. 3
Biodistribution of Ca2+ in mitochondria in 4T1 cells after incubation with different preparations for 6 h. The nucleus and mitochondria were stained with Hoechst 33342 and Mito-Green, respectively. The scale bar was 10 μm
Fig. 4
Fig. 4
A P62, LC3-I, and LC3-II expression in 4T1 cells with a western-blotting analysis under different groups. Matching gray-scale analysis of B LC3-II/LC3-I and C P62. D TEM images of autophagosome. Red arrows and circles implied the autophagosome. Data are mean ± SD, n = 3; *P < 0.05, **P < 0.01, and ***P < 0.001 vs control. The scale bar was 5 μm
Fig. 5
Fig. 5
A Relative viability of 4T1 cancer cells cultured with blank carriers (Alg@CaP) at different concentrations. Relative viability of 4T1 cancer cells cultured with different treatments. B GO and GO-Alg@CaP, C Cur and Alg@CaP/C, and D obatoclax and Alg@CaP/O. E Relative viability of 4T1 cancer cells cultured with different preparations at desired concentrations for 24 h. F Intracellular ATP content analysis of 4T1 cancer cells cultured with different preparations at desired concentrations for 48 h. G Apoptosis assays of 4T1 cells in different groups with a flow cytometric analysis. Data are mean ± SD, n = 3; *P < 0.05, **P < 0.01 and ***P < 0.001 vs. control
Fig. 6
Fig. 6
A In vivo fluorescence images of 4T1 tumor-bearing mice that were intravenously injected with Alg@CaP/I at different time points and B ex vivo fluorescence images of major organs and tumors at 24 h post injection. C Histogram analysis of relative average radiant efficiency of liver, lungs, and tumor. D TUNEL-stained tumor slices collected from 4T1 tumor-bearing mice after treatments for 15 days. The scale bar was 50 μm. E Blood analysis of mice at 15 days after various treatments. F Relative volume changes and G mice body weight changes in different groups. Data are mean ± SD, n = 5; *P < 0.05, **P < 0.01, and ***P < 0.001 vs. control
Fig. 7
Fig. 7
A Representative flow cytometric analysis (left) and quantification (right) of CD3+CD8+ and CD3+CD4+ T cells in the tumor. B Representative flow cytometric analysis gating on CD3+ cells (left) and relative quantification (right) of CD4+CD8+ T cells and CD3+cells. Data are mean ± SD (n = 3). *P < 0.05; **P < 0.01; ***P < 0.001

References

    1. Galluzzi L, Pietrocola F, Levine B, Kroemer G. Metabolic control of autophagy. Cell. 2014;159:1263–1276. doi: 10.1016/j.cell.2014.11.006. - DOI - PMC - PubMed
    1. Lu Z, Gao J, Fang C, Zhou Y, Li X, Han G. Porous Pt nanospheres incorporated with GOx to enable synergistic oxygen-inductive starvation/electrodynamic tumor therapy. Adv Sci. 2020;7:2001223. doi: 10.1002/advs.202001223. - DOI - PMC - PubMed
    1. Ren J, Zhang L, Zhang J, Zhang W, Cao Y, Xu Z, Cui H, Kang Y, Xue P. Light-activated oxygen self-supplied starving therapy in near-infrared (NIR) window and adjuvant hyperthermia-induced tumor ablation with an augmented sensitivity. Biomaterials. 2020;234:119771. doi: 10.1016/j.biomaterials.2020.119771. - DOI - PubMed
    1. Yu J, Wei Z, Li Q, Wan F, Chao Z, Zhang X, Lin L, Meng H, Tian L. Advanced cancer starvation therapy by simultaneous deprivation of lactate and glucose using a MOF nanoplatform. Adv Sci. 2021;8(19):2101467. doi: 10.1002/advs.202101467. - DOI - PMC - PubMed
    1. Vander Heiden MG, Cantley LC, Thompson CB. Understanding the Warburg effect: the metabolic requirements of cell proliferation. Science. 2009;324:1029–1033. doi: 10.1126/science.1160809. - DOI - PMC - PubMed