. 2023 Jul;26(5):961-974.
doi: 10.1016/j.neurom.2022.03.007. Epub 2022 May 10.

Spatiotemporal Distribution of Electrically Evoked Spinal Compound Action Potentials During Spinal Cord Stimulation

Affiliations

Spatiotemporal Distribution of Electrically Evoked Spinal Compound Action Potentials During Spinal Cord Stimulation

Jonathan S Calvert et al. Neuromodulation. 2023 Jul.

Abstract

Objectives: Recent studies using epidural spinal cord stimulation (SCS) have demonstrated restoration of motor function in individuals previously diagnosed with chronic spinal cord injury (SCI). In parallel, the spinal evoked compound action potentials (ECAPs) induced by SCS have been used to gain insight into the mechanisms of SCS-based chronic pain therapy and to titrate closed-loop delivery of stimulation. However, the previous characterization of ECAPs recorded during SCS was performed with one-dimensional, cylindrical electrode leads. Herein, we describe the unique spatiotemporal distribution of ECAPs induced by SCS across the medial-lateral and rostral-caudal axes of the spinal cord, and their relationship to polysynaptic lower-extremity motor activation.

Materials and methods: In each of four sheep, two 24-contact epidural SCS arrays were placed on the lumbosacral spinal cord, spanning the L3 to L6 vertebrae. Spinal ECAPs were recorded during SCS from nonstimulating contacts of the epidural arrays, which were synchronized to bilateral electromyography (EMG) recordings from six back and lower-extremity muscles.

Results: We observed a triphasic P1, N1, P2 peak morphology and propagation in the ECAPs during midline and lateral stimulation. Distinct regions of lateral stimulation resulted in simultaneously increased ECAP and EMG responses compared with stimulation at adjacent lateral contacts. Although EMG responses decreased during repetitive stimulation bursts, spinal ECAP amplitude did not significantly change. Both spinal ECAP responses and EMG responses demonstrated preferential ipsilateral recruitment during lateral stimulation compared with midline stimulation. Furthermore, EMG responses were correlated with stimulation that resulted in increased ECAP amplitude on the ipsilateral side of the electrode array.

Conclusions: These results suggest that ECAPs can be used to investigate the effects of SCS on spinal sensorimotor networks and to inform stimulation strategies that optimize the clinical benefit of SCS in the context of managing chronic pain and the restoration of sensorimotor function after SCI.

Keywords: Chronic pain; electromyography; functional restoration; neurostimulation; spinal cord injury; spinal cord stimulation.


Conflict of interest statement

Conflict of Interest Statement: JSC, RD, SRP, and DAB have patents pending regarding the recording of spinal electrophysiological signals during spinal cord stimulation. BLM is an employee of Micro-Leads Medical Inc., a medical device technology company whose technology was used in this study.

Figures

Figure 1:
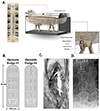
Figure 1:. The ovine model of SCS enables dual electrode spinal stimulation with spinal ECAP and EMG recording.
A. Conceptual visualization of the placement of the epidural electrode arrays on the spinal cord following a laminectomy and view of the experimental setup. Electrode array leads were externalized and connected to a custom-built breakout box for purposes of stimulation and recording. Surface electromyography (EMG) sensors were placed bilaterally on six muscles of the trunk and hindlegs of the sheep during experimental sessions: the Paraspinal Muscles, Tensor Fasciae Latae, Gracilis (sensor on inside of leg and not shown), Biceps Femoris, Gastrocnemius, and Peroneus. B. Conceptual diagram depicting the spinal electrode array designs used in this study. Two electrode designs were used, design #1 was implanted in sheep S1 and S2, and design #2 was implanted in sheep S3 and S4. C. Representative photograph of an electrode array during implantation onto the dorsal aspect of the epidural space of the spinal cord. D. Post-implantation x-rays indicating positioning of the electrode arrays with respect to vertebral bodies.
Figure 2:
Figure 2:. Randomized SCS sweep protocol results in spinal ECAP recordings with triphasic morphology.
A. Example randomized parameter sweep demonstrating stimulation amplitude and frequency combinations used during SCS. Five amplitudes and four frequencies were chosen, and each unique combination was delivered 10-15 times in 300 ms bursts. The Randomized Stimulation Sweep Procedure plot indicates recordings from the stimulating electrode during a representative sweep of four unique combinations. The Example Randomized Parameter Sweep table indicates each of the unique combinations used within the entire experimental recording used to create the representative plot. B. Demonstration of P1, N1, and P2 spinal ECAP peaks from a representative spinal electrode during SCS. Stimulation is represented by the red circle on the caudal array, and the spinal ECAP response is recorded from the electrode labeled blue on the rostral array. Spinal ECAP traces are averaged across 10 trials and stimulation was delivered at 0 ms. C. Representative spinal ECAPs recorded simultaneously from the rostral electrode array. The bold line indicates the average response of 10 trials and the shaded area represents the standard deviation of the responses. Stimulation is represented by the red oval on the caudal array, and the recording electrodes are represented by their respective color on the rostral array.
Figure 3:
Figure 3:. Spatiotemporal ECAP propagation is dependent on medial-lateral stimulation location.
The heatmaps show a comparison of the spinal ECAP response along the rostral electrode array during stimulation at midline and laterally to the right of midline on the caudal electrode array. The heatmaps demonstrate that midline stimulation results in a symmetric activation along the rostral electrode recordings compared to the lateral stimulation which demonstrate increased responses on the rostral electrode array contacts that were ipsilateral to the site of stimulation. Red contour lines on the heatmap indicate the regions corresponding to the maximum value of response on the electrode. Stimulation was delivered to the site shown in red on the caudal electrode array and a representative spinal ECAP trace from the rostral electrode array, circled in yellow, is shown below the heatmap. The spinal ECAP is an average of 10 trials and the orange line indicates the time at which the heatmap is occurring with respect to the start of stimulation, which was at 0 ms. Stimulation for both conditions was 720 μA and 25 Hz.
Figure 4:
Figure 4:. Spinal ECAP propagation along the midline and lateral spinal cord.
Spinal ECAP propagation along the rostral array during midline and lateral SCS of the caudal array. During midline stimulation, the spinal ECAP responses demonstrated a triphasic P1, N1, P2 morphology and both the P1 and P2 incidence time significantly increased with distance from the stimulating electrode. The lateral stimulation also demonstrated the triphasic P1, N1, P2 morphology, with significantly increased incidence time. Stimulation is represented by the red oval on the caudal array, and the recording electrodes are represented by their respective color on the rostral array. Spinal ECAP traces were averaged across 10 trials and stimulation was delivered at 0 ms. Incidence plots indicate mean values and standard deviation across 10 trials. * indicates multiple comparisons between groups with p<0.05, all other comparisons were non-significant.
Figure 5:
Figure 5:. Distinct lateral stimulation sites result in simultaneously increased ECAP and EMG amplitude.
A. Spinal ECAP and EMG responses during stimulation from two different electrode contacts laterally to the right of midline in two sheep, S3 and S4. Stimulation at the top right corner of the electrode array resulted in distinct P1, N1, P2 peaks, and robust motor activation. Stimulation at the right middle of the electrode array resulted in decreased spinal ECAP and EMG responses. Stimulation was delivered to the sites shown in red ovals and the representative spinal ECAP location is indicated in blue and green, respectively. Spinal ECAP and EMG traces are averages of 10 trials, and stimulation was delivered at 0 ms. The arrows indicate individual stimulation pulses on the EMG plots. B. Bar plots for the mean spinal ECAP and biceps femoris EMG AUC data indicating significantly increased responses from stimulation in the top right corner of the electrode array compared to the responses from stimulation on the middle right of the electrode array. The mean is calculated from 10 trials of stimulation at 480 μA and 10 Hz. Error bars indicate standard deviation of the data. * indicates significance of p < 0.05.
Figure 6:
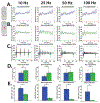
Figure 6:. Spinal ECAP responses do not demonstrate post-activation depression.
A. Spinal ECAP responses from the initial stimulus of a 300 ms pulse train at stimulation frequencies of 10, 25, 50, and 100 Hz. The bold line indicates the average response of 10 trials and the shaded area represents the standard deviation of the responses. Stimulation is delivered at 0 ms. B. Spinal ECAP responses from the final stimulus of a 300 ms pulse train at 10, 25, 50, and 100 Hz stimulation frequencies. C. EMG responses from the gastrocnemius muscle during a 300 ms pulse train at 10, 25, 50, and 100 Hz stimulation frequencies. Blue arrow indicates the initial stimulus response, and the green arrow indicates the final stimulus response. D. Bar plots indicating no statistically significant differences between the mean spinal ECAP AUC values from the initial stimulation pulse (blue) and the final stimulation pulse (green). Error bars indicate standard deviation. E. Bar plots indicating statistically significant increases in mean gastrocnemius EMG AUC values from the initial stimulation pulse compared to the final stimulation pulse. * - statistical significance, where p <0.05, NS – Non-Significant, EMG – Electromyography, ECAP – Evoked Compound Action Potential, AUC – Area Under the Curve
Figure 7:
Figure 7:. Spinal ECAP and EMG recruitment are both increased by ipsilateral stimulation.
A. Single trial data illustrating the temporal windows used to calculate the rectified area under the curve for the spinal ECAP (top) and EMG (bottom) The specific combinations of amplitude, recording channel and stimulating channel that evoked these responses are indicated by colored arrows in panels B, C, and D, respectively. B. Representative spinal ECAP recruitment curve during midline stimulation and stimulation lateral to the right of midline. Recording is from an electrode lateral to the right of midline, and the location is shown in the outlined box in panel C. C. Representative ECAP recruitment curves from the spinal ECAP collected on the rostral array, during stimulation at two sites on the caudal electrode array at a horizontal separation of 6.8 mm (the positions of the stimulating electrodes are illustrated on the left). The layout of the plots matches the organization of the electrode array contacts (e.g., the top left plot represents the spinal ECAPs from the top left contact on the rostral array, etc.) The x- and y-axes of all plots are the same as panel B. D. Representative muscle recruitment curves from EMG collected bilaterally from 4 of the 6 muscles, during stimulation at the same two sites used for panels B and C.
Figure 8:
Figure 8:. Ipsilateral spinal ECAP and EMG responses are correlated.
A. Comparison of the rectified area under the curve values between pairs of signals taken, one each, from the rostral electrode array and the EMG from the left and right lower extremity musculature across multiple stimulation configurations (same stimulation parameters as Figure 7). Individual dots represent the rectified area under the curve values from individual trials. The plots illustrate the lowest (left, green square) and highest (right, green circle) observed Spearman correlation coefficients across all pairs of rAUC values. B. Bar plots summarizing the Spearman’s correlation coefficient between all pairs of spinal ECAP (22 recording sites) and EMG (8 recording sites) rAUC, arranged according to the location of the recording site along the rostral electrode array (subplot positions mirror the layout of the recording array, e.g., the top left plot represents the spinal ECAPs from the top left contact on the rostral array.) and the location of the EMG sensor (color coded and positioned within each subplot). rAUC pairs whose correlation was significant (p < .005, corrected for multiple comparisons using the Holm-Bonferonni method) are indicated by significance stars above the corresponding bar (n = 56/176). The blue star and hexagon represent which spinal ECAP/EMG data were illustrated in panel A.

References

    1. Cameron T, Safety and efficacy of spinal cord stimulation for the treatment of chronic pain: a 20-year literature review, J. Neurosurg. Spine 100 (2004). 10.3171/spi.2004.100.3.0254. - DOI - PubMed
    1. Melzack R, Wall PD, Pain Mechanisms: A New Theory, Science (80-.). 150 (1965). 10.1126/science.150.3699.971. - DOI - PubMed
    1. Shealy CN, Mortimer JT, Reswick JB, Electrical inhibition of pain by stimulation of the dorsal columns: preliminary clinical report., Anesth. Analg 46 (1967) 489–491. 10.1213/00000539-196707000-00025. - DOI - PubMed
    1. Linderoth B, Spinal cord stimulation: A brief update on mechanisms of action, Eur. J. Pain Suppl 3 (2009). 10.1016/j.eujps.2009.07.003. - DOI
    1. Zhang TC, Janik JJ, Grill WM, Mechanisms and models of spinal cord stimulation for the treatment of neuropathic pain, Brain Res. 1569 (2014). 10.1016/j.brainres.2014.04.039. - DOI - PubMed