. 2022 Jul 1;132(13):e154152.
doi: 10.1172/JCI154152.

LFA-1 activation enriches tumor-specific T cells in a cold tumor model and synergizes with CTLA-4 blockade

Affiliations

LFA-1 activation enriches tumor-specific T cells in a cold tumor model and synergizes with CTLA-4 blockade

Amber Hickman et al. J Clin Invest. .

Abstract

The inability of CD8+ effector T cells (Teffs) to reach tumor cells is an important aspect of tumor resistance to cancer immunotherapy. The recruitment of these cells to the tumor microenvironment (TME) is regulated by integrins, a family of adhesion molecules that are expressed on T cells. Here, we show that 7HP349, a small-molecule activator of lymphocyte function-associated antigen-1 (LFA-1) and very late activation antigen-4 (VLA-4) integrin cell-adhesion receptors, facilitated the preferential localization of tumor-specific T cells to the tumor and improved antitumor response. 7HP349 monotherapy had modest effects on anti-programmed death 1-resistant (anti-PD-1-resistant) tumors, whereas combinatorial treatment with anti-cytotoxic T lymphocyte-associated protein 4 (anti-CTLA-4) increased CD8+ Teff intratumoral sequestration and synergized in cooperation with neutrophils in inducing cancer regression. 7HP349 intratumoral CD8+ Teff enrichment activity depended on CXCL12. We analyzed gene expression profiles using RNA from baseline and on treatment tumor samples of 14 melanoma patients. We identified baseline CXCL12 gene expression as possibly improving the likelihood or response to anti-CTLA-4 therapies. Our results provide a proof-of-principle demonstration that LFA-1 activation could convert a T cell-exclusionary TME to a T cell-enriched TME through mechanisms involving cooperation with innate immune cells.

Keywords: Cancer immunotherapy; Therapeutics.


Conflict of interest statement

Conflict of interest: UM is an employee, corporate officer, investor, and equity holder in 7 Hills Pharma, and a coinventor on patents or patent applications covering 7HP349 (US patent nos. 10,342,866, 10,709,780, 10,709,781, 10716849). 7 Hills Pharma has exclusive license to patents and patent applications covering 7HP349. PV, DGW, RJB and RVM are inventors on US patents covering 7HP349 (patent nos. 10,342,866, 10,709,780, 10,709,781, 10716849) licensed to 7 Hills Pharma and are investors and equity holders in 7 Hills Pharma. A Diab received institution research funds from Bristol Myers Squibb, Merck, Pfizer, Nektar Therapeutics, Idera Pharmaceuticals, and Apexigen and advisory board fees from Bristol Myers Squibb, Nektar Therapeutics, Idera Pharmaceuticals, Iovance Therapeutics, and Apexigen. WWO is an employee of Nektar Therapeutics and receives salary and equity-based remuneration. A Diab, WWO, and YH have served as consultants to 7 Hills Pharma. MAD has been a consultant to Roche/Genentech, Array, Pfizer, Novartis, BMS, GSK, Sanofi-Aventis, Vaccinex, Apexigen, Eisai, Iovance, and ABM Therapeutics and has been the principal investigator for research grants to MD Anderson by Roche/Genentech, GSK, Sanofi-Aventis, Merck, Myriad, Oncothyreon, and ABM Therapeutics.

Figures

Figure 1
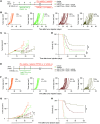
Figure 1. 7HP349 increases antitumor response to CTLA-4 blockade.
(See Supplemental Figures 1–3). (AD) Female C57BL/6 mice received i.d. GVAX with i.p. anti–CTLA-4 3 days after B16.BL6 injection or i.t. vehicle or i.t. 7HP349 4 weeks (2 × weekly) after tumor injection, as indicated. (A) Treatment schematic. (B) Tumor growth curves of biologically independent mice by treatment group. (C) Average tumor burden (mean ± SEM). (D) Overall survival of the indicated treatment groups. **P < 0.05, log-rank test. (EH) Mice were treated as in A but with systemic i.p. administration of 7HP349 or vehicle for 4 weeks (5 × weekly), as indicated. (E) Treatment schematic. (F) Tumor growth curves of biologically independent mice by treatment group. (G) Average tumor burden (mean ± SEM). **P < 0.01, nonparametric ANOVA, Kruskal-Wallis test. (H) Kaplan-Meier survival curve. **P < 0.01, log-rank test. Data are pooled from 2 independent experiments.
Figure 2
Figure 2. 7HP349 enhances T cell adhesion, cell spreading, and costimulation.
(See Supplemental Figures 4 and 5). (AD) Purified T cell adhesion to indicated concentrations of plastic immobilized ligands VCAM-1 or ICAM-1. Data are represented as mean ± SD. ***P ≤ 0.001, Tukey’s test. (E) 7HP349 (30 μM) induced purified integrin α4β1 binding to ligand CS-1 (n = 3). (F) 7HP349 (10 μM) induced HSB cell spreading on α4β1 ligand VCAM-1. (n = 3) (G) Proliferation assays were performed with purified human T cells with mAb OKT3 and ICAM-1 immobilized at 5 ng/well and 200 ng/well, respectively (n = 6). Veh, vehicle. (H) IL-2 measurements were made by Elisa from supernatants collected from proliferation assays (n = 6). (I) T cell proliferation in the presence of 10 μg/mL function blocking mAb (n = 3) and control IgG. Data are represented as mean ± SD. **P ≤ 0.01; ***P ≤ 0.001; ****P ≤ 0.0001, Tukey’s test.
Figure 3
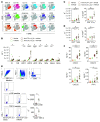
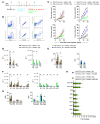
Figure 3. 7HP349 treatment affects tumor myeloid and lymphoid cell composition.
(See Supplemental Figures 6-9). Mice bearing 3-day s.c. B16.BL6 tumor received 7HP349 i.p. or vehicle or GVAX i.d. with anti–CTLA-4 i.p., as described in Figure 1E. Tumors were harvested 21 days after injection. (A) t-SNE plots of CD45+ B16.BL6 tumor-infiltrating myeloid cells with expression of selected markers. (B) Frequencies of myeloid cell subsets, adjusted per tissue weight (g–1) across treatment groups (n = 5). (C) Frequency of CD8+ Teffs (CD44hiCD11ahi), adjusted per tissue weight (g–1) (n = 7), or percentage of IFN-γ+ polyclonal CD8+ Teffs (n = 5). (D) Frequency of CD4+ Teffs (CD44hiCD11ahi), adjusted per tissue weight (mg–1) (n = 7), or percentage of IFN-γ+ polyclonal CD4+ Teffs in tumor (n = 5). (E) CD8+IFN-γ+ p15E- or TRP-2–specific Teffs (mean ± SEM), adjusted per tissue weight (g–1) (n = 5, *P < 0.05, unpaired t test). (F) Cytokine and chemokine concentrations in supernatant from tumors (n = 10–12). Data in BD and F are represented as mean ± SEM. Analyses were performed using 1-way ANOVA, Tukey’s test. *P < 0.05.
Figure 4
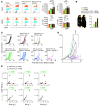
Figure 4. 7HP349 enhances CD8+ Teff preferential localization to tumor.
(See Supplemental Figures 10–12). (A) Mice were treated as in Figure 3A. LFA-1 expression on CD8+ or CD4+ Teffs from tumor and spleen tissues (n = 5). Data are represented as mean ± SEM, 1-way ANOVA, Tukey’s test. *P < 0.05; **P < 0.01; ***P < 0.001; ****P < 0.0001. (B) Vitiligo expression in mice (left) and the percentage of mice with vitiligo (right). (C and D) C57BL/6 mice bearing 3-day-old s.c. B16.BL6 tumors received i.p. 7HP349 or vehicle or i.d. GVAX with i.p. anti–CTLA-4, as described in Figure 1E, and mAb depletion of CD8+ T cells or NK cells on days 3, 5, 7, 9, and 11 after tumor injection (n = 10). (C) Tumor growth curves of biologically independent mice by treatment group. (D) Average tumor burden (mean ± SEM) for mice treated with anti–CTLA-4_GX plus vehicle (IgG versus anti-CD8, ****P < 0.0001) or anti–CTLA-4_GX plus 7HP349 (IgG versus anti-CD8, **P < 0.01), 1-way ANOVA, Tukey’s test. (E) Correlation analysis of granulocytes, IMs, or M1 macrophages versus CD8+ Teffs from tumors of mice treated with anti–CTLA-4 and 7HP349 or vehicle (n = 6).
Figure 5
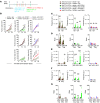
Figure 5. VCAM-1 blockade induces enhancement of DC homing to the TME.
(See Supplemental Table 1). Mice bearing 3-day s.c. B16.BL6 received anti–CTLA-4 therapy and 7HP349 or vehicle and/or anti-ICAM-1, anti-VCAM-1, or IgG, as indicated. (A) Experimental schematic. (B) Average tumor burden after IgG, anti–VCAM-1, or anti–ICAM-1 treatment (n = 10). Data are represented as mean ± SEM, 1-way ANOVA, Tukey’s test. *P < 0.05; **P < 0.01; ****P < 0.0001. (C) Frequency of CD8+ or CD4+ Teffs and Tregs adjusted per tissue weight (mg–1) in mice after IgG, anti–VCAM-1, or anti–ICAM-1 treatment (n = 6). (D) CD4+ Teff/Treg and CD8+ Teff/Treg ratios following IgG, anti-VCAM-1, or anti–ICAM-1 treatment (n = 6). (E) Frequency of IMs, M1 macrophages (M1Ф), pDC, cDC1, and cDC2 adjusted per tissue weight (mg–1) in mice after IgG, anti–VCAM-1, or ICAM-1 treatment (n = 6). (F) cDC2/Treg, cDC2/M2 macrophage, cDC2/granulocyte, and cDC2/monocyte ratios after IgG, anti–VCAM-1, or anti–ICAM-1 treatment (n = 6). (G) M1 macrophages/M2 macrophages (M2Ф) and IM/M2 macrophage ratios after IgG, anti–VCAM-1, or anti–ICAM-1 treatment (n = 6). Data shown in CG are represented as mean ± SEM. Analyses were performed using unpaired t test. *P < 0.05; **P < 0.01; ***P < 0.001; ****P < 0.0001.
Figure 6
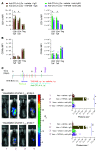
Figure 6. Neutrophils are critical for CD8+ Teff antitumor response in 7HP349-treated mice.
(See Supplemental Figure 13). Mice bearing 3-day s.c. B16-BL6 melanomas received anti–CTLA-4 therapy and 7HP349 or vehicle and/or anti-Ly6G mAb or IgG, as indicated. (A) Experimental schematic. (B) Flow cytometry analysis showing anti-Ly6G mAb depletion of neutrophils at day 5 in PBMCs. FSC-A, forward scatter–A; FSC-H, forward scatter–H. (C) Average tumor burden in mice (n = 10) after IgG or anti-Ly6G treatment. Data are represented as mean ± SEM.One-way ANOVA, Tukey’s test. *P < 0.05; **P < 0.01. (D) Frequency of CD8+ or CD4+ Teffs and Tregs, adjusted per tissue weight (mg–1) in mice after IgG or anti-Ly6G treatment (n = 6). (E) CD8+ Teff/Treg and CD4+ Teff/Treg ratios following IgG or anti-Ly6G treatment (n = 6). (F) Frequency of IMs, M1 macrophages, pDC, cDC1, and cDC2 adjusted per tissue weight (mg–1) in mice after IgG or anti-CXCL12 treatment (n = 6). (G) cDC2/Tregs, cDC2/M2 macrophage, cDC2/granulocyte, or cDC2/monocyte ratios after IgG or anti-Ly6G treatment (n = 6). (H) Immune cell sequestration fold increase at the TME after IgG or anti-Ly6G treatment (n = 5). Data are represented as mean ± SEM. Data analyses (DG) were performed using unpaired t test. *P < 0.05.
Figure 7
Figure 7. CD8+ Teff i.t. sequestration is dependent on neutrophils in 7HP349-treated mice.
(A) Mice treated as in Figure 6A. CD11a expression on CD8+ and CD4+ Teff after IgG or anti-Ly6G treatment (n = 6). (B) CD49d expression on CD8+ and CD4+ Teffs after IgG or anti-Ly6G treatment (n = 6). Data in A and B are represented as mean ± SEM. *P < 0.05, unpaired t test. (C and D) Mice bearing 4-day s.c. B16 tumors received 6-day–cultured V-effLuc–transduced pmel-1 T cells i.v. after vaccination with gp100/saline and anti–CTLA-4 i.p. and/or 7HP349, vehicle, IgG, or anti-Ly6G, as indicated. (C) Treatment schematic. (D) V-effLuc–transduced pmel-1 T cells are visualized by whole mouse imaging 4 days (top panel) and 7 days (bottom panel) after vaccination. Combination of bar and dot plots showing absolute pmel-1 T cell luminescence (photons s–1). Data are represented as mean ± SEM. n = 5. Analyses were performed using 1-way ANOVA, Tukey’s test. *P < 0.05; **P < 0.01.
Figure 8
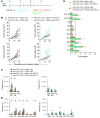
Figure 8. CXCL12 is required for CD8+ Teff i.t. sequestration.
(See Supplemental Figures 14 and 15). Mice bearing 3-day s.c. B16-BL6 melanomas received anti–CTLA-4 therapy and 7HP349 or vehicle and/or anti-CXCL12 or IgG, as indicated. (A) Treatment schematic. (B) Average tumor burden in mice (n = 10) after IgG or anti-CXCL12 treatment. Data are represented as mean ± SEM. One-way ANOVA, Tukey’s test. *P < 0.05; **P < 0.01. (C) Frequency of CD8+ Teffs, CD4+ Teffs, and Tregs adjusted per tissue weight (mg–1) in mice after IgG or anti-CXCL12 treatment (n = 6). (D) Frequency of IMs, M1 macrophages, M2 macrophages, pDC, cDC1, and cDC2 adjusted per tissue weight (mg–1) in mice after IgG or anti-CXCL12 treatment (n = 6). (E) Immune cell sequestration fold increase at the TME after IgG or anti-CXCL12 treatment (n = 6). Data in C and D are represented as mean ± SEM. Analyses were performed using unpaired t test. *P < 0.05.
Figure 9
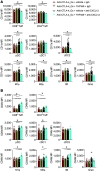
Figure 9. CXCL12 is required for LFA-1 activation at the TME in 7HP349-treated mice.
Mice were treated as in Figure 8A. (A) CD11a (αL) integrin expression (n = 5) on leukocytes at the TME, as determined by a flow cytometry analysis following IgG or anti-CXCL12 treatment (n = 6). (B) CD49d (α4) integrin expression on leukocytes at the TME, as determined by a flow cytometry analysis following IgG or anti-CXCL12 treatment (n = 6). Data are represented as mean ± SEM. Analyses were performed using 1-way ANOVA, Tukey’s test. *P < 0.05.
Figure 10
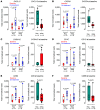
Figure 10. CXCL12 gene expression signatures predict response to CTLA-4 checkpoint blockade in melanoma.
Human cancer patients (n = 14) are stratified based upon best overall response (BOR), as indicated in each graph. Individual gene expression changes between baseline and on-treatment 8 weeks after treatment with ipilimumab and tilsotolimod (TLR9 agonist). Box plots show individual gene normalized expression at baseline and week 8 in the local injected lesions. (A) CXCL12; (B) CXCR4; (C) S100A12; (D) CD1C; (E) CD8A; (F) CD8B. P values indicate significance using parametric t test (left panels) and nonparametric test (right panels). Data are presented as median, and whiskers on the box plots extend minimum to maximum points. The top and bottom lines of the box plots represent the interquartile range (IQR), the midline represents the median, and the whiskers on the box plots represent minimum and maximum values. Data analyses were performed for responders (Res) and nonresponders (nRes). Baseline versus on-treatment, paired t test; baseline alone, unpaired t test.
Figure 11
Figure 11. 7HP349 preserves immunological memory upon tumor rechallenge.
C57BL/6 mice, 3 days after s.c. injection with 3 × 10⁴ B16.BL6 cells, received 7HP349 or vehicle i.p. at days 3, 4, 5, 6, and 7 with GVAX i.d. and anti–CTLA-4 i.p. at days 3, 5, 7, and 9. PBMCs, VdLN, and spleen were harvested on day 100. (A) Experimental schematic shows the initial treatment schedule as well as the timing of the rechallenge. (BE) The figure shows representative mice from each group. Age-matched naive, n =10; vehicle treated, n = 9; 7HP349 treated n = 10. (B) Tumor burden in age-matched treatment-naive control mice, (C) vehicle-treated mice, (D) and 7HP349-treated mice. (E) Kaplan-Meier survival curve. *P < 0.05; ***P < 0.001, log-rank test. (FH) CD8+ central memory cells (TCM) in PBMCs, spleen, and VdLN (n = 5). (IK) CD8+ IFN-γ+ T cells in PBMCs, spleen, and VdLN (n = 5). Data in FK are represented as mean ± SEM. Analyses were performed using unpaired t test. *P < 0.05.

References

    1. Sharma P, Allison JP. The future of immune checkpoint therapy. Science. 2015;348(6230):56–61. doi: 10.1126/science.aaa8172. - DOI - PubMed
    1. Rosenberg SA, et al. Tumor progression can occur despite the induction of very high levels of self/tumor antigen-specific CD8+ T cells in patients with melanoma. J Immunol. 2005;175(9):6169–6176. doi: 10.4049/jimmunol.175.9.6169. - DOI - PubMed
    1. Tumeh PC, et al. PD-1 blockade induces responses by inhibiting adaptive immune resistance. Nature. 2014;515(7528):568–571. doi: 10.1038/nature13954. - DOI - PMC - PubMed
    1. Gajewski TF, et al. Cancer immunotherapy targets based on understanding the T cell-inflamed versus non-T cell-inflamed tumor microenvironment. Adv Exp Med Biol. 2017;1036:19–31. doi: 10.1007/978-3-319-67577-0_2. - DOI - PMC - PubMed
    1. Krummel MF, et al. T cell migration, search strategies and mechanisms. Nat Rev Immunol. 2016;16(3):193–201. doi: 10.1038/nri.2015.16. - DOI - PMC - PubMed

Publication types

MeSH terms

Substances