. 2022 Jun 22;7(12):e157215.
doi: 10.1172/jci.insight.157215.

CXCL13-producing CD4+ T cells accumulate in the early phase of tertiary lymphoid structures in ovarian cancer

Affiliations

CXCL13-producing CD4+ T cells accumulate in the early phase of tertiary lymphoid structures in ovarian cancer

Masayo Ukita et al. JCI Insight. .

Abstract

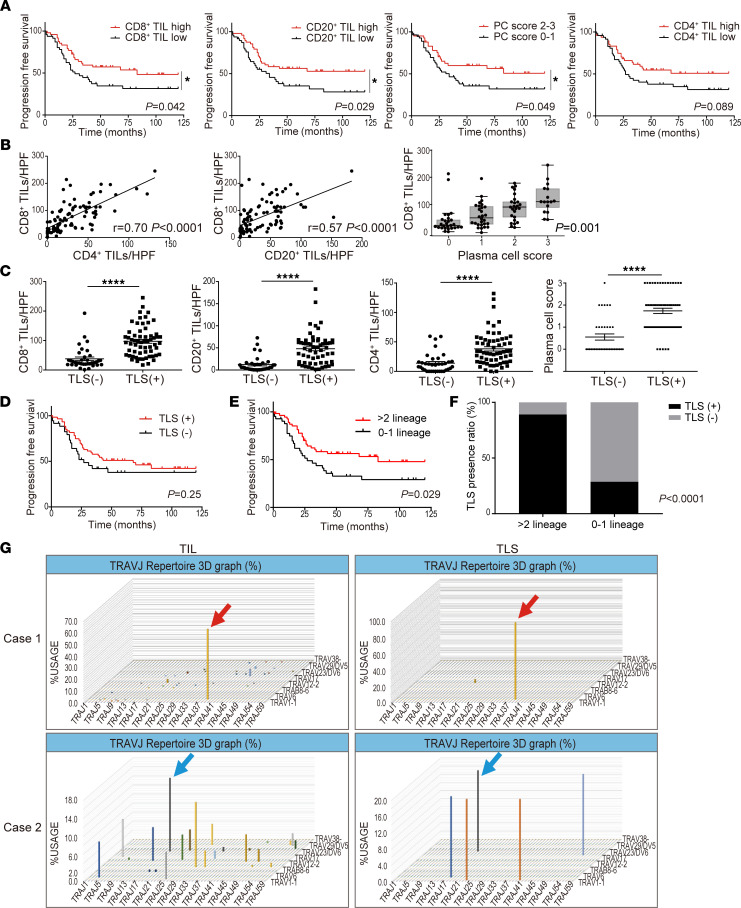
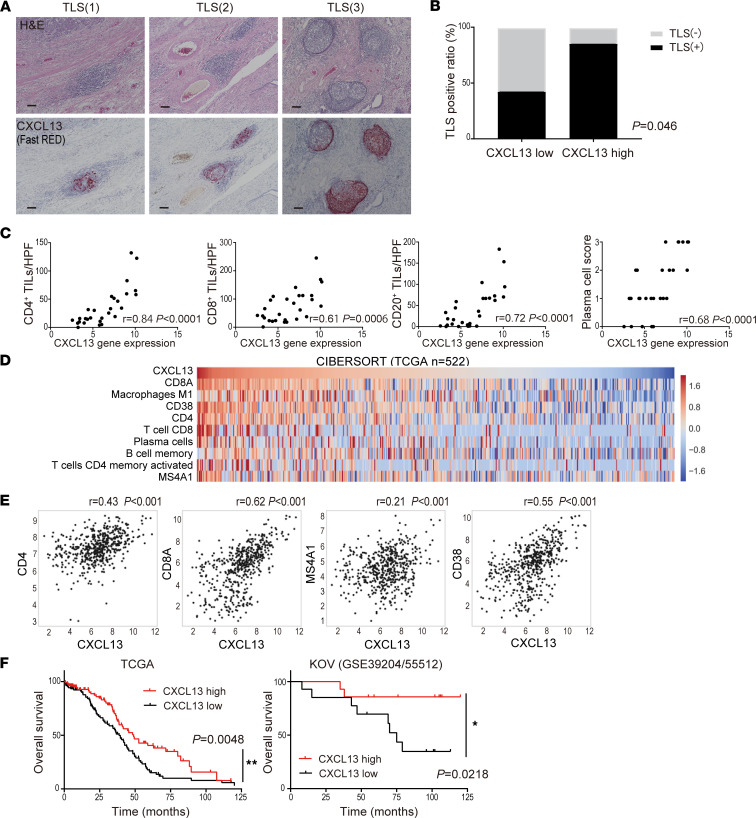
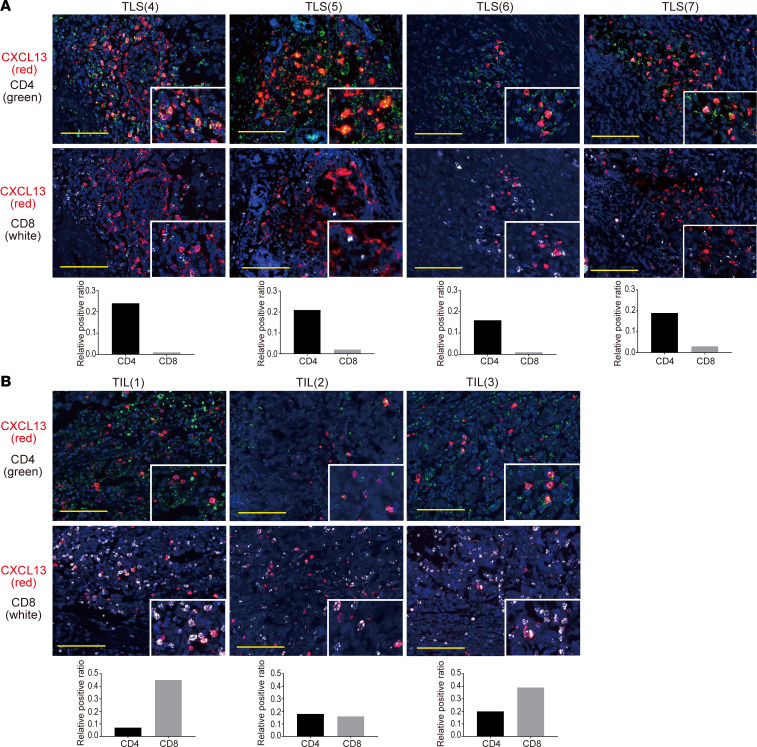
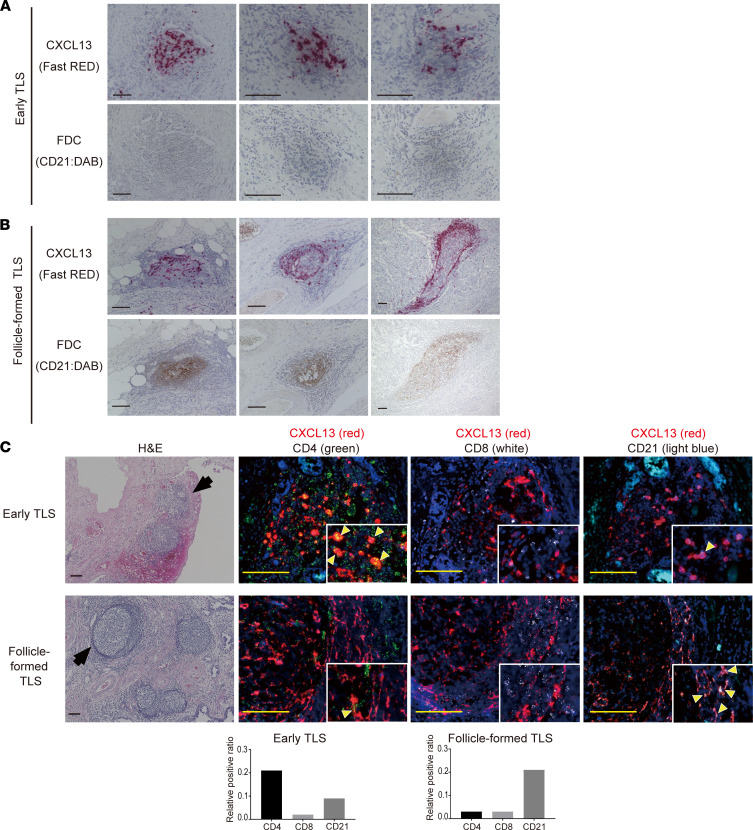
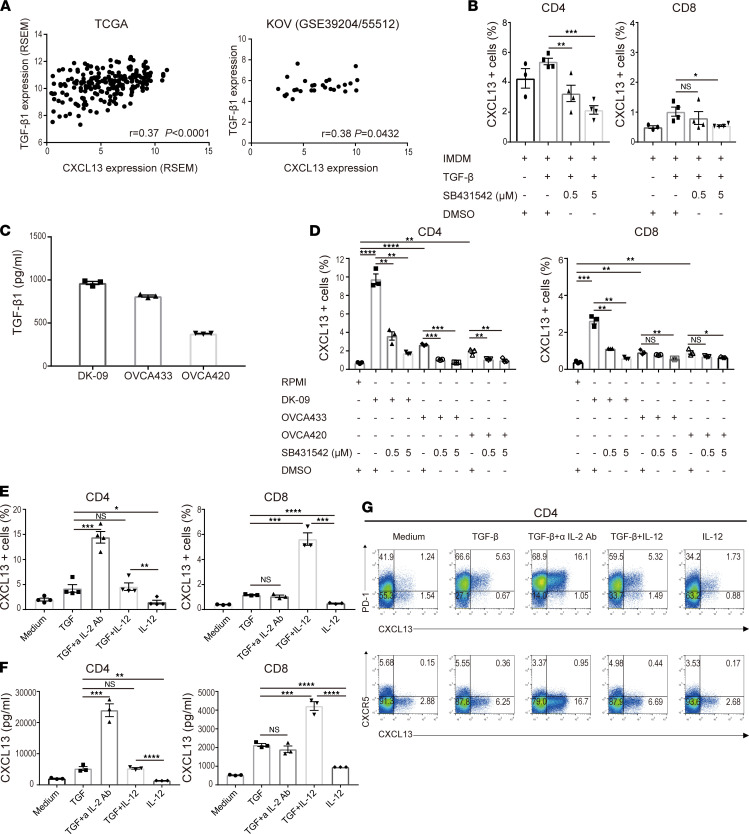
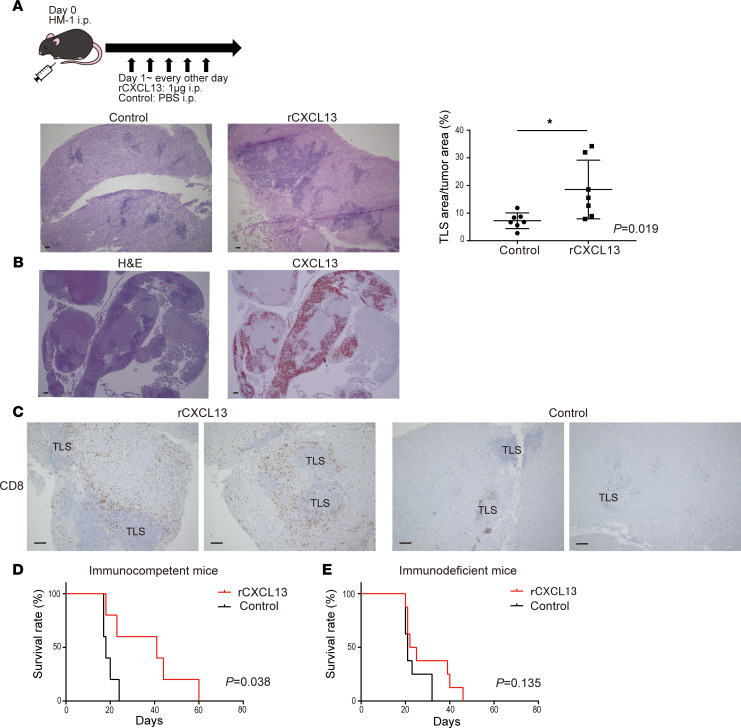
Tertiary lymphoid structures (TLS) are transient ectopic lymphoid aggregates whose formation might be caused by chronic inflammation states, such as cancer. However, how TLS are induced in the tumor microenvironment (TME) and how they affect patient survival are not well understood. We investigated TLS distribution in relation to tumor infiltrating lymphocytes (TILs) and related gene expression in high-grade serous ovarian cancer (HGSC) specimens. CXCL13 gene expression correlated with TLS presence and the infiltration of T cells and B cells, and it was a favorable prognostic factor for patients with HGSC. Coexistence of CD8+ T cells and B cell lineages in the TME significantly improved the prognosis of HGSC and was correlated with the presence of TLS. CXCL13 expression was predominantly coincident with CD4+ T cells in TLS and CD8+ T cells in TILs, and it shifted from CD4+ T cells to CD21+ follicular DCs as TLS matured. In a mouse ovarian cancer model, recombinant CXCL13 induced TLS and enhanced survival by the infiltration of CD8+ T cells. These results suggest that TLS formation was associated with CXCL13-producing CD4+ T cells and that TLS facilitated the coordinated antitumor response of cellular and humoral immunity in ovarian cancer.

Keywords: Adaptive immunity; Cancer; Immunology; Obstetrics/gynecology; Oncology.


Conflict of interest statement

Conflict of interest: The authors have declared that no conflict of interest exists.

Figures

Figure 1
Figure 1. Intratumor infiltration of T cells and B cell lineages improves the prognosis of ovarian cancer and is associated with the presence of TLS.
(A) Progression-free survival of the cohort stratified by respective infiltration of T and B cell subsets (n = 97, each). (B) Association between infiltrated numbers of CD4+ T cells and CD8+ T cells, and CD8+ T cells and B cell lineage s in tumors (n = 97). Correlations were determined by Pearson’s correlation test and Jonckheere-Terpstratrend tests. The y axis represent the mean count of 5 HPFs. (C) Characterization of the immune infiltrate in tumors according to TLS presence (TLS, n = 36; TLS+, n = 61). P values were determined by Mann-Whitney U test. (D) Progression-free survival of patients with HGSC related to the presence of TLS. (E) Progression-free survival based on lymphocyte infiltration pattern (>2 lineages, n = 55; 0–1 lineage, n = 42). Analyses were performed with Kaplan-Meier estimates and log-rank tests in A, D, and E. (F) TLS presence ratio based on lymphocyte infiltration patterns. Analysis was performed by Fisher’s exact test. (G) TCR repertoire analysis separating TLS and TIL regions. The horizontal axis represents the J gene, the depth represents the V gene, and the vertical axis represents the frequency of usage. Clones indicated by arrows of the same color confirm the same amino acid sequence of CDR3.
Figure 2
Figure 2. CXCL13 gene expression in tumors is significantly correlated with the presence of TLS, lymphocyte infiltration, and a favorable prognosis for ovarian cancer.
(A) Representative TLS in tissues stained by H&E and CXCL13 (Fast RED) by RNA ISH. Scale bars: 100 μm. (B) TLS presence ratio based on CXCL13 gene expression. Analysis by Fisher’s exact test in 28 cases with microarray data. (C) Characterization of the immune infiltrate in tumors according to CXCL13 gene expression (n = 28). Correlation was determined by Spearman’s correlation test. (D) The distribution of infiltrating immune cells into the tumor site and CXCL13 gene expression using CIBERSORT (n = 522). (E) Correlation of CXCL13 gene expression with CD4, CD8A, MS4A1, and CD38 in CIBERSORT. Correlation was determined by Spearman’s correlation test. (F) Overall survival of patients with HGSC by CXCL13 gene expression (TCGA, n = 217; KOV, n = 28). Patients with CXCL13hi defined if CXCL13 gene expression was above the median. Analyses were performed with Kaplan-Meier estimates and log-rank tests. The level of significance was set as *P < 0.05 and **P < 0.01.
Figure 3
Figure 3. CXCL13 is mainly produced by CD4+ T cells in TLS.
(A) Fluorescent double staining of CXCL13 (red) and CD4 (green), and CXCL13 (red) and CD8 (white) by RNA ISH in TLS. Images of 4 representative TLS are shown. (B) Fluorescent double staining of CXCL13 (red) and CD4 (green), and CXCL13 (red) and CD8 (white) by RNA ISH in TIL. The upper and lower pictures are representative TIL images from the same patient. Nuclei are stained with DAPI (blue). Scale bars: 100 μm. Colocalization of CXCL13 with CD4 or CD8 is shown in the bar graph as the relative positive ratio quantified using BZ-H4C/hybrid cell count software.
Figure 4
Figure 4. The source of CXCL13 production in TLS shifts to CD21+ FDC with the maturation of TLS.
(A) Representative images of early TLS. Upper panels show CXCL13 (RNA ISH, Fast RED) and lower panels show FDC (CD21 IHC, DAB). (B) Representative images of follicle-formed TLS. The middle panel is the same case as TLS(2), found in Figure 2A, which shows one of the most typical Follicle-formed TLS. The presence of CD21+ FDC is shown in the bottom panel. (C) Fluorescence double staining of CXCL13 (red) and CD4 (green), CXCL13 (red) and CD8 (white), and CXCL13 (red) and CD21 (light blue) in representative early TLS and follicle-formed TLS. The same Early TLS shown in Figure 3A was used to show the cell source of CXCL13 expression. Nuclei are stained with DAPI (blue). Scale bar: 100 μm. Colocalization of CXCL13 with CD4, CD8, or CD21 is shown in the bar graph as the relative positive ratio quantified using BZ-H4C/hybrid cell count software.
Figure 5
Figure 5. TGF-β promotes the production of CXCL13.
(A) Correlation between CXCL13 and TGF-β1 expression in TCGA (n = 217) and KOV (n = 28). Correlation was determined by Spearman’s correlation test. (B) Human naive CD4+ and CD8+ T cells from a healthy donor were differentiated by TCR stimulation and TGF-β1 in the presence or absence of a TGF signal inhibitor, SB431542. The proportion of CXCL13+ cells was determined by flow cytometry. Data are shown as the mean ± SEM (n = 3–4). Statistical significance was determined by 2-tailed Student’s t test. *P < 0.05, **P < 0.01, and ***P < 0.001. (C) The concentration of TGF-β1 in conditioned medium obtained from 3 human ovarian cancer cell lines was measured by ELISA. Data are shown as the mean ± SEM (n = 3). (D) Human naive CD4+ and CD8+ T cells from a healthy donor were differentiated with TCR stimulation and conditioned medium obtained from 3 human ovarian cancer cell lines in the presence or absence of a TGF signal inhibitor, SB431542. The proportion of CXCL13+ cells was determined by flow cytometry. Data are shown as the mean ± SEM (n = 3). (EG) Human naive CD4+ and CD8+ T cells from a healthy donor were differentiated with TCR stimulation and the indicated cytokines. The proportion of CXCL13+ cells was determined by flow cytometry (E). The concentration of CXCL13 in the culture supernatant was measured by ELISA (F). Data are shown as the mean ± SEM (n = 3–4). Statistical significance was determined by 2-tailed Student’s t test. *P < 0.05, **P < 0.01, ***P < 0.001, ****P < 0.0001. Representative dot plots of PD-1 (upper row), CXCR5 (lower row), and intracellular CXCL13 in healthy human naive CD4+ T cells are shown (G).
Figure 6
Figure 6. Mouse rCXCL13 induces TLS in tumors and prolongs survival.
(A) Mouse rCXCL13 was administered i.p. to induce TLS in a mouse ovarian cancer model. Representative H&E images of TLS formed in an omental tumor. The area of TLS per tumor area was compared between the control group and the rCXCL13 treated group (n = 7, each). Statistical significance was determined by 2-tailed Student’s t test. *P < 0.05. (B) TLS induced by mouse rCXCL13 (H&E) and expression of mouse CXCL13 corresponding to TLS (RNA ISH, Fast RED). (C) CD8+ T cell IHC images (DAB) in the rCXCL13-treated group and control group. Scale bars: 100 μm. (D and E) The effect of rCXCL13 administration on the survival of tumor-bearing mice was compared between immunocompetent mice (D) and immunodeficient mice (E). Analyses were performed using Kaplan-Meier estimates and log-rank tests.

References

    1. Mellman I, et al. Cancer immunotherapy comes of age. Nature. 2011;480(7378):480–489. doi: 10.1038/nature10673. - DOI - PMC - PubMed
    1. Zhang L, et al. Intratumoral T cells, recurrence, and survival in epithelial ovarian cancer. N Engl J Med. 2003;348(3):203–213. doi: 10.1056/NEJMoa020177. - DOI - PubMed
    1. Fridman WH, et al. The immune contexture in cancer prognosis and treatment. Nat Rev Clin Oncol. 2017;14(12):717–734. doi: 10.1038/nrclinonc.2017.101. - DOI - PubMed
    1. Hamanishi J, et al. Programmed cell death 1 ligand 1 and tumor-infiltrating CD8+ T lymphocytes are prognostic factors of human ovarian cancer. Proc Natl Acad Sci U S A. 2007;104(9):3360–3365. doi: 10.1073/pnas.0611533104. - DOI - PMC - PubMed
    1. Abiko K, et al. PD-L1 on tumor cells is induced in ascites and promotes peritoneal dissemination of ovarian cancer through CTL dysfunction. Clin Cancer Res. 2013;19(6):1363–1374. doi: 10.1158/1078-0432.CCR-12-2199. - DOI - PubMed

Publication types