

Transcriptome analysis of clock disrupted cancer cells reveals differential alternative splicing of cancer hallmarks genes
- PMID: 35552415
- PMCID: PMC9098426
- DOI: 10.1038/s41540-022-00225-w
Transcriptome analysis of clock disrupted cancer cells reveals differential alternative splicing of cancer hallmarks genes
Abstract
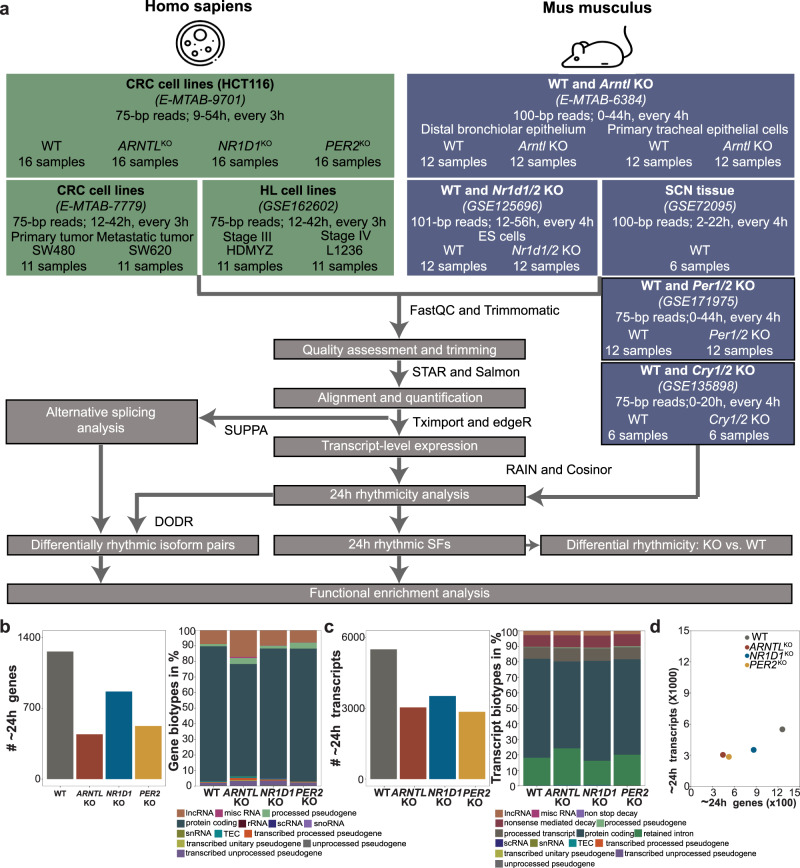
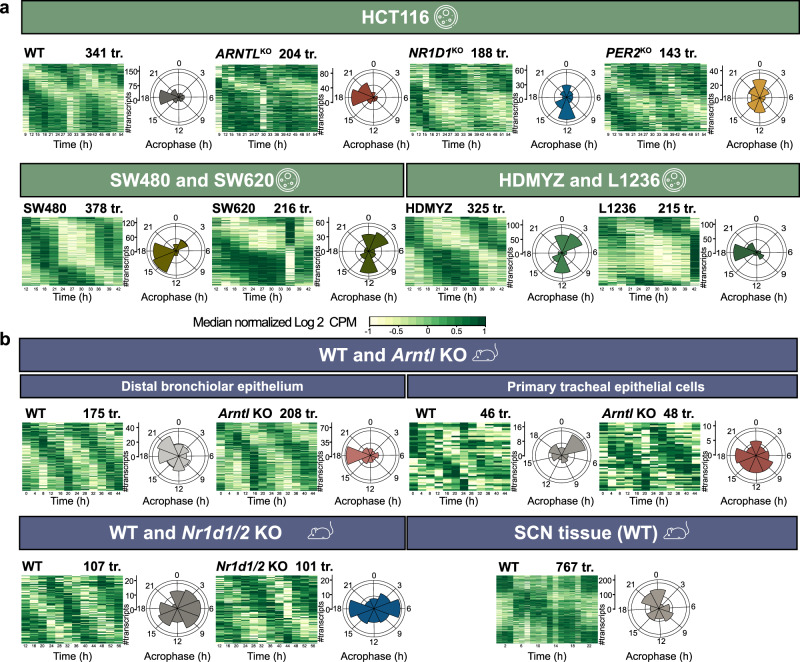
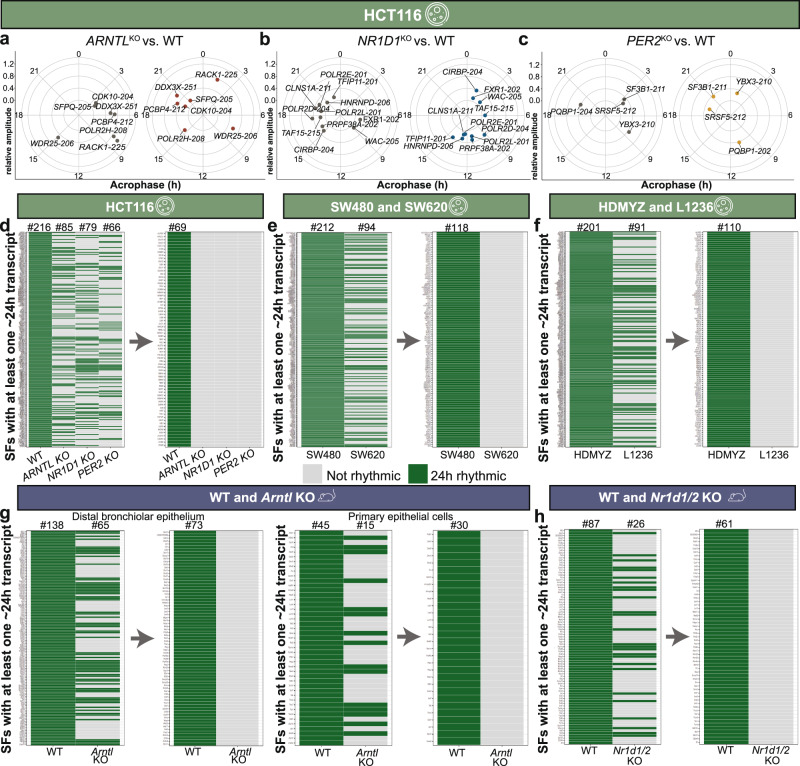
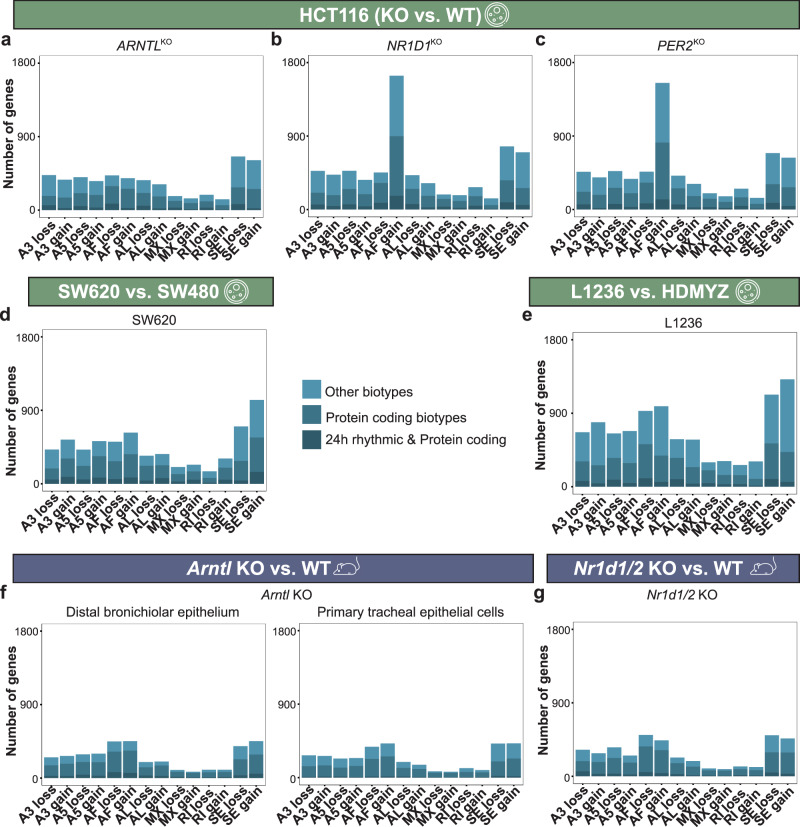
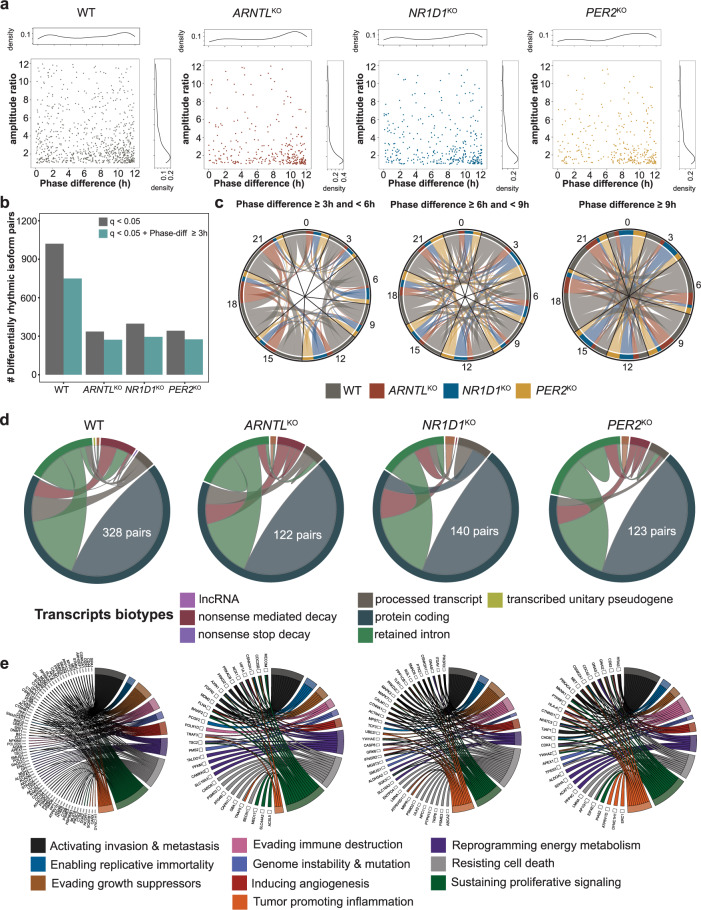
Emerging evidence points towards a regulatory role of the circadian clock in alternative splicing (AS). Whether alterations in core-clock components may contribute to differential AS events is largely unknown. To address this, we carried out a computational analysis on recently generated time-series RNA-seq datasets from three core-clock knockout (KO) genes (ARNTL, NR1D1, PER2) and WT of a colorectal cancer (CRC) cell line, and time-series RNA-seq datasets for additional CRC and Hodgkin's lymphoma (HL) cells, murine WT, Arntl KO, and Nr1d1/2 KO, and murine SCN WT tissue. The deletion of individual core-clock genes resulted in the loss of circadian expression in crucial spliceosome components such as SF3A1 (in ARNTLKO), SNW1 (in NR1D1KO), and HNRNPC (in PER2KO), which led to a differential pattern of KO-specific AS events. All HCT116KO cells showed a rhythmicity loss of a crucial spliceosome gene U2AF1, which was also not rhythmic in higher progression stage CRC and HL cancer cells. AS analysis revealed an increase in alternative first exon events specific to PER2 and NR1D1 KO in HCT116 cells, and a KO-specific change in expression and rhythmicity pattern of AS transcripts related to cancer hallmarks genes including FGFR2 in HCT116_ARNTLKO, CD44 in HCT116_NR1D1KO, and MET in HCT116_PER2KO. KO-specific changes in rhythmic properties of known spliced variants of these genes (e.g. FGFR2 IIIb/FGFR2 IIIc) correlated with epithelial-mesenchymal-transition signalling. Altogether, our bioinformatic analysis highlights a role for the circadian clock in the regulation of AS, and reveals a potential impact of clock disruption in aberrant splicing in cancer hallmark genes.
© 2022. The Author(s).
Conflict of interest statement
The authors declare no competing interests.
Figures

Similar articles
-
Core-Clock Genes Regulate Proliferation and Invasion via a Reciprocal Interplay with MACC1 in Colorectal Cancer Cells.Cancers (Basel). 2022 Jul 16;14(14):3458. doi: 10.3390/cancers14143458. Cancers (Basel). 2022. PMID: 35884519 Free PMC article.
-
A Systems-Level Analysis Reveals Circadian Regulation of Splicing in Colorectal Cancer.EBioMedicine. 2018 Jul;33:68-81. doi: 10.1016/j.ebiom.2018.06.012. Epub 2018 Jun 21. EBioMedicine. 2018. PMID: 29936137 Free PMC article.
-
Role of the Circadian Clock and Effect of Time-Restricted Feeding in Adenine-Induced Chronic Kidney Disease.Lab Invest. 2023 Jan;103(1):100008. doi: 10.1016/j.labinv.2022.100008. Lab Invest. 2023. PMID: 36748191
-
In Vitro Circadian Clock Gene Expression Assessments in Mesenchymal Stem Cells from Human Infants: A Pilot Study.Nutrients. 2023 Dec 23;16(1):52. doi: 10.3390/nu16010052. Nutrients. 2023. PMID: 38201882 Free PMC article.
-
Contribution of testosterone to the clock system in rat prostate mesenchyme cells.Andrology. 2014 Mar;2(2):225-33. doi: 10.1111/j.2047-2927.2013.00161.x. Epub 2013 Dec 10. Andrology. 2014. PMID: 24327317
Cited by
-
Prediction of lung adenocarcinoma prognosis and diagnosis with a novel model anchored in circadian clock-related genes.Sci Rep. 2024 Aug 6;14(1):18202. doi: 10.1038/s41598-024-68256-3. Sci Rep. 2024. PMID: 39107445 Free PMC article.
-
Differential expression of the circadian clock network correlates with tumour progression in gliomas.BMC Med Genomics. 2023 Jul 3;16(1):154. doi: 10.1186/s12920-023-01585-w. BMC Med Genomics. 2023. PMID: 37400829 Free PMC article.
-
Antiproliferative Effects of Cynara Cardunculus in Colorectal Cancer Cells Are Modulated by the Circadian Clock.Int J Mol Sci. 2022 Aug 15;23(16):9130. doi: 10.3390/ijms23169130. Int J Mol Sci. 2022. PMID: 36012399 Free PMC article.
References
Publication types
MeSH terms
Substances
LinkOut - more resources
Full Text Sources
Medical
Research Materials
Miscellaneous
