. 2022 Dec 9;50(22):12601-12620.
doi: 10.1093/nar/gkac332.

rRNA operon multiplicity as a bacterial genome stability insurance policy

Affiliations

rRNA operon multiplicity as a bacterial genome stability insurance policy

Sebastien Fleurier et al. Nucleic Acids Res. .

Abstract

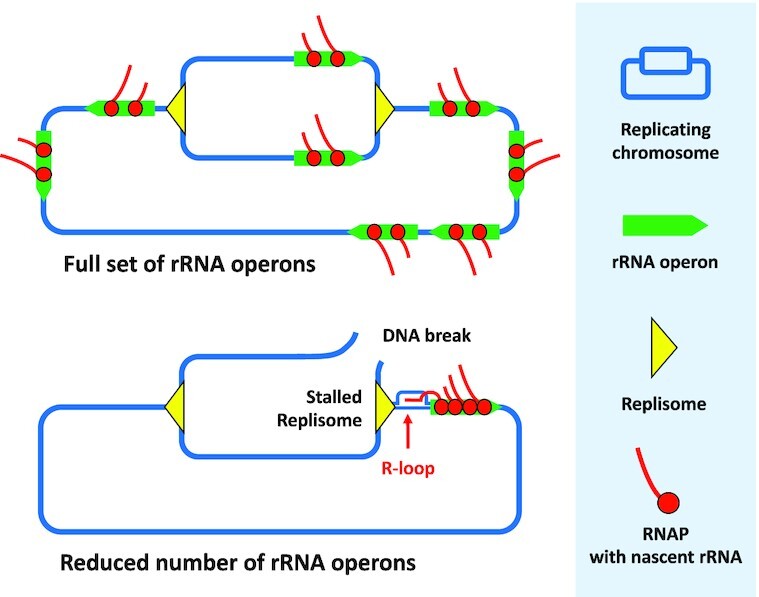
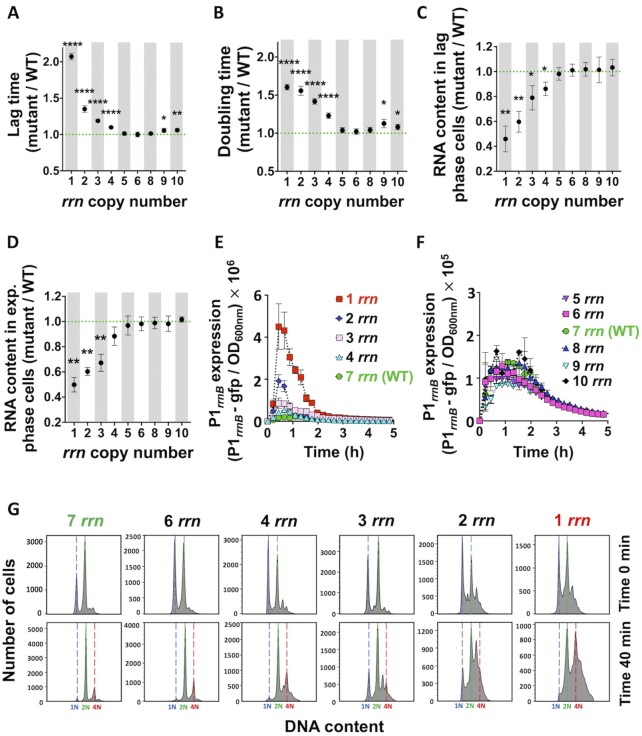
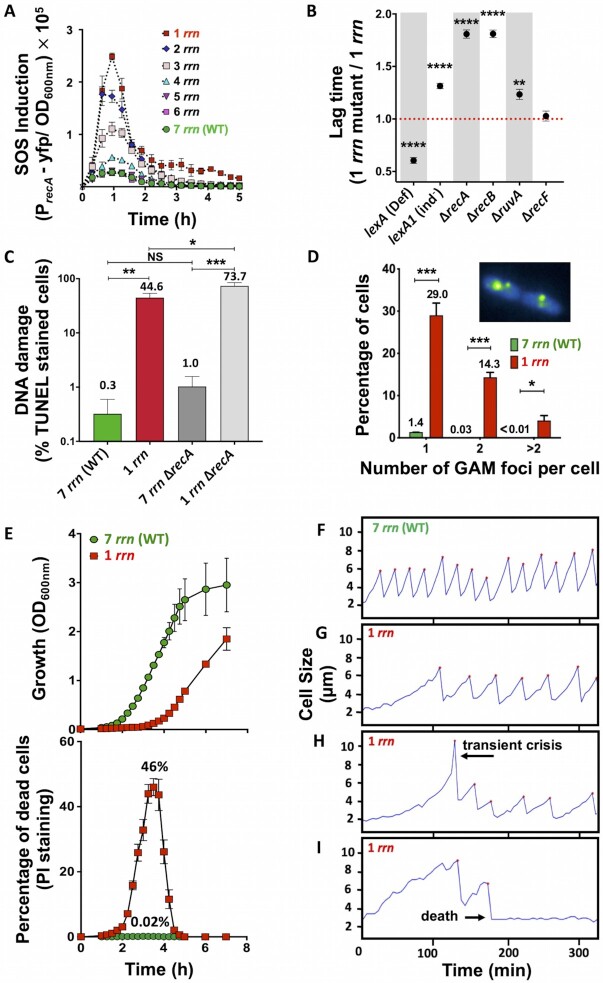
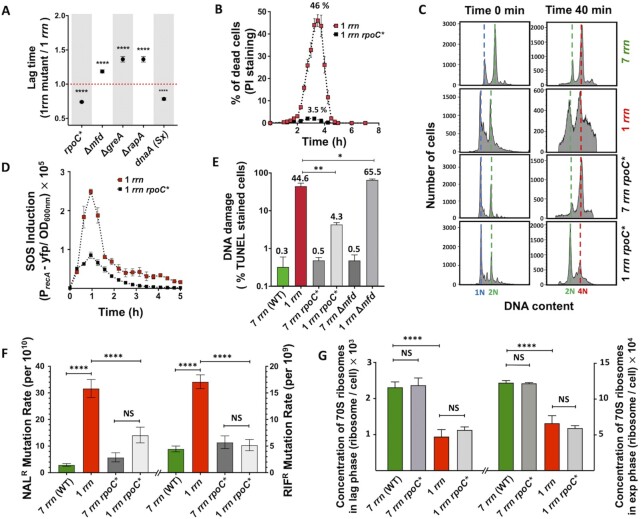
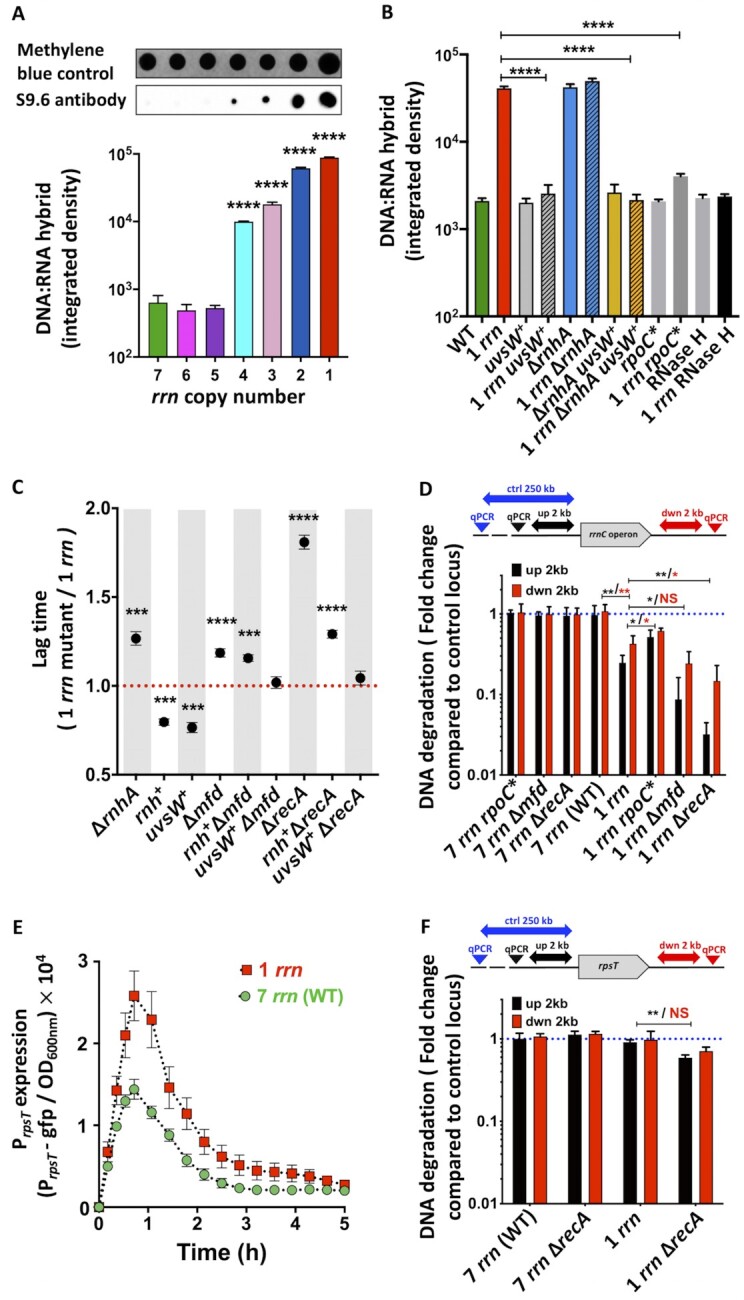
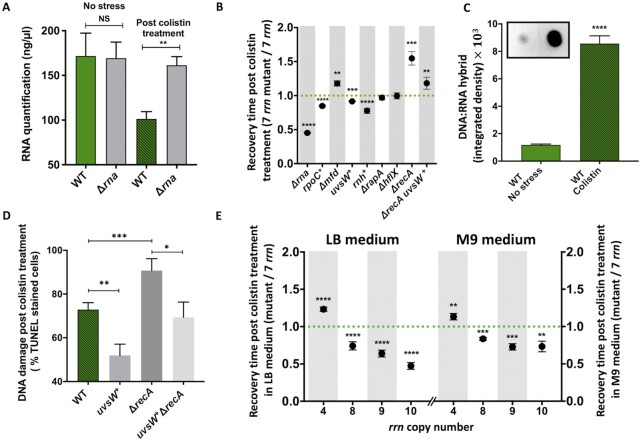
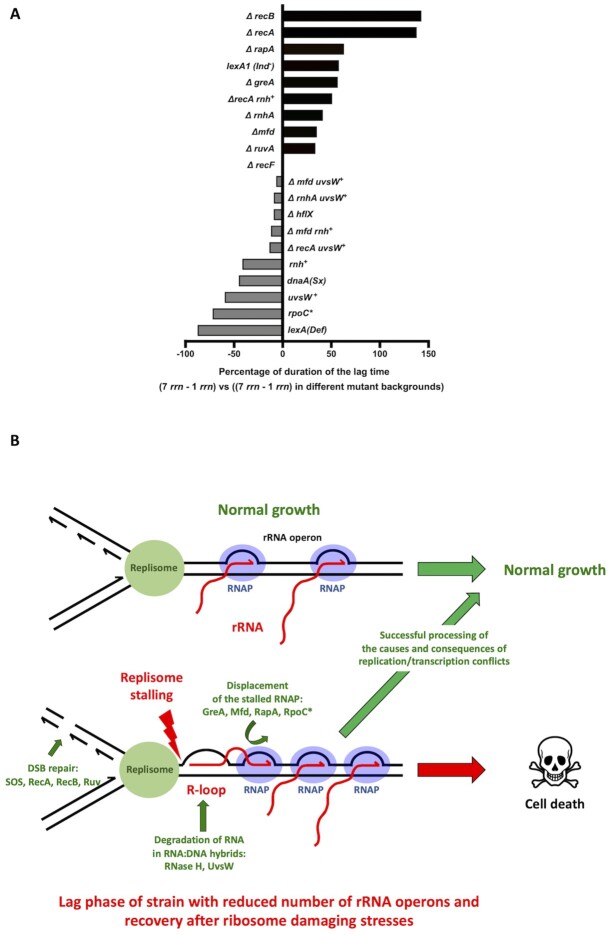
Quick growth restart after upon encountering favourable environmental conditions is a major fitness contributor in natural environment. It is widely assumed that the time required to restart growth after nutritional upshift is determined by how long it takes for cells to synthesize enough ribosomes to produce the proteins required to reinitiate growth. Here we show that a reduction in the capacity to synthesize ribosomes by reducing number of ribosomal RNA (rRNA) operons (rrn) causes a longer transition from stationary phase to growth of Escherichia coli primarily due to high mortality rates. Cell death results from DNA replication blockage and massive DNA breakage at the sites of the remaining rrn operons that become overloaded with RNA polymerases (RNAPs). Mortality rates and growth restart duration can be reduced by preventing R-loop formation and improving DNA repair capacity. The same molecular mechanisms determine the duration of the recovery phase after ribosome-damaging stresses, such as antibiotics, exposure to bile salts or high temperature. Our study therefore suggests that a major function of rrn operon multiplicity is to ensure that individual rrn operons are not saturated by RNAPs, which can result in catastrophic chromosome replication failure and cell death during adaptation to environmental fluctuations.

Plain language summary

The ability to modulate translation capacity, which resides greatly on a number of ribosomes, provides robustness in fluctuating environments. Because translation is energetically the most expensive process in cells, cells must constantly adapt the rate of ribosome production to resource availability. This is primarily achieved by regulating ribosomal RNA (rRNA) synthesis, to which ribosomal proteins synthesis is adjusted. The multiplicity of rRNA encoding operons per bacterial genome exceeds requirements for the maximal growth rates in non-stress conditions. In this study, the authors provide evidence that a major function of rRNA operon multiplicity is to ensure that individual operons are not saturated by RNA polymerases during adaptation to environmental fluctuations, which can result in catastrophic chromosome replication failure and cell death.


Figures

Graphical Abstract
Graphical Abstract
rRNA operon multiplicity assures genome stability by decreasing occurrence of deleterious replication-transcription conflicts during adaptation to environmental fluctuations.
Figure 1.
Figure 1.
Growth, RNA content, P1rrnB expression and DNA replication of cells having different rrn operon copy numbers growing in LB medium. (A) Lag time and (B) doubling time, calculated from the growth curves (see Supplementary Figures S1A1, S3). Total RNA content in (C) lag phase and (D) exponential phase cells. (A-C) Each dot represents the mean value (± SD) from three independent experiments. Asterisks show significant difference compared to the WT (t-test: *P < 0.05, **P < 0.01, ****P < 0.0001). (E-F) P1rrnB-gfp expression during first 5 h of growth. Each data point represents the mean value (± SD) from three independent experiments. (G) Lag phase cells were treated simultaneously with rifampicin and cephalexin (first row; time 0), or 40 min with cephalexin only, and then also with rifampicin (second row). DNA content was measured after 90 min of incubation with both antibiotics. Number of genome equivalents (N) was calculated using stationary phase, 1N cells, as a reference. The results are representative of three independent experiments.
Figure 2.
Figure 2.
SOS induction, DNA repair, DNA damage, and mortality rates of cells growing in LB medium. (A) Expression of the SOS induction reporter PrecA-yfp in cells having different rrn operon copy numbers. Each data point represents the mean value (± SD) from three independent experiments. (B) Duration of the lag phase of different mutant derivatives of rrnC+ strain having different capacities to repair DNA lesions calculated from growth curves (see Supplementary Figure S1B). Each dot represents the mean value (± SD) from three independent experiments. Asterisks show significant differences compared to the strain with 1 rrn. (C) DNA damage detected in the lag phase cells using TUNEL assay and flow cytometer. Each bar represents the mean value (± SD) from three independent experiments. Asterisks show significant differences between strains. (D) Detection of double-strand breaks. Lag phase cells carrying a Gam-GFP reporter fusion were analysed using a fluorescence microscope. Inserted photographs show Gam-GFP foci in the cells having 1 rrn operon. Each bar represents the mean value (± SD) from three independent experiments. Total of 1,329 and 1,606 cells having 7 and 1 rrn were analysed, respectively. Asterisks show significant differences compared to WT. (E) Cell death measured during growth in the LB medium in populations of 7 rrn and 1 rrn strains (upper panel). Dead cells were detected using propidium iodide (PI) staining and flow cytometer (lower panel). Each result represents the mean value (± SD) from three independent experiments. (F-I) Growth of individual cells in the ‘mother’ machine microfluidic device in LB medium. Each panel represents growth of an individual mother cell. (F) 99% of WT cells with 7 rrn operons start growing and dividing after short lag phase. (G) 70% of cells with 1 rrn operon start growing and dividing after longer lag phase. (H) 10% of cells with 1 rrn operon undergoing transient crisis, i.e. filamentation, after which it resumes growth. (I) 20% of cells with 1 rrn operon increase in size, divide a few times and then die. The presented results are representative of three independent experiments. t-test: *P < 0.05, **P < 0.01, ***P < 0.001, ****P < 0.0001).
Figure 3.
Figure 3.
Impact of RNAP modulators on growth and mortality rates, SOS induction, DNA damage, mutagenesis and ribosome content of cells growing in LB medium. (A) Duration of the lag phase calculated from growth curves for different mutant strains (see Supplementary Figure S1B). Each dot represents the mean value (± SD) from three independent experiments. Asterisks show significant differences compared to the 1 rrn strain (t-test ****P < 0.0001). (B) Impact of the rpoC* allele on death of 1 rrn cells measured during growth in the LB medium. Dead cells were detected using propidium iodide (PI) staining and flow cytometer. (C) Impact of the rpoC* allele on DNA replication in 7 rrn and 1 rrn cells. Lag phase cells were treated simultaneously with rifampicin and cephalexin (first column), or 40 min with cephalexin only, and then also with rifampicin (second column). DNA content was measured after 90 min of incubation with both antibiotics. The results are representative of three independent experiments. (D) Impact of the rpoC* allele on the SOS induction measured using the PrecA-yfp reporter in 1 rrn cells. (E) Impact of RNAP modulators on DNA damage in 7 rrn and 1 rrn cells. DNA damage was quantified using TUNEL-based detection kit. Each bar represents the mean value (± SD) from three independent experiments. Asterisks show significant differences compared to the 1 rrn strain (t-test: *P < 0.05, **P < 0.01). (F) Impact of the rpoC* allele on rates of the appearance of nalidixic acid (left) and rifampicin resistant (right) mutants in populations of 7 rrn and 1 rrn cells. Each bar represents median with 95% confidence interval from at least five independent experiments each with five independent cultures. Asterisks show significant differences (Wilcoxon-test: ****P < 0.0001). (G) Concentration of 70S ribosomes in cells having 1 and 7 rrn operons and their rpoC* derivatives in lag and exponential growth phase cells. Each bar represents the mean value (± SD) from three independent experiments. Asterisks show significant differences (t-test ****P < 0.0001).
Figure 4.
Figure 4.
R-loops, DNA degradation and growth of mutants with different capacities to deal with stalled RNAPs and R-loops. (A) Detection of the DNA:RNA hybrids in lag phase cells having different rrn operon copy numbers using S9.6 antibody and dot-blot analysis. First row: Staining with methylene blue was used to estimate total amount of nucleic acids. Bar graphs represent quantification of the dot blots (second row). Each bar represents the mean value (± SD) of three independent experiments. Asterisks show significant differences compared to the WT. (B) Detection of the DNA:RNA hybrids in mutants with different capacities to deal with stalled RNAPs and R-loops during lag phase using S9.6 antibody and dot-blot analysis. (+) marks the overproduction of uvsW gene. Bar graphs represent quantification of the dot blots. Each bar represents the mean value (± SD) of three independent experiments. Asterisks show significant differences compared to the 1 rrn strain. (C) Duration of the lag times of mutants with different capacities to deal with stalled RNAPs and R-loops calculated from growth curves (see Supplementary Figure S1B). Each dot represents the mean value (± SD) of three independent experiments. (+) marks the overproduction of rnh and uvsW genes. Asterisks show significant differences compared to the 1 rrn strain. (D) Quantification of DNA degradation around the rrnC operon in strains having 1 (rrnC) and 7 rrn operons and their recA, rpoC* and mfd mutant derivatives during lag phase. DNA degradation was quantified using qPCR. Primers allowing amplification of the regions that are located 2 kb upstream and downstream of the rrnC operon and primers allowing amplification of the control locus located 250 kb upstream of the rrnC operon were used. Each bar represents the mean values (± SD) of three independent experiments. Asterisks show significant differences. (E) Expression of the PrpsT-gfp reporter in 7 rrn and 1 rrn strains. Each data point represents the mean value (± SD) from three independent experiments. (F) Quantification of DNA degradation around the rpsT gene in strains having 1 (rrnC) and 7 rrn operons and their recA mutant derivatives during lag phase. DNA degradation was quantified using qPCR. Primers allowing amplification of the regions that are located 2 kb upstream and downstream of the rpsT gene and primers allowing amplification of the control locus located 250 kb upstream of the rpsT gene were used. Each bar represents the mean values (± SD) of three independent experiments. Asterisks show significant differences according to t-test: *P < 0.05, **P < 0.01, ***P < 0.001, ****P < 0.0001.
Figure 5.
Figure 5.
RNA degradation, DNA:RNA hybrids and growth resumption after colistin treatment. (A) Total RNA content in different strains after colistin treatment, as well as in untreated controls. Each bar represents the mean values (± SD) of three independent experiments. Asterisks show significant differences compared to the WT. (B and E) Duration of the recovery time after colistin treatment of different strains that was calculated from growth curves (see Supplementary Figure S1C). (+) marks the overproduction of rnh and uvsW genes. Each dot represents the mean value (± SD) of three independent experiments. Asterisks show significant differences compared to the WT. (C) Detection of DNA:RNA hybrids during recovery of the WT strain after colistin treatment using S9.6 antibody. Bars represent quantification of the dot blot analysis. Asterisks show significant difference compared to the untreated WT. (D) DNA damage quantification in WT and its mutant derivatives after colistin treatment using TUNEL-based detection kit.). (+) marks the overproduction of uvsW gene. Each bar represents the mean value (± SD) of three independent experiments. Asterisks show significant differences. Asterisks show significant differences according to t-test: *P < 0.05, **P < 0.01, ***P < 0.001, ****P < 0.0001.
Figure 6.
Figure 6.
Molecular mechanisms involved in the processing of causes and consequences of replication/transcription conflicts. (A) Modulation of the lag phase duration of the strain having 1 rrn operon (rrnC) relative to WT having 7 rrn operons (0%) by different genetic modifications tested in this study (+/-%). (B) Model showing how transition from stationary to growth phase in cells with reduced numbers of rrn operons and recovery from ribosome damaging treatments in cells with full complement of rrn operons, cause crowding and stalling of RNAPs, R-loop formation, replicon stalling and DNA breakage, most probably upon arrival of the next replicon, at the rrn locus. Proteins involved in the processing of causes and consequences of these replication/transcription conflicts are indicated.

Similar articles

Cited by

References

    1. Russell J.B., Cook G.M.. Energetics of bacterial growth: balance of anabolic and catabolic reactions. Microbiol. Rev. 1995; 59:48–62. - PMC - PubMed
    1. Condon C., Squires C., Squires C.L.. Control of rRNA transcription in Escherichia coli. Microbiol. Rev. 1995; 59:623–645. - PMC - PubMed
    1. Dennis P.P., Bremer H.. Modulation of chemical composition and other parameters of the cell at different exponential growth rates. EcoSal Plus. 2008; 3:10.1128/ecosal.5.2.3. - DOI - PubMed
    1. Gagarinova A., Stewart G., Samanfar B., Phanse S., White C.A., Aoki H., Deineko V., Beloglazova N., Yakunin A.F., Golshani A.et al. .. Systematic genetic screens reveal the dynamic global functional organization of the bacterial translation machinery. Cell Rep. 2016; 17:904–916. - PubMed
    1. Klumpp S., Hwa T.. Growth-rate-dependent partitioning of RNA polymerases in bacteria. Proc. Natl. Acad. Sci. U.S.A. 2008; 105:20245–20250. - PMC - PubMed

Publication types