. 2022 Jun;23(6):947-959.
doi: 10.1038/s41590-022-01200-7. Epub 2022 May 12.

Single-cell analysis identifies the interaction of altered renal tubules with basophils orchestrating kidney fibrosis

Affiliations

Single-cell analysis identifies the interaction of altered renal tubules with basophils orchestrating kidney fibrosis

Tomohito Doke et al. Nat Immunol. 2022 Jun.

Abstract

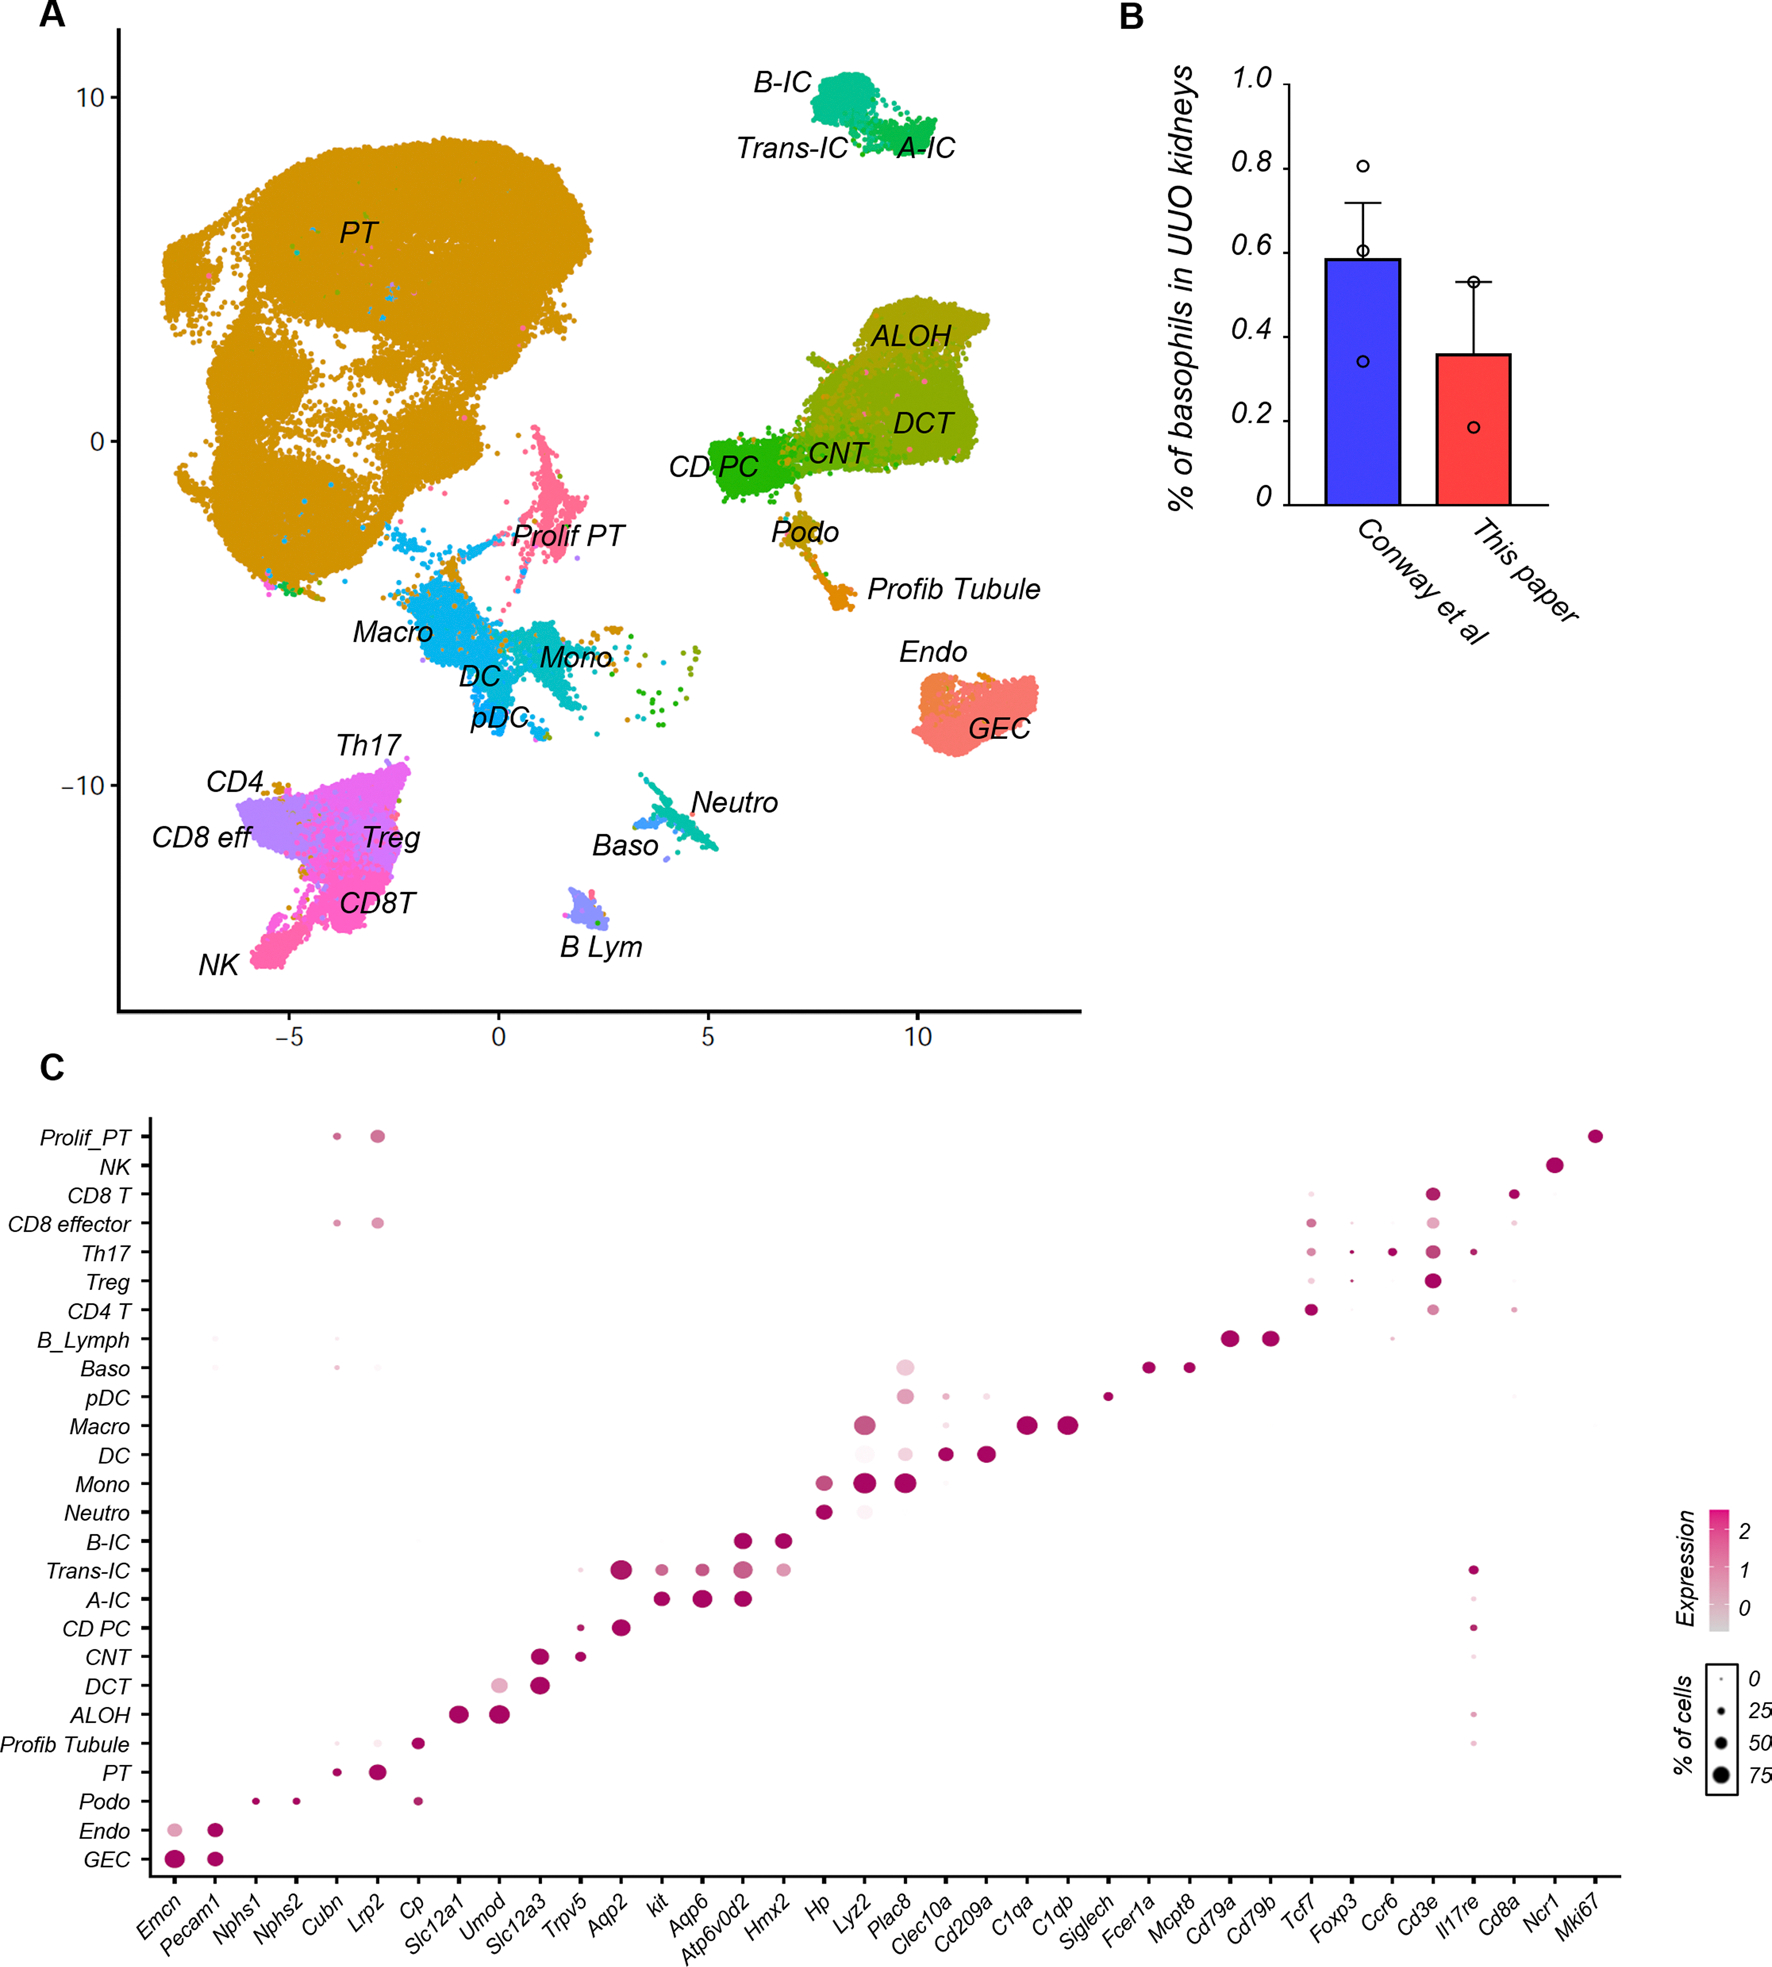
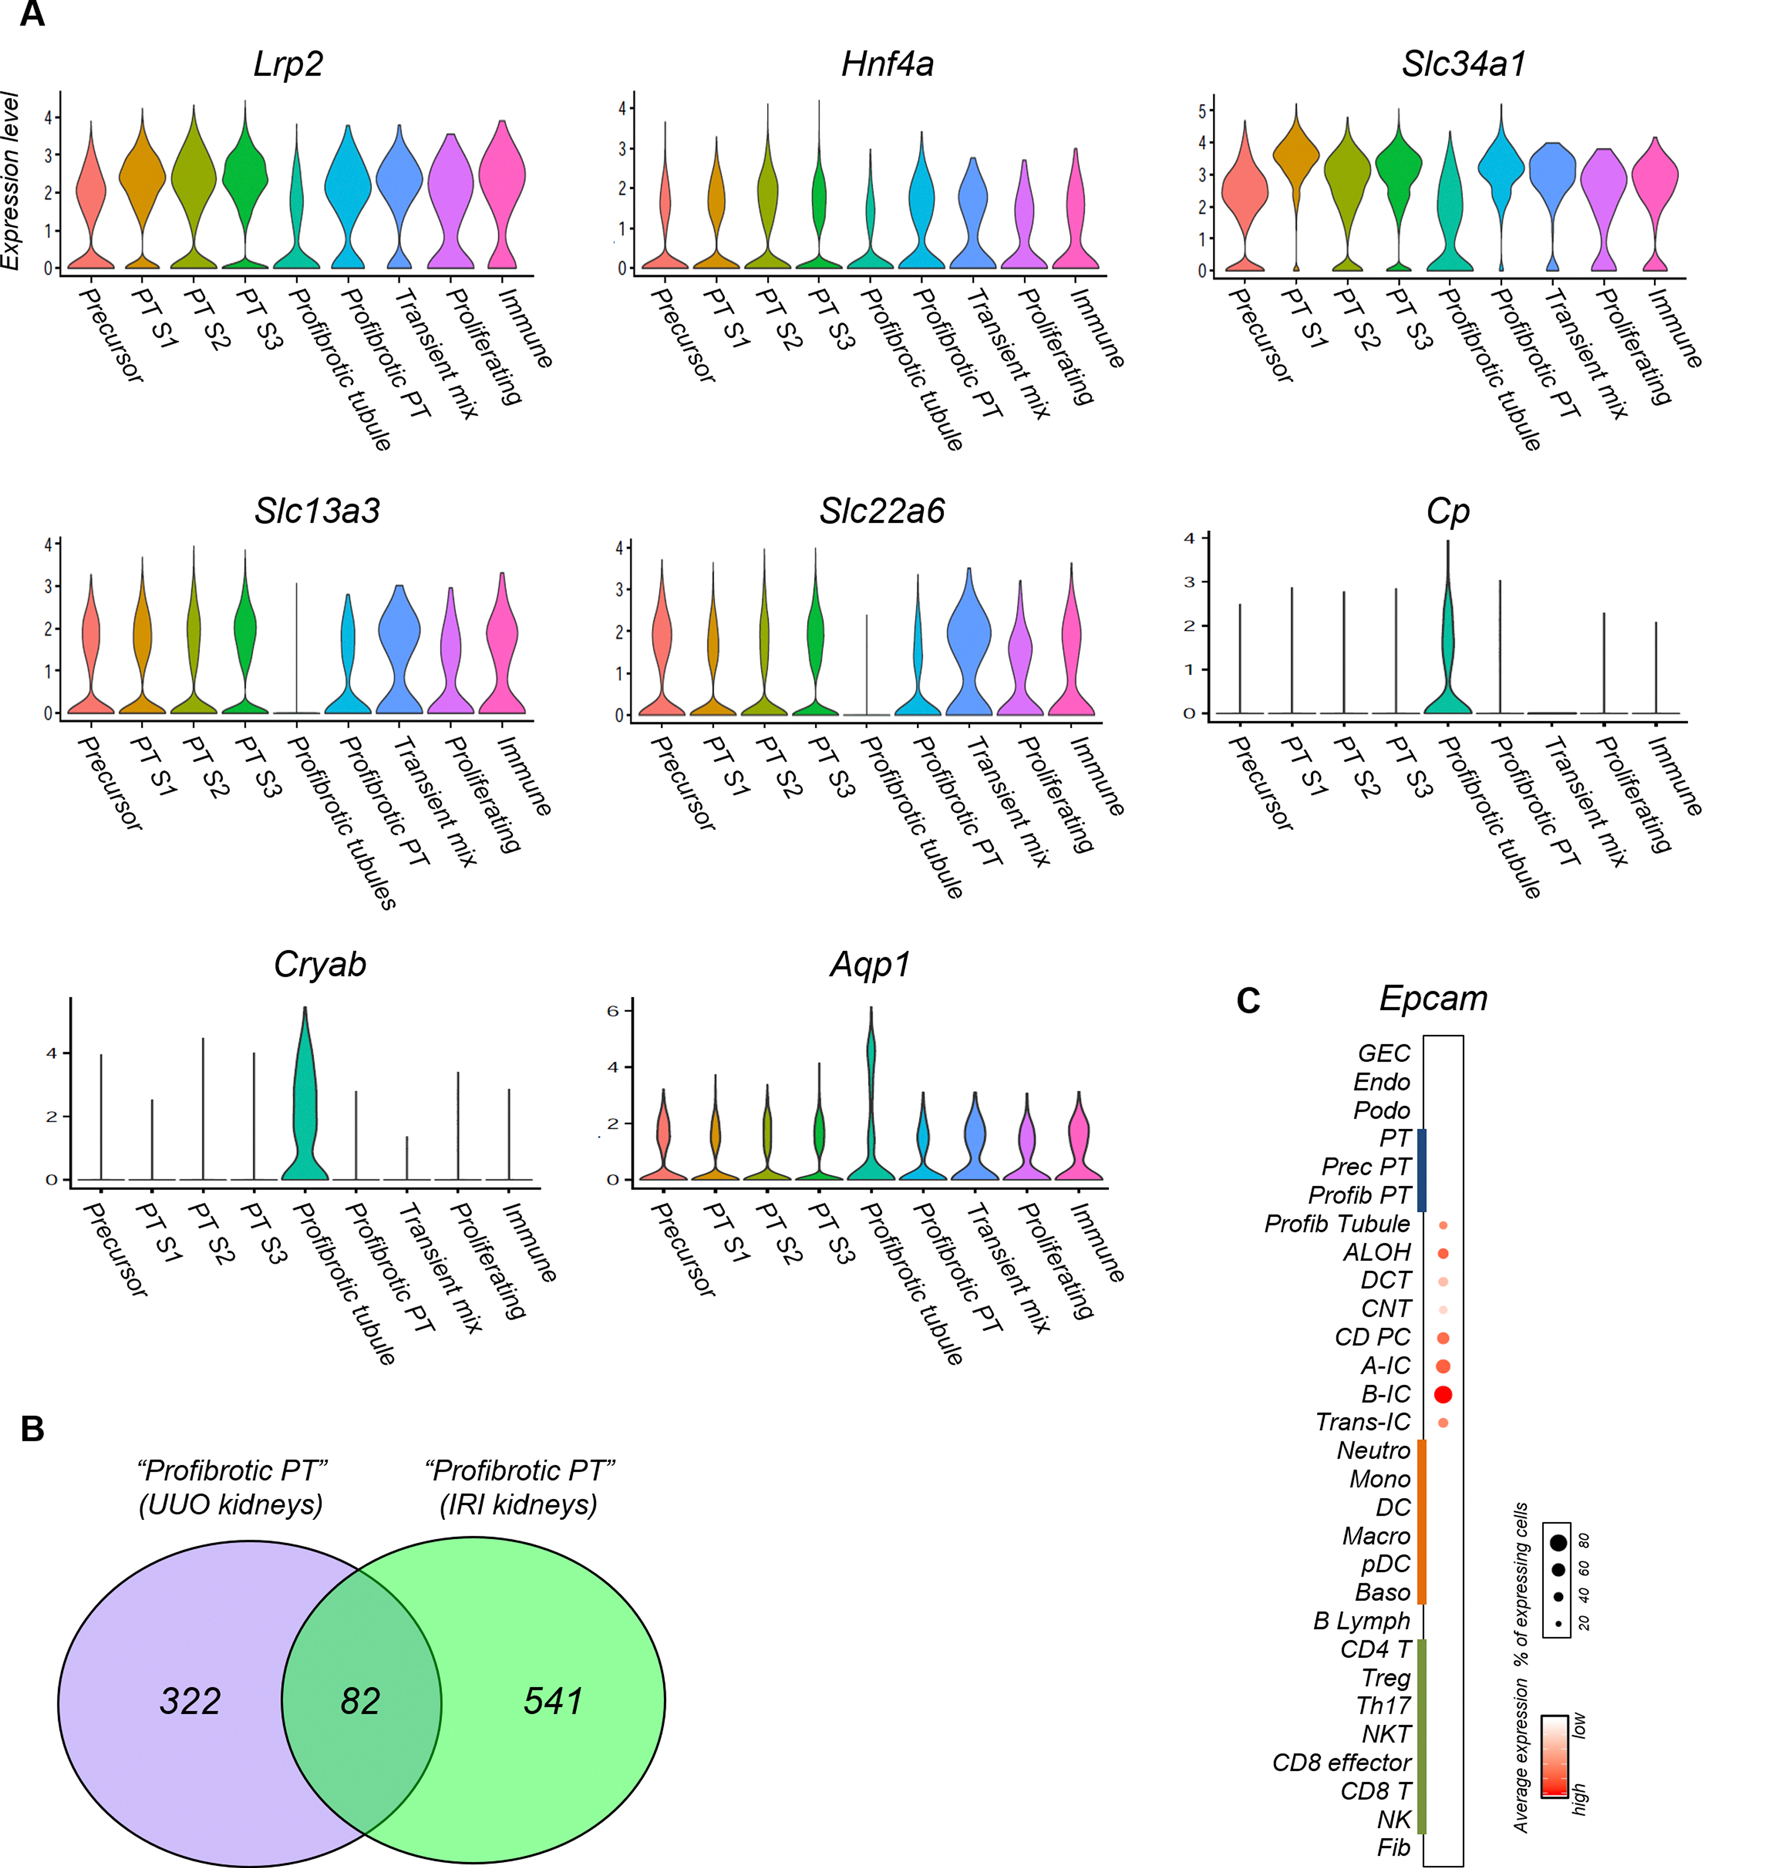
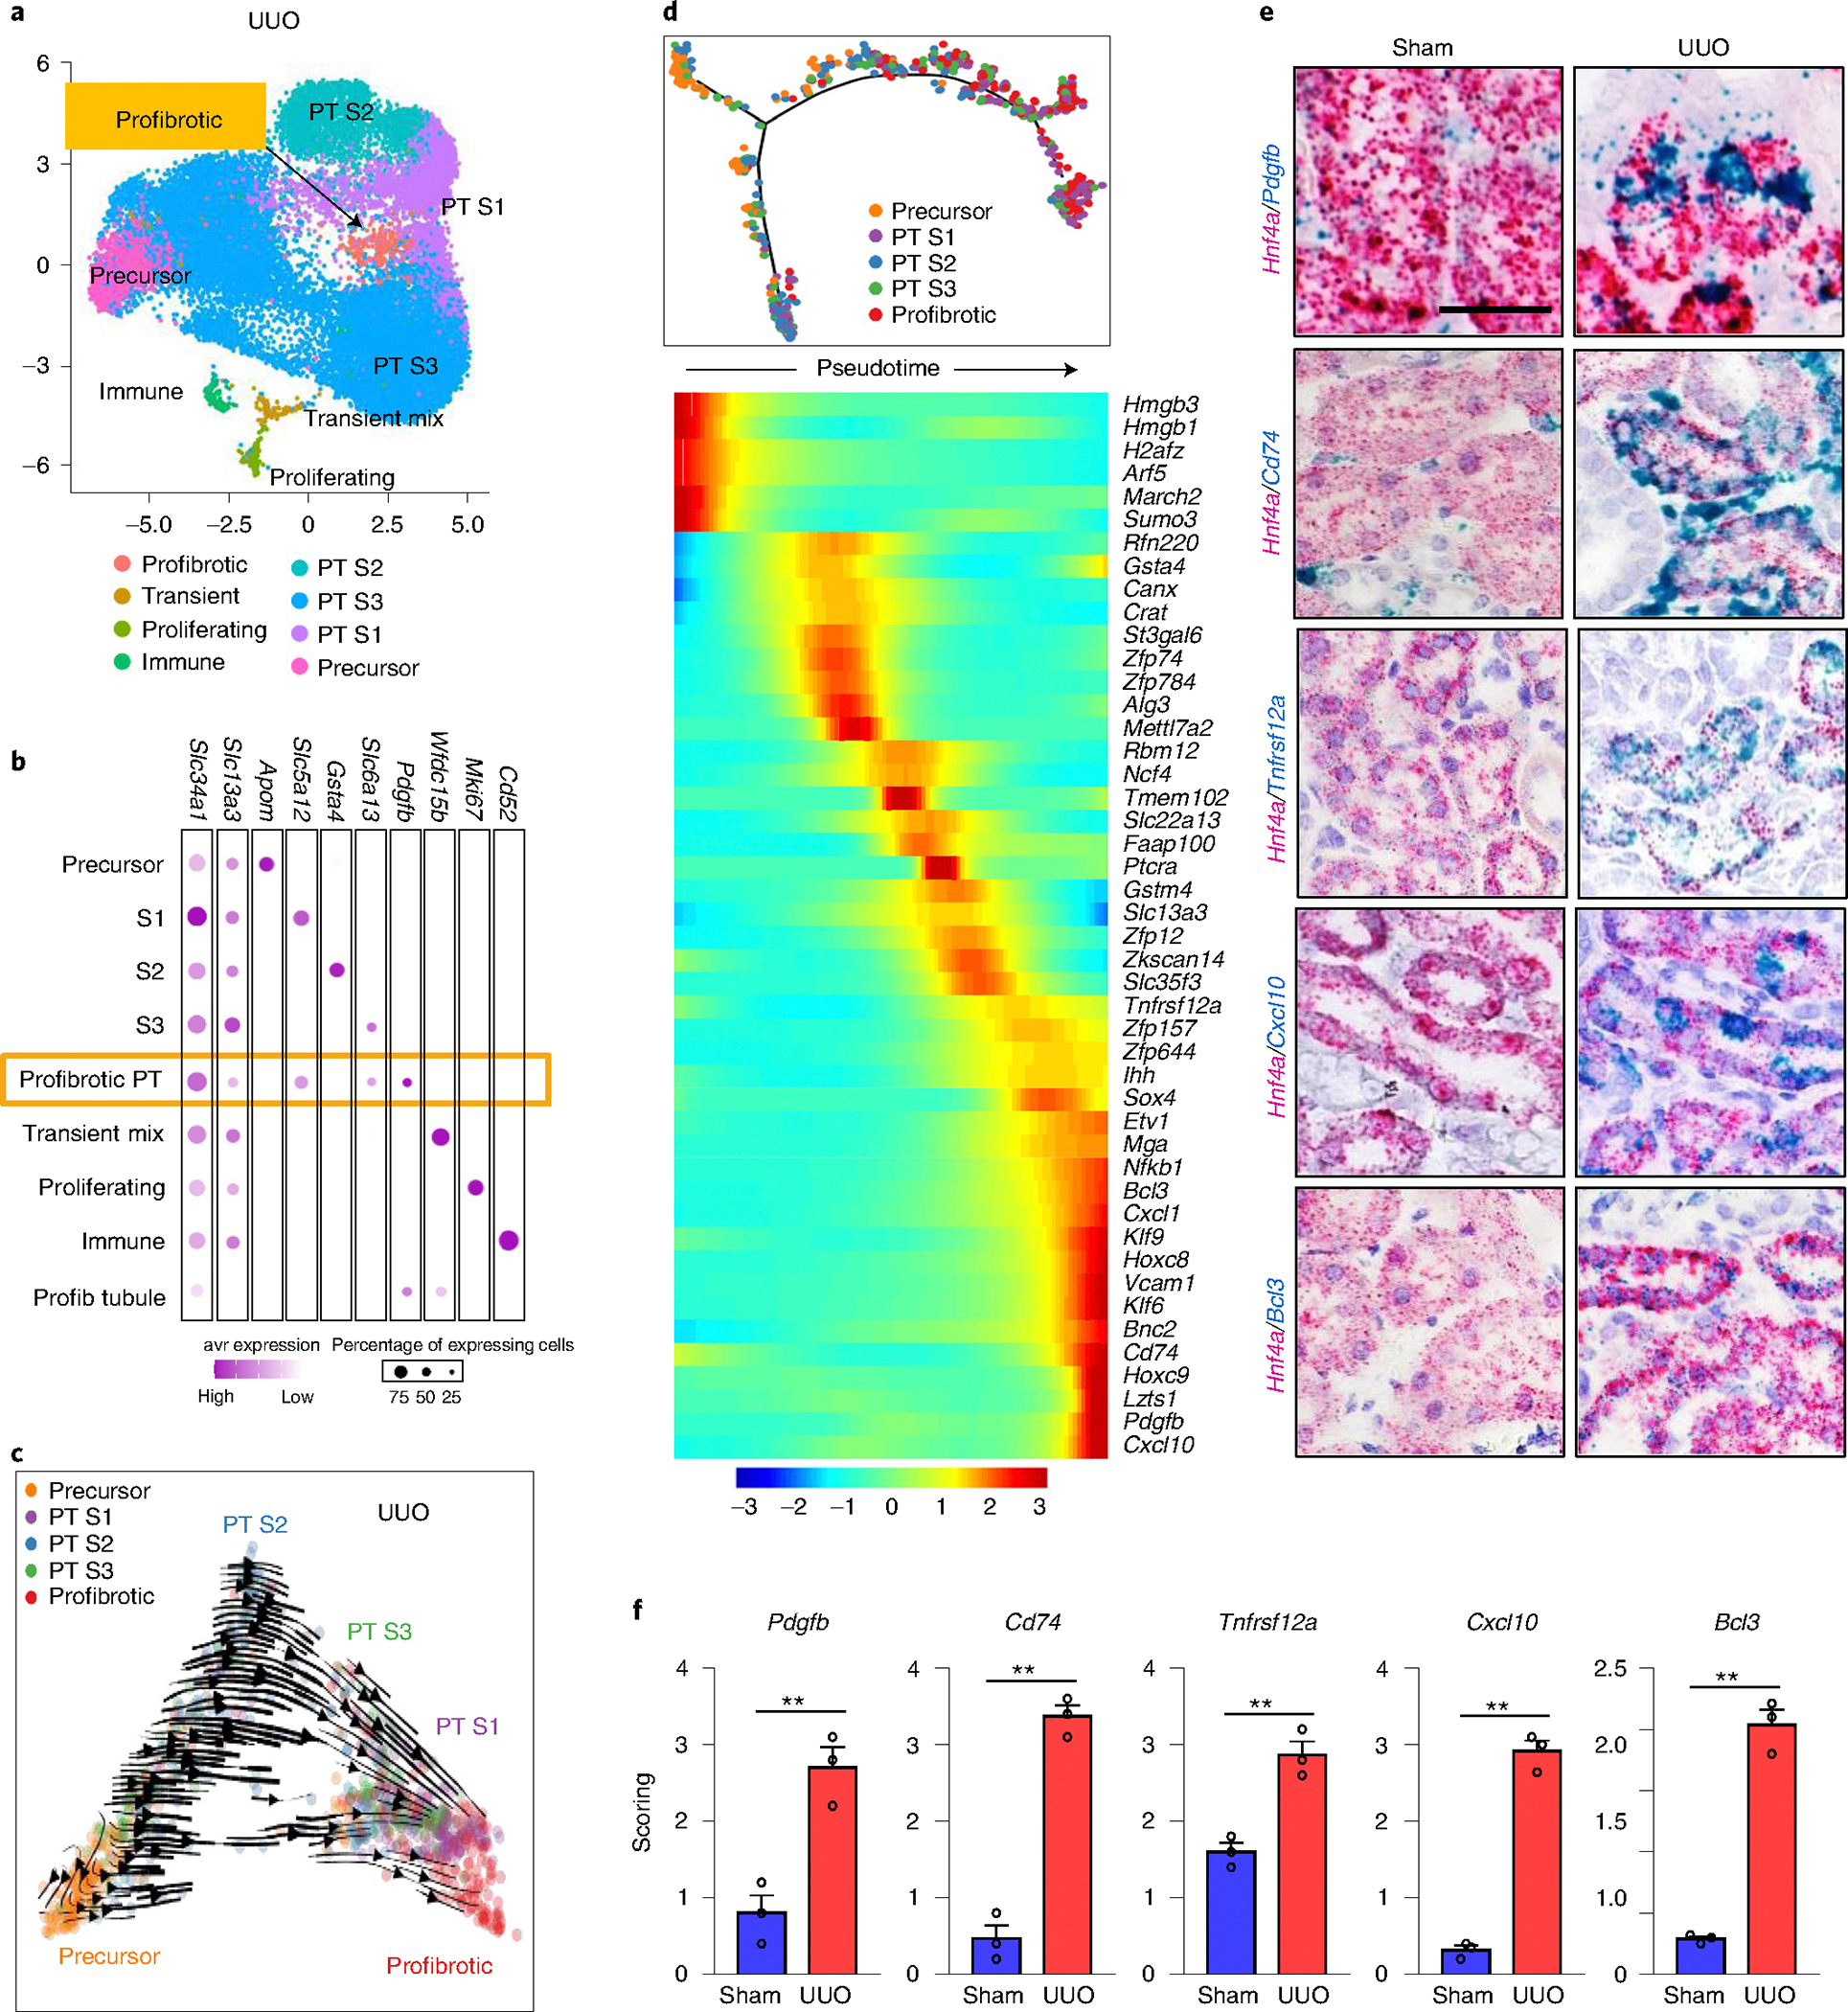
Inflammation is an important component of fibrosis but immune processes that orchestrate kidney fibrosis are not well understood. Here we apply single-cell sequencing to a mouse model of kidney fibrosis. We identify a subset of kidney tubule cells with a profibrotic-inflammatory phenotype characterized by the expression of cytokines and chemokines associated with immune cell recruitment. Receptor-ligand interaction analysis and experimental validation indicate that CXCL1 secreted by profibrotic tubules recruits CXCR2+ basophils. In mice, these basophils are an important source of interleukin-6 and recruitment of the TH17 subset of helper T cells. Genetic deletion or antibody-based depletion of basophils results in reduced renal fibrosis. Human kidney single-cell, bulk gene expression and immunostaining validate a function for basophils in patients with kidney fibrosis. Collectively, these studies identify basophils as contributors to the development of renal fibrosis and suggest that targeting these cells might be a useful clinical strategy to manage chronic kidney disease.


Conflict of interest statement

Competing interests

The authors declare no competing interests.

Figures

Extended Data Fig. 1 |
Extended Data Fig. 1 |. Mcpt8 expression in basophils in kidney fibrosis.
(A) Bubble plots showing the average gene expression and percentage of expressing cells of S100a8, Il5ra, Siglecf, Mcpt8, Fcer1a, Mcpt4 and kit in the basophils. (B) Representative in situ hybridization image of Mcpt8 in kidney fibrosis following UUO or injection of folic acid. Scale bar: 50 μm. Data are representative of two independent experiments.
Extended Data Fig. 2 |
Extended Data Fig. 2 |. Integration analysis using published dataset.
(a) UMAP dimension reduction showing 26 distinct cell types identified by unsupervised clustering. Sample number, Sham; n = 7, UUO; n = 5. GEC: glomerular endothelial cells, Endo: endothelial, Podo: podocyte, PT: proximal tubule, ALOH: ascending loop of Henle, DCT: distal convoluted tubule, CNT: connecting tubule, CD PC: collecting duct principal cell, A-IC: alpha intercalated cell, B-IC: beta intercalated cell, Trans-IC: transitional intercalated cell, Neutro: Neutrophils, Mono: monocyte, DC: dendritic cell, Macro: macrophage, pDC: plasmacytoid DC, Baso: Basophile B Lymph: B lymphocyte, NK: natural killer cell. (b) The percentage of basophils detected in single-cell RNA-seq in UUO kidneys. n = 3 from the published database (Conway et al), n = 2 from this paper. Data are presented as mean values ± SEM. (c) Bubble plots showing the expression of cell cluster marker genes in the combined dataset.
Extended Data Fig. 3 |
Extended Data Fig. 3 |. Marker gene expressions of renal tubule cells in uuo kidneys.
(a) Violin plots showing the average expression and percentage of cells expressing Lrp2, Hnf4a, Slc34a1, Slc13a3, Slc22a6, Cp, Cryab, and Aqp1 in the PT subcluster in UUO kidneys. (b) Venn diagram of differentially expression genes in profibrotic proximal renal tubules in UUO kidneys and ischemia reperfusion injury (IRI) kidneys. (c) Bubble plots showing the average expression and percentage of cells expressing Epcam in UUO kidneys.
Extended Data Fig. 4 |
Extended Data Fig. 4 |. SCeNIC regulon activity of PT clusters in uuo kidneys.
(Left panel) Heat map of predicted transcription factor activity in PT subclusters (Precursor, S2, S3, Transient mix, Proliferating, Immune, S1, and Profibrotic PT). Red indicates higher regulon activity, blue indicates lower regulon activity. (Right panel) Feature plots of the regulon activity (AUC) for representative transcription factors of Bcl3, Cebpb, Stat3, Klf6, Stat5a, and Ddit3.
Extended Data Fig. 5 |
Extended Data Fig. 5 |. The expression levels of Il18, Il33 in uuo kidneys.
(a) Whole kidney gene and protein expression levels in sham and UUO kidneys of wild-type (WT) mice (n = 3 respectively). (b) Bubble plots showing the average gene expression and percentage of expressing cells of Il18 and Il33 in sham and UUO kidneys. Gene expression levels are shown as FPKM values (quantified by RNA-seq) and protein levels (quantified by ELISA) are corrected with total protein levels. *p < 0.05, ***p < 0.001. Data are presented as mean values ± SEM. Data were analyzed using DEseq2. (c) The representative image of in situ hybridization of Il18 and Il33 with Hnf4a in sham and UUO kidneys. Scale bar; 20 μm. Data are representative of two independent experiments.
Extended Data Fig. 6 |
Extended Data Fig. 6 |. Immune cell survey of MCPT8Cre-DTR mice kidneys.
Relative transcript level of immune cell markers Tcf7, Cd8a, Foxp3, Ccr6, Ncr1, Cd79a, Adgre, Cd206, Clec10a, and Siglech in kidneys of experimental groups (n = 6 in each group). Gene expression levels in whole kidney samples were normalized to Gapdh. *p < 0.05. N.S. not significant. Data are presented as mean values ± SEM. All data were analyzed using a one-way ANOVA followed by Tukey post hoc test for multigroup comparison.
Extended Data Fig. 7 |
Extended Data Fig. 7 |. Changes in immune cell population in kidneys of Mcpt8cre-DTR mice.
(a) The number of Th17 cells in kidneys of experimental groups identified by FACS (n = 3 in WT sham, MCPT8Cre-DTR sham, and WT UUO. n = 4 in MCPT8Cre-DTR UUO). *p < 0.05, **p < 0.01. (b) The number of CD4, CD8, Treg, and mast cells in kidneys of experimental groups identified by flow sorting (n = 3 in WT sham, MCPT8Cre-DTR sham, and WT UUO. n = 4 in MCPT8Cre-DTR UUO). **p < 0.01. N.S. not significant. (a-b) Data are presented as mean values ± SEM. All data were analyzed using a one-way ANOVA followed by Tukey post hoc test for multigroup comparison.
Extended Data Fig. 8 |
Extended Data Fig. 8 |. Gene expression correlation in microdissected human kidney tubule samples.
(a) Correlation between IL6, CXCL1, IL18, IL33, IL17d normalized expression levels in human kidney samples (x axis) and eGFR (ml/min) (y axis). (b) Correlation between CXCL1, IL18, IL33, IL17d normalized expression levels (x axis) and IL6 normalized expression levels (y axis) in human kidney samples. Pearson’s correlation coefficient values are shown.
Fig. 1 |
Fig. 1 |. Single-cell atlas of mouse kidney fibrosis.
a, Experimental procedure. Kidneys from six sham and two UUO wild-type (WT) mice were digested into single cells and subjected to single-cell RNA-seq using 10X Genomics. b, Uniform Manifold Approximation and Projection (UMAP) dimension reduction of 59,609 cells showing 28 distinct cell types identified by unsupervised clustering. GEC, glomerular endothelial cell; Endo, endothelial; Podo, podocyte; Profib, profibrotic; ALOH, ascending loop of Henle; DCT, distal convoluted tubule; CNT, connecting tubule; CD PC, collecting duct principal cell; A-IC, α intercalated cell; B-IC, β intercalated cell; Trans-IC, transitional intercalated cell; Prolif PT, proliferating PT; Neutro, neutrophil; Mono, monocyte; Macro, macrophage; Baso, basophil; B Lymph, B lymphocyte; Prolif Ly, proliferating lymphocyte. c, Bubble plots showing the expression of cell cluster marker genes in sham (red) and UUO kidneys (blue). d, Heat map showing gene expression patterns in myeloid cells (Neutro, Mono, DC, Macro, pDC and Baso). Each row represents one gene and each column represents a cell. Genes enriched in the basophil cluster were highlighted in red. e, Heat map showing gene expression patterns in lymphoid cells (CD4+, Treg, TH17, NKT, CD8+ effector and CD8+ T). Each row represents one gene and each column represents a cell.
Fig. 2 |
Fig. 2 |. Profibrotic proximal tubule cell differentiation in uuo kidneys.
a, Subclustering analysis of PT in the UUO kidney. Profibrotic PT cluster is highlighted in orange. b, Bubble plot of representative genes in each subcluster Slc34a1, Slc13a3 (PT), Apom (precursor PT), Slc5a12 (S1), Gsta4 (S2), Slc6a13 (S3), Pdgfb (profibrotic PT), Wfdc15b (transient mixed PT), Mki67 (proliferating PT) and Cd52 (immune). c, RNA velocity cell trajectory analysis of proximal tubule cells in the UUO model of kidney fibrosis. d, Genes showing change in expression along the cell differentiation trajectory by Monocle. Red indicates higher expression, blue indicate lower expression. e, Representative double in situ hybridization images of Hnf4a (PT marker) and gene expressed by profibrotic PT cells, Pdgfb, Cd74, Tnfrsf12a, Cxcl10 and Bcl3 in sham and UUO kidneys. Scale bars, 20 μm. Data are representative of three independent experiments. f, Semi-quantification of the double in situ hybridization images for Pdgfb, Cd74, Tnfrsf12a, Cxcl10 and Bcl3 in sham and UUO kidneys (n = 3 in each). **P < 0.01. Data are presented as mean ± s.e.m. and were analyzed using a two-tailed Student’s t-test.
Fig. 3 |
Fig. 3 |. The interaction between profibrotic PT cells and basophils in kidney fibrosis.
a, Bubble plots showing the average gene expression levels and percentage of expressing cells across all cell types in sham and UUO kidneys. Arrows show the direction of ligand–receptor interaction. The following interaction are shown Il34–Csf1r, Cxcl16–Cxcr6, Cxcl10–Cxcr3 and Pdgfb–Pdgfrb. b, Heat map of the deconvolution analysis of bulk RNA-seq of sham and UUO kidneys. Red indicates higher relative cell fraction, blue indicates lower relative cell fraction. The cell clusters were ranked by the significance (between sham and UUO) from top to bottom. c, The flow cytometry strategy of kidney basophil detection and quantification in sham and UUO kidneys from WT mice (n = 3 in each). The gating strategy is also shown in Supplementary Fig. 6. **P < 0.01. d, Bubble plots showing the average gene expression levels and percentage of expressing Cxcl1-Cxcr2 in sham and UUO kidneys. e, Representative double in situ hybridization images of Hnf4a (PT marker) with Cxcl1 (profibrotic PT) and Mcpt8 (basophil marker) and Cxcr2 (basophil). Scale bars, 50 μm (top) and 5 μm (bottom). Data are representative of two independent experiments. f, Basophil chemotaxis assay. Basophils were isolated from WT mice by FACS and stimulated with culture medium or CXCL1 (10 nM). The migrated basophils were measured by fluorescent dye loading of cells (expressed as RFU, relative fluorescence units) (n = 6 in each condition). **P < 0.01. Data are presented as mean ± s.e.m. (c,f) and were analyzed using a two-tailed Student’s t-test.
Fig. 4 |
Fig. 4 |. Mice with genetic or antibody-mediated depletion of basophils are protected from renal fibrosis.
a, Experimental design. Mcpt8Cre mice were crossed with DTR mice. Mcpt8Cre-DTR mice were treated with DT (240 ng per 20 g body weight) on D1, D5 and D9. UUO surgery was performed on D4 and mice were killed on D11. b, The percentage of basophil detected by FACS in kidney samples of experimental groups (n = 3). **P < 0.01. c, Relative transcript level of Col1a1, Timp1 and Acta2 in experimental groups (n = 6 in each group). Gene expression levels were normalized to Gapdh. *P < 0.05, **P < 0.01. d, The representative images and semi-quantitative analysis of hematoxylin and eosin (H&E) staining in experimental groups (n = 6 in each group). Scale bars, 20 μm. *P < 0.05. e, The representative images and quantitative analysis of Sirius red staining in experimental groups (n = 6 in each group). Scale bars, 20 μm. *P < 0.05. f, Experimental design. WT mice were injected intraperitoneally with the MAR-1 antibody or isotype control IgG for three consecutive days (D1, D2 and D3). UUO was performed at D4 and mice were killed on D11. g, Relative transcript level of Col3a1, Col1a1, Timp1 and Acta2 in sham and UUO kidneys of WT mice injected with isotype control IgG or MAR-1 antibody (n = 6 in each group). Gene expression levels were normalized to Gapdh. *P < 0.05, **P < 0.01. h, The representative images and semi-quantitative analysis of H&E staining in experimental groups (n = 6 in each group). Scale bars, 20 μm. *P < 0.05. i, Representative images and quantitative analysis of Sirius red staining in experimental groups (n = 6 in each group). Scale bars, 20 μm. *P < 0.05. Data are presented as mean ± s.e.m. (be,gi) and were analyzed using a one-way analysis of variance (ANOVA) followed by Tukey post hoc test for multigroup comparison.
Fig. 5 |
Fig. 5 |. Basophil respond to IL-18 and IL-33 and release IL-6 in uuo kidneys.
a, Bubble plots showing the average gene expression and percentage of expressing cells Il4, Il6, Il18r1 and Il1rl1 in sham and UUO kidneys. b, The relative expression (FPKM) levels of Il4, Il6, Il18r1 and Il1rl1 in sham and UUO kidneys of WT mice by bulk RNA-seq (n = 3, respectively). *P < 0.05, **P < 0.01, ***P < 0.001; NS, not significant. Significance was determined using DESeq2. c, In vitro basophil stimulation assay. Basophils were cultured and stimulated with medium only, or recombinant IL-18 and IL-33 (rIL-18 and rIL-33) in the absence of IL-3. IL-6 levels were measured in the supernatant (n = 4 in each condition). ***P < 0.001. d, Representative double in situ hybridization images of Il6 with Mcpt8 (basophil) in sham and UUO kidneys of WT mice. Enlarged image of the box in the left image (right). Scale bars, 20 μm. Data are representative of two independent experiments. e, The mRNA and protein expression levels of IL-6 in sham and UUO kidneys of WT mice and mice with genetic depletion of basophils (Mcpt8Cre-DTR) (n = 6 in each group). Gene expression levels were normalized to Gapdh. IL-6 protein levels were normalized for total protein amount. **P < 0.01. f, The mRNA and protein expression levels of IL-6 in sham and UUO kidneys of WT mice with isotype control IgG or MAR-1 antibody injection (n = 6 in each group). Gene expression levels were normalized to Gapdh. IL-6 protein levels were normalized for total protein levels. *P < 0.05, **P < 0.01. Data are presented as mean values ± s.e.m. (b,c,e,f) and were analyzed using a one-way ANOVA followed by Tukey post hoc test for multigroup comparison.
Fig. 6 |
Fig. 6 |. IL-6 receptor blockade protected from renal fibrosis and TH17 cell expansion.
a, Experimental design. The anti-IL-6R Ab (400 μg) or isotype control IgG were injected into WT mice intraperitoneally at D1, D4 and D7. UUO was performed at D2 and mice were killed at D9. b, Relative transcript level of Col1a1, Col3a1, Timp1 and Acta2 in sham and UUO kidneys of experimental groups (n = 4 in each group). Gene expression levels were normalized to Gapdh. *P < 0.05, **P < 0.01. c, The representative images and quantitative analysis of Sirius red staining in experimental groups (n = 4 in each group). Scale bars, 20 μm. **P < 0.01. d, Bubble plots showing the average gene expression and percentage of expressing cells of Il6st and Il6ra in sham and UUO kidneys. e, RNA velocity analysis of T lymphocytes in UUO kidneys, showing CD4+, CD8+, CD8+ effector, TH17, Treg cells, NK and NKT cells. f, Cell trajectory analysis by Monocle and heat map showing changes in expression of genes along the differentiation trajectory. g, Relative transcript level of Il17a and Tgfb1 in sham and UUO kidneys of WT mice and mice with genetic depletion of basophils (Mcpt8Cre-DTR) (n = 6 in each group). Gene expression levels were normalized to Gapdh. *P < 0.05. Data are presented as mean ± s.e.m. (b,c,g) and were analyzed using a one-way ANOVA followed by Tukey post hoc test for multigroup comparison.
Fig. 7 |
Fig. 7 |. Increased number of basophils in kidneys of patients with CKD.
a, Single-cell analysis of healthy control and CKD human kidney samples. Basophil/mast cell cluster was highlighted with red arrow. Note that the increase in number of basophils/mast cells in CKD samples. b, Representative immunofluorescence staining of CD203c (activated basophils) and quantification of basophil numbers in healthy control and CKD kidneys (n = 6, respectively). Higher magnification image of image on left (right). Arrow points to basophils. Scale bars, 20 μm. **P < 0.01. Data are presented as mean ± s.e.m. Data were analyzed using a two-tailed Student’s t-test. c, In silico deconvolution analysis of bulk microarray data 95 human kidney samples with variable degree of fibrosis. The correlation plot of basophils fraction (determined by in silico deconvolution) (y axis) and the percentage (log expression) of renal fibrosis (x axis) is shown. d, RNA-seq data from 432 human kidney tubule samples. Correlation between the percentage of renal fibrosis (y axis) and normalized IL6 levels (x axis). e, Correlation between the percentage of renal fibrosis (y axis) and normalized expression levels of CXCL1, IL18, IL33 and IL17d (x axis) in human kidney samples. The r represents Pearson’s correlation coefficient values (ce).
Fig. 8 |
Fig. 8 |. Graphical abstract.
Injured profibrotic renal tubules release CXCL1, resulting in recruitment of CXCR2-positive basophils to the kidneys. The recruited basophils express IL-18R and IL1RL1 and are activated by their ligands; IL-18 and IL-33. Activated basophils produce IL-6 and promote TH17 cell expansion. IL-17a and transforming growth factor (TGF)-β released from TH17 contribute to the development of renal fibrosis. Antibody-mediated basophil depletion (MAR-1) and IL-6 receptor blockade protect from renal fibrosis.

Comment in

References

    1. Wynn TA Cellular and molecular mechanisms of fibrosis. J. Pathol. 214, 199–210 (2008). - PMC - PubMed
    1. Jager KJ et al. A single number for advocacy and communication-worldwide more than 850 million individuals have kidney diseases. Nephrol. Dialysis Transplant. 34, 1803–1805 (2019). - PubMed
    1. Dhillon P et al. The nuclear receptor ESRRA protects from kidney disease by coupling metabolism and differentiation. Cell Metab. 33, 379–394 (2021). - PMC - PubMed
    1. Galli SJ, Tsai M & Piliponsky AM The development of allergic inflammation. Nature 454, 445–454 (2008). - PMC - PubMed
    1. Voehringer D Protective and pathological roles of mast cells and basophils. Nat. Rev. Immunol. 13, 362–375 (2013). - PubMed

Publication types