. 2022 Oct 21;145(10):3666-3680.
doi: 10.1093/brain/awac168.

Single unit analysis and wide-field imaging reveal alterations in excitatory and inhibitory neurons in glioma

Affiliations

Single unit analysis and wide-field imaging reveal alterations in excitatory and inhibitory neurons in glioma

Brian J A Gill et al. Brain. .

Abstract

While several studies have attributed the development of tumour-associated seizures to an excitatory-inhibitory imbalance, we have yet to resolve the spatiotemporal interplay between different types of neuron in glioma-infiltrated cortex. Herein, we combined methods for single unit analysis of microelectrode array recordings with wide-field optical mapping of Thy1-GCaMP pyramidal cells in an ex vivo acute slice model of diffusely infiltrating glioma. This enabled simultaneous tracking of individual neurons from both excitatory and inhibitory populations throughout seizure-like events. Moreover, our approach allowed for observation of how the crosstalk between these neurons varied spatially, as we recorded across an extended region of glioma-infiltrated cortex. In tumour-bearing slices, we observed marked alterations in single units classified as putative fast-spiking interneurons, including reduced firing, activity concentrated within excitatory bursts and deficits in local inhibition. These results were correlated with increases in overall excitability. Mechanistic perturbation of this system with the mTOR inhibitor AZD8055 revealed increased firing of putative fast-spiking interneurons and restoration of local inhibition, with concomitant decreases in overall excitability. Altogether, our findings suggest that diffusely infiltrating glioma affect the interplay between excitatory and inhibitory neuronal populations in a reversible manner, highlighting a prominent role for functional mechanisms linked to mTOR activation.

Keywords: glioma; mTOR; single unit; tumour-associated seizures.


Conflict of interest statement

The authors report no competing interests.

Figures
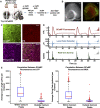
Figure 1
Figure 1
Model of diffusely infiltrating glioma and experimental design. (A) PDGFA+/p53− glioma cells were injected into the subcortical white matter of Thy1-GCaMP6f mice. Coronal slices were obtained 25–30 days post-injection. A subset of mice was treated with a single dose of AZD8055 prior to injection, and slices from these mice were additionally bathed in AZD8055 during incubation. Two slices from each mouse underwent recording in artificial CSF and zero-Mg2+. (B) Orientation of slice on the array in preparation for optical mapping of Thy1-GCaMP fluorescence with histology. (C) Immunofluorescence micrographs demonstrating Thy1-GCaMP positive neurons and HA-positive glioma cells. mTOR signalling was present in both Thy1-GcaMP-positive neurons and HA-positive glioma cells, as indicated by the presence of phosphorylated S6 ribosomal protein. (D) Representative GCaMP fluorescence, LFP, and MUA from the same channel in a tumour-bearing slice. (E) Box plots showing temporal correlation between GCaMP fluorescence with LFP (n = 621, P < 0.01, Mann-Whitney U-test, two-tailed) and MUA (n = 621, P < 0.01, Mann-Whitney U-test, two-tailed). Scale bars = 400 μm (B), 50 μm (C).
Figure 2
Figure 2
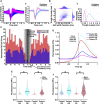
Tumour-bearing slices exhibit increased excitability compared to controls. (A) Representative local Thy1-GCaMP response (solid blue line) to microelectrode stimulation (dashed red line). (B) Violin plots displaying increased excitability in tumour-bearing slices. The mean GCaMP peak amplitude (F/F0) at electrodes which demonstrated a response at 10 μA, 25 μA, and 50 μA was 1.55 ± 0.04, 1.58 ± 0.03, and 1.54 ± 0.03 in tumour-bearing slices and 1.33 ± 0.03, 1.36 ± 0.02, and 1.30 ± 0.02 in controls (10 μA control: n = 79,10 μA tumour: n = 135, 25 μA control: n = 226, 25 μA tumour: n = 274, 50 μA control: n = 255, 50 μA tumour: n = 280, P < 0.01 in each, Mann–Whitney U-test, two-tailed). (C) Tumour-bearing slices were more excitable than controls with respect to mean number of GCaMP peaks per channel (i), mean GCaMP peak amplitude per channel (ii), and mean LFP line length per channel (iii) (control: n = 480, tumour: n = 883, P < 0.01 for each analysis in each period, Mann–Whitney U-test, two-tailed). The MUA firing rates (control: n = 480, tumour: n = 883, P < 0.01 in first period, P = 0.67 in second period, P < 0.01 in third period, Mann–Whitney U-test, two-tailed) (iv) were discordant with these results.
Figure 3
Figure 3
Single unit analysis demonstrates decreased inhibitory detection with dysfunctional inhibitory firing in glioma-infiltrated cortex. (A) Waveforms of all putative RS cells (blue) and FS cells (magenta) (i) after subclassification with average waveform (ii) of both groups. Shading represents SD. (B) Trough-to-peak and half-width maximum were the two parameters chosen to describe spike waveforms. Each cell's average waveform is represented in the 2D space of the two parameters with outliers excluded (i). A bimodal distribution was evident in the trough-to-peak data, and a Gaussian mixture model was fitted to find the intersection point (0.7165 ms, dashed line) between the two components (ii). (C) Average of all cross-correlograms constructed for pairs of RS cells and FS cells sorted from the same channel. Time 0 indicates FS cell firing, while bars represent RS cell firing from −10 to 10 ms. Because of the nature of spike detection, the values of the cross-correlograms from −1.5 to 1.5 ms are thus artificially reduced. While the firing rates of FS cells were decreased in tumour-bearing slices, their activity was more concentrated within periods of increased pyramidal cell firing (control: n = 602 pairs, tumour: n = 92 pairs, P < 0.01, Mann–Whitney U-test, two-tailed). (D) Mean STA GCaMP signals of each cell type in tumour-bearing slices and controls. Time 0 indicates when units fired. (E) Violin plots depicting the maximum amplitude of the STA GCaMP signals from 0 to 200 ms by cell type. In the first half of the recording (i), the median RS cell STA GCaMP signal amplitude (F/F0) was 1.08 in tumour-bearing slices versus 1.01 in controls (control: n = 350, tumour: n = 768, P < 0.01, Mann–Whitney U-test, two-tailed); the median FS cell STA GCaMP signal amplitude (F/F0) was 1.04 in tumour-bearing slices versus 1.00 in controls (control: n = 204, tumour: n = 41, P < 0.01, Mann–Whitney U-test, two-tailed). In the second half of the recording (ii), the median RS cell STA GCaMP signal amplitude (F/F0) was 1.08 in tumour-bearing slices versus 1.03 in controls (control: n = 376, tumour: n = 784, P < 0.01, Mann–Whitney U-test, two-tailed); the median FS cell STA GCaMP signal amplitude (F/F0) was 1.11 in tumour-bearing slices versus 1.00 in controls (control: n = 204, tumour: n = 43, P < 0.01, Mann–Whitney U-test, two-tailed).
Figure 4
Figure 4
mTOR inhibition decreases excitability within glioma-infiltrated cortex. Low power immunofluorescence micrographs of untreated (A) and treated (B) tumour-bearing slices, demonstrating decreased mTOR signalling in neuronal and neoplastic cells of treated slices. This was evidenced by reduced levels of phosphorylated S6 ribosomal protein (untreated: n = 34, treated: n = 27, P < 0.01, unpaired t-test, two-tailed) (C). (D) Violin plots displaying decreased excitability in treated tumour-bearing slices. The mean amplitudes of the local GCaMP response (F/F0) at 5 μA was 1.37 ± 0.04 in untreated slices versus 1.23 ± 0.03 in treated ones (5 μA untreated tumour: n = 102, 5 μA treated tumour: n = 53, P < 0.05, Mann–Whitney U-test, two-tailed); at 10 μA it was 1.55 ± 0.04 in untreated slices versus 1.37 ± 0.04 in treated ones (10 μA untreated tumour: n = 135, 10 μA treated tumour: n = 116, P < 0.01, Mann–Whitney U-test, two-tailed). (E) Excitability was decreased in treated tumour-bearing slices with respect to mean number of GCaMP peaks per channel (i), mean GCaMP peak amplitude per channel (ii) and mean LFP line length per channel (iii) (untreated tumour: n = 883, treated tumour: n = 916, P < 0.01 for each analysis in each period, Mann–Whitney U-test, two-tailed). The MUA firing rates (untreated tumour: n = 883, treated tumour: n = 916, P < 0.05 in first period, P < 0.01 in second period, P = 0.12 in third period, Mann–Whitney U-test, two-tailed) (iv) were discordant with these results. Scale bars = 400 µm (A), 400 µm (B).
Figure 5
Figure 5
FS cells in tumour-bearing slices demonstrate decreased entrainment to RS cell firing after mTOR inhibition. (A) In treated tumour-bearing slices, 15% of sorted units were subclassified as FS cells versus 5% in untreated slices. (B) FS cells from treated slices fired at 0.70 ± 0.09 spikes/s, as opposed to 0.26 ± 0.03 spikes/s in untreated slices (untreated tumour: n = 44, treated tumour: n = 119, P < 0.01, Mann–Whitney U-test, two-tailed). (C) In comparison to those from untreated tumour-bearing slices, pairwise cross-correlograms from treated ones revealed decreased RS cell firing in temporal relationship to FS cell firing, suggesting greater FS cell activity between SLEs (untreated tumour: n = 92 pairs, treated tumour: n = 199 pairs, P < 0.01, Mann–Whitney U-test, two-tailed). (D) Similarly, spike-triggered averaging of the local GCaMP response to FS cell firing was decreased in treated tumour-bearing slices in the first (untreated tumour: n = 41, treated tumour: n = 117, P < 0.05, Mann–Whitney U-test, two-tailed) (i) and second (untreated tumour: n = 43, treated tumour: n = 118, P < 0.01, Mann–Whitney U-test, two-tailed) (ii) halves of the recording. There was no significant difference for spike-triggered averaging of the local GCaMP responses to RS cell firing.
Figure 6
Figure 6
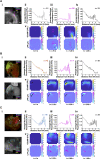
mTOR inhibition restores FS cell-mediated local inhibition during SLEs. (A) In control slices, the time-locked GCaMP signal around FS cell firing suggested intact local inhibition. Areas with increased GCaMP activity were located both proximal to and distal from areas with FS cell firing (ii). Four consecutive time points are shown (v) from Supplementary Video 3 (doi:10.6084/m9.figshare.19686390) during a representative SLE from a control slice. The representative slice shows that maximum GCaMP activity occur at a distance from the FS cells. Moreover, the FS cells appear to inhibit spread. (B) In untreated tumour-bearing slices, the time-locked GCaMP signals with the greatest amplitudes were proximal to electrodes with FS cell firing (ii). As distance from the electrodes with these FS cells increased, the time-locked GCaMP signal amplitude decreased. Four consecutive time points are shown (v) from Supplementary Video 4 (doi:10.6084/m9.figshare.19686387) during a representative SLE from an untreated tumour-bearing slice. The representative slice shows maximum GCaMP activity occurring in the electrodes with FS cell firing. (C) Treated tumour-bearing slices recapitulated the findings seen in controls, suggesting that mTOR inhibition restores the contribution of FS cells to local inhibition during SLEs (ii). Four consecutive time points are shown (v) from Supplementary Video 5 (doi:10.6084/m9.figshare.19686384) during a representative SLE from a treated tumour-bearing slice. The representative slice shows maximum GCaMP activity occurring at a distance from FS cell firing. Across all cohorts, areas of increased GCaMP activity occurred distal to FS cells engaged in local inhibition (iii) and proximal to FS cells recruited to excitatory activity (iv) (AC). Control and treated tumour-bearing slices possessed a greater percentage of FS cells contributing to local inhibition (50.7% and 50%, respectively) compared to untreated tumour-bearing slices (9.3%). Representative histology (HA-positive glioma cells, red; Thy1-positive neurons, green) shown with pictures of slices placed on the array (i). Scale bars = 400 µm. Heat maps denote GCaMP (top) and LFP (bottom) amplitude. Radii of circles (magenta for FS cells contributing to local inhibition, black for FS cells recruited to excitatory activity) on heatmaps indicate the instantaneous firing rate of the FS cells in that electrode.

Comment in

References

    1. Kerkhof M, Vecht CJ. Seizure characteristics and prognostic factors of gliomas. Epilepsia. 2013;54:12–17. - PubMed
    1. Campbell SL, Robel S, Cuddapah VA, et al. . GABAergic disinhibition and impaired KCC2 cotransporter activity underlie tumor-associated epilepsy. Glia. 2015;63:23–36. - PMC - PubMed
    1. Tewari BP, Chaunsali L, Campbell SL, Patel DC, Goode AE, Sontheimer H. Perineuronal nets decrease membrane capacitance of peritumoral fast spiking interneurons in a model of epilepsy. Nat Commun. 2018;9:1–17. - PMC - PubMed
    1. Hatcher A, Yu K, Meyer J, Aiba I, Deneen B, Noebels JL. Pathogenesis of peritumoral hyperexcitability in an immunocompetent CRISPR-based glioblastoma model. J Clin Invest. 2020;130:2286–2300. - PMC - PubMed
    1. Behrens PF, Langemann H, Strohschein R, Draeger J, Hennig J. Extracellular glutamate and other metabolites in and around RG2 rat glioma: An intracerebral microdialysis study. J Neurooncol. 2000;47:11–22. - PubMed

Publication types

Substances