. 2022 Aug 5;12(8):1904-1921.
doi: 10.1158/2159-8290.CD-21-1181.

Tumor-Derived Lysophosphatidic Acid Blunts Protective Type I Interferon Responses in Ovarian Cancer

Affiliations

Tumor-Derived Lysophosphatidic Acid Blunts Protective Type I Interferon Responses in Ovarian Cancer

Chang-Suk Chae et al. Cancer Discov. .

Abstract

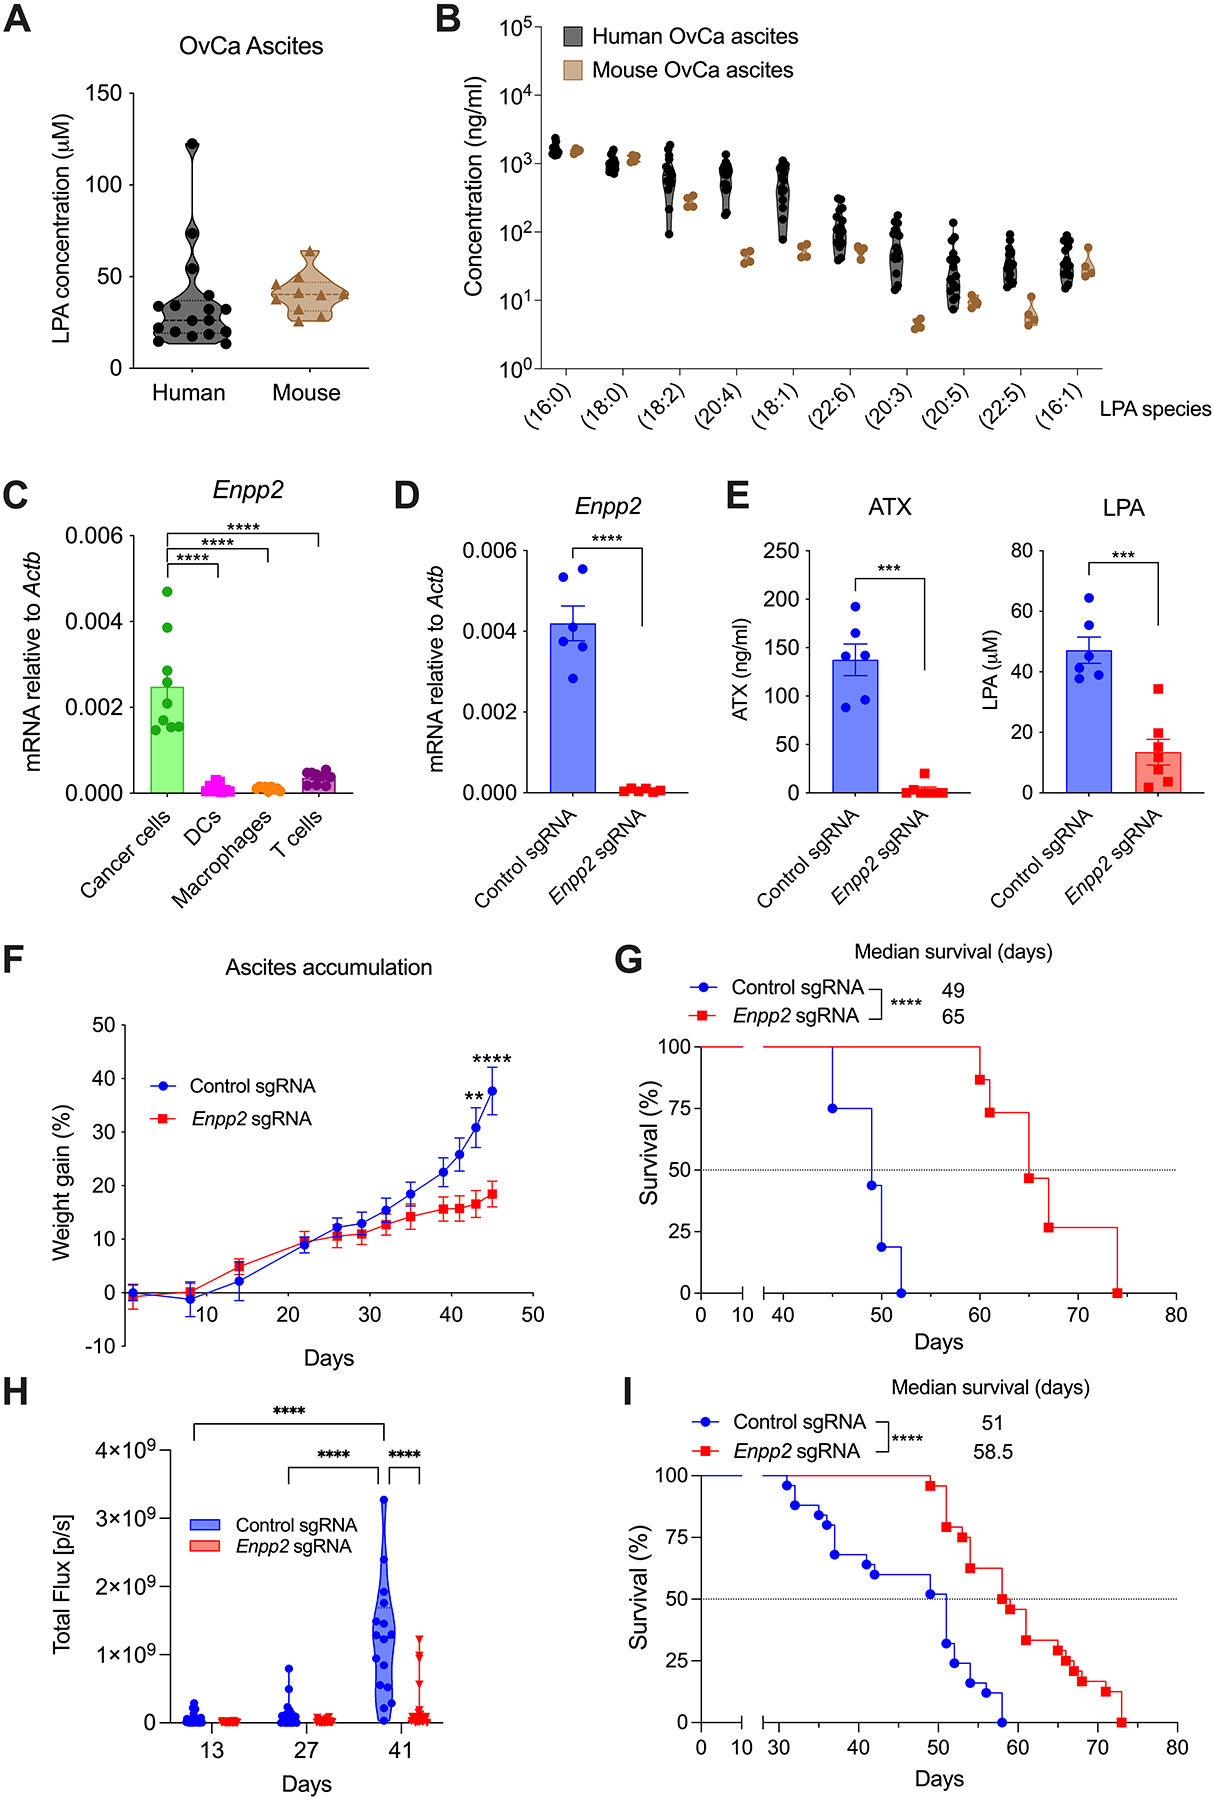
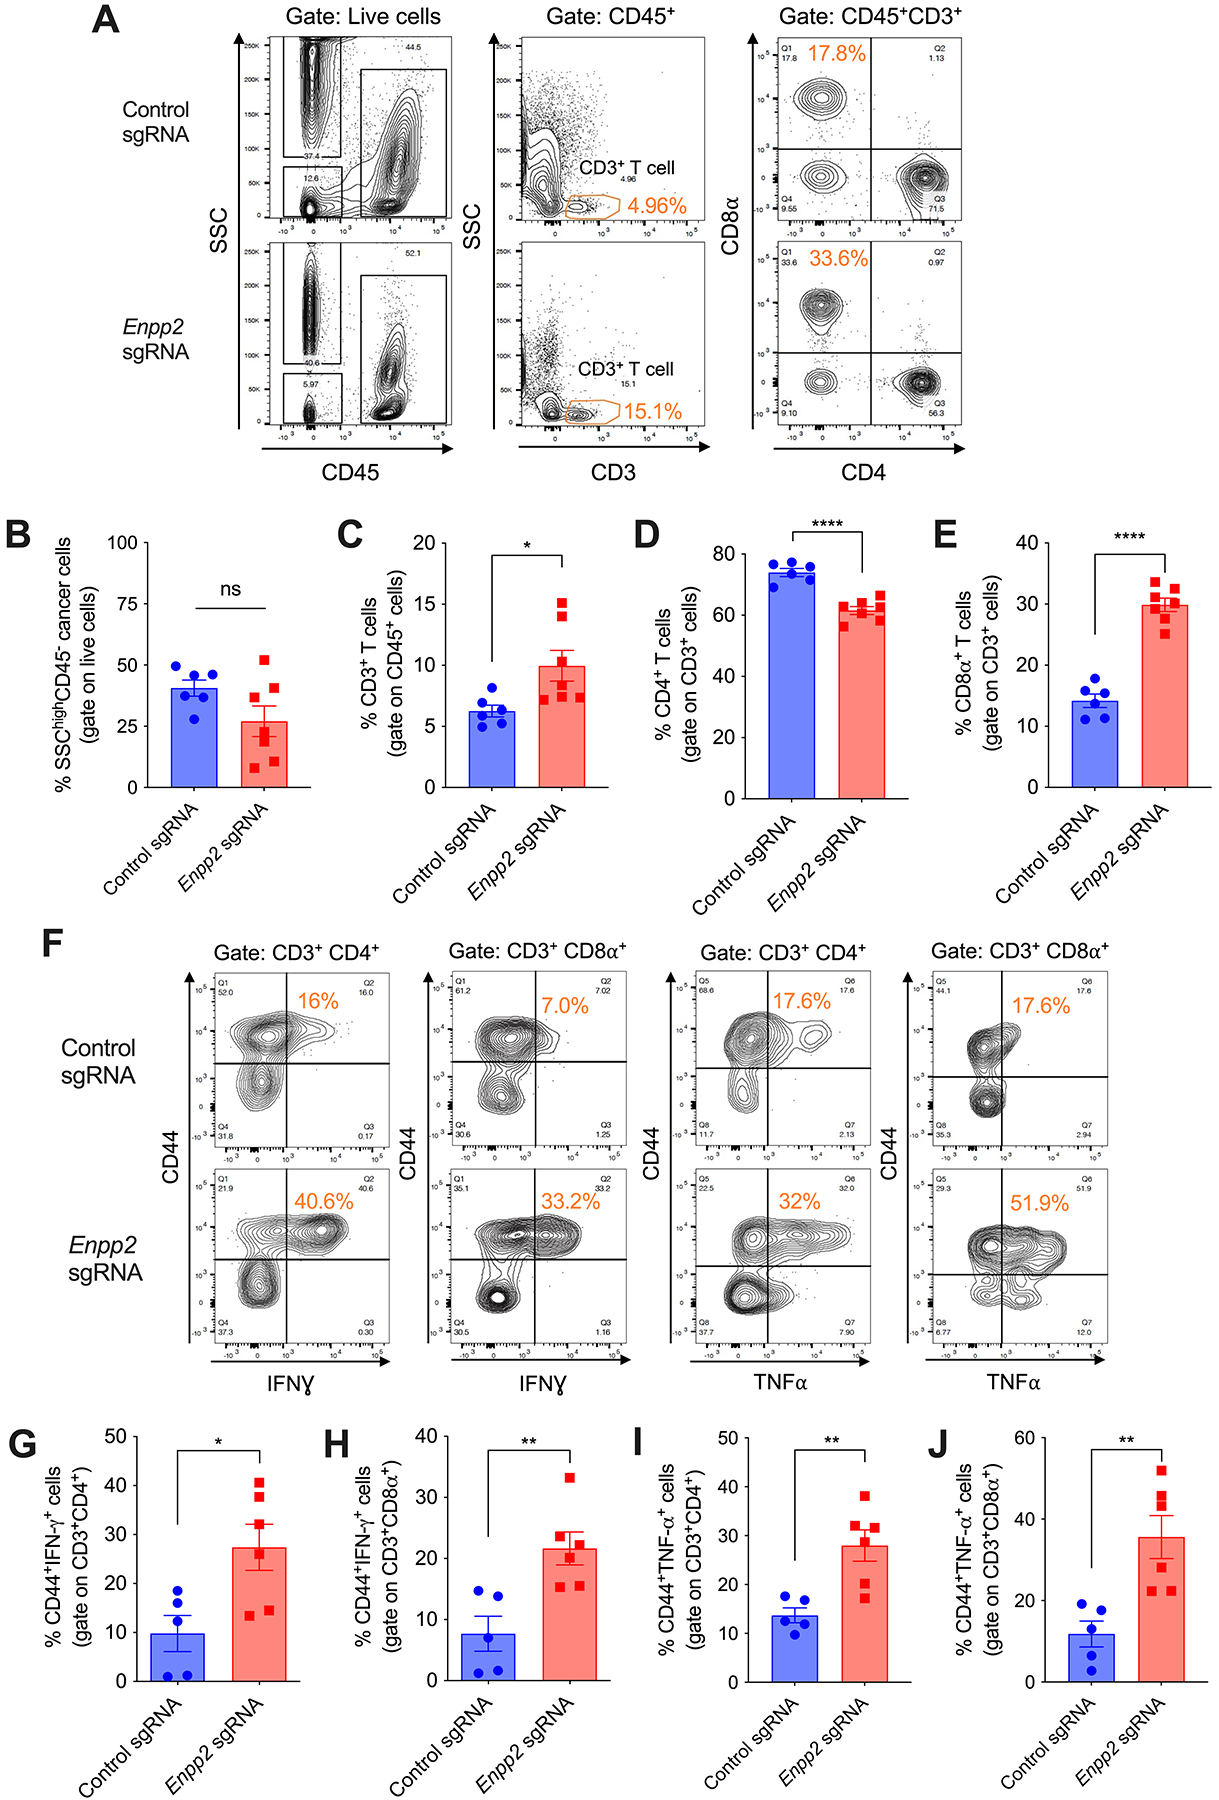
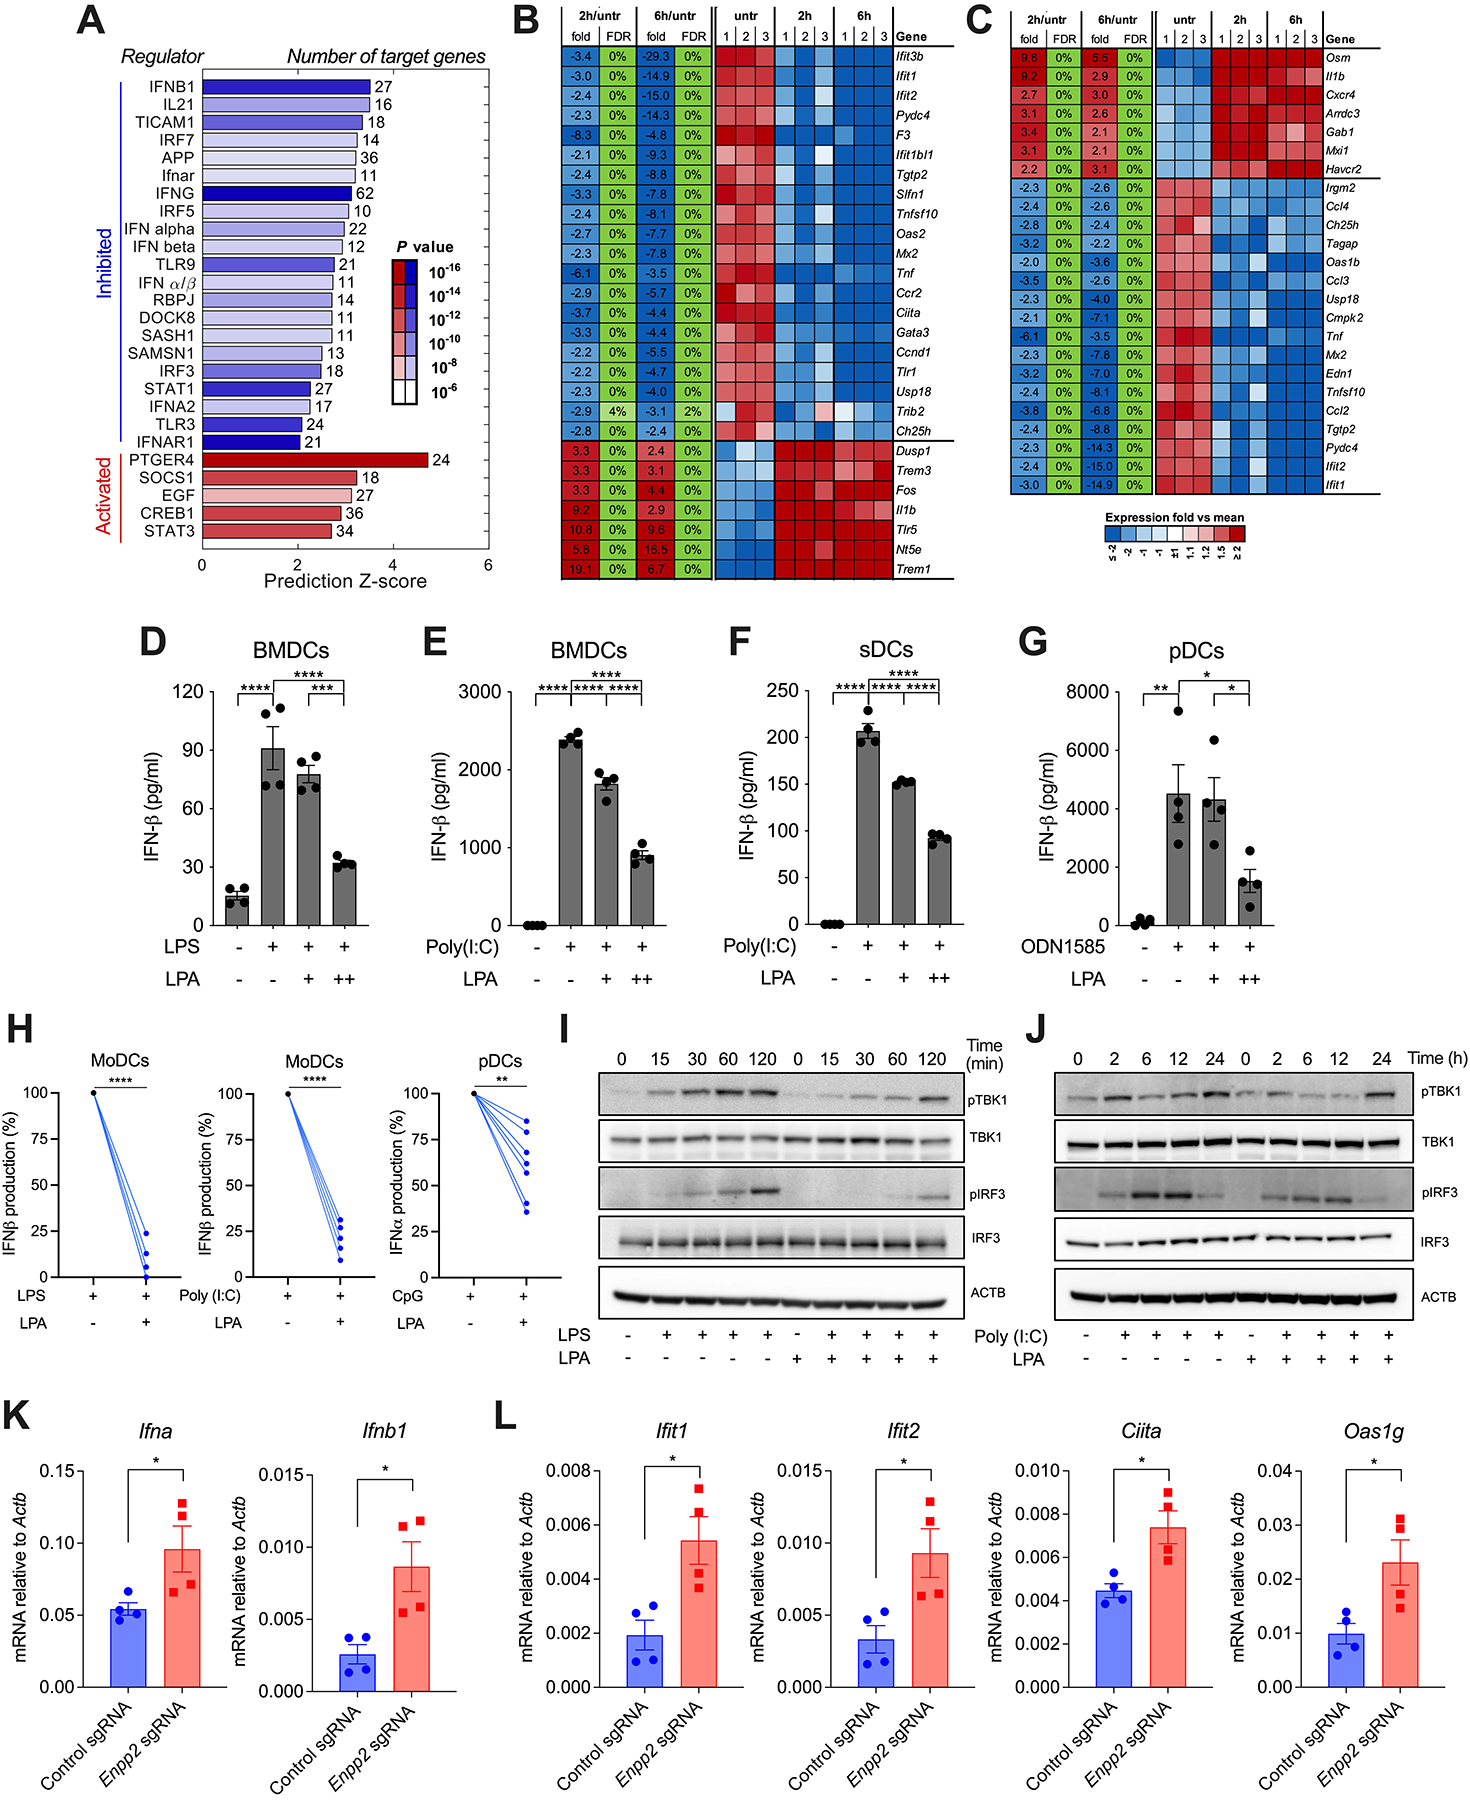
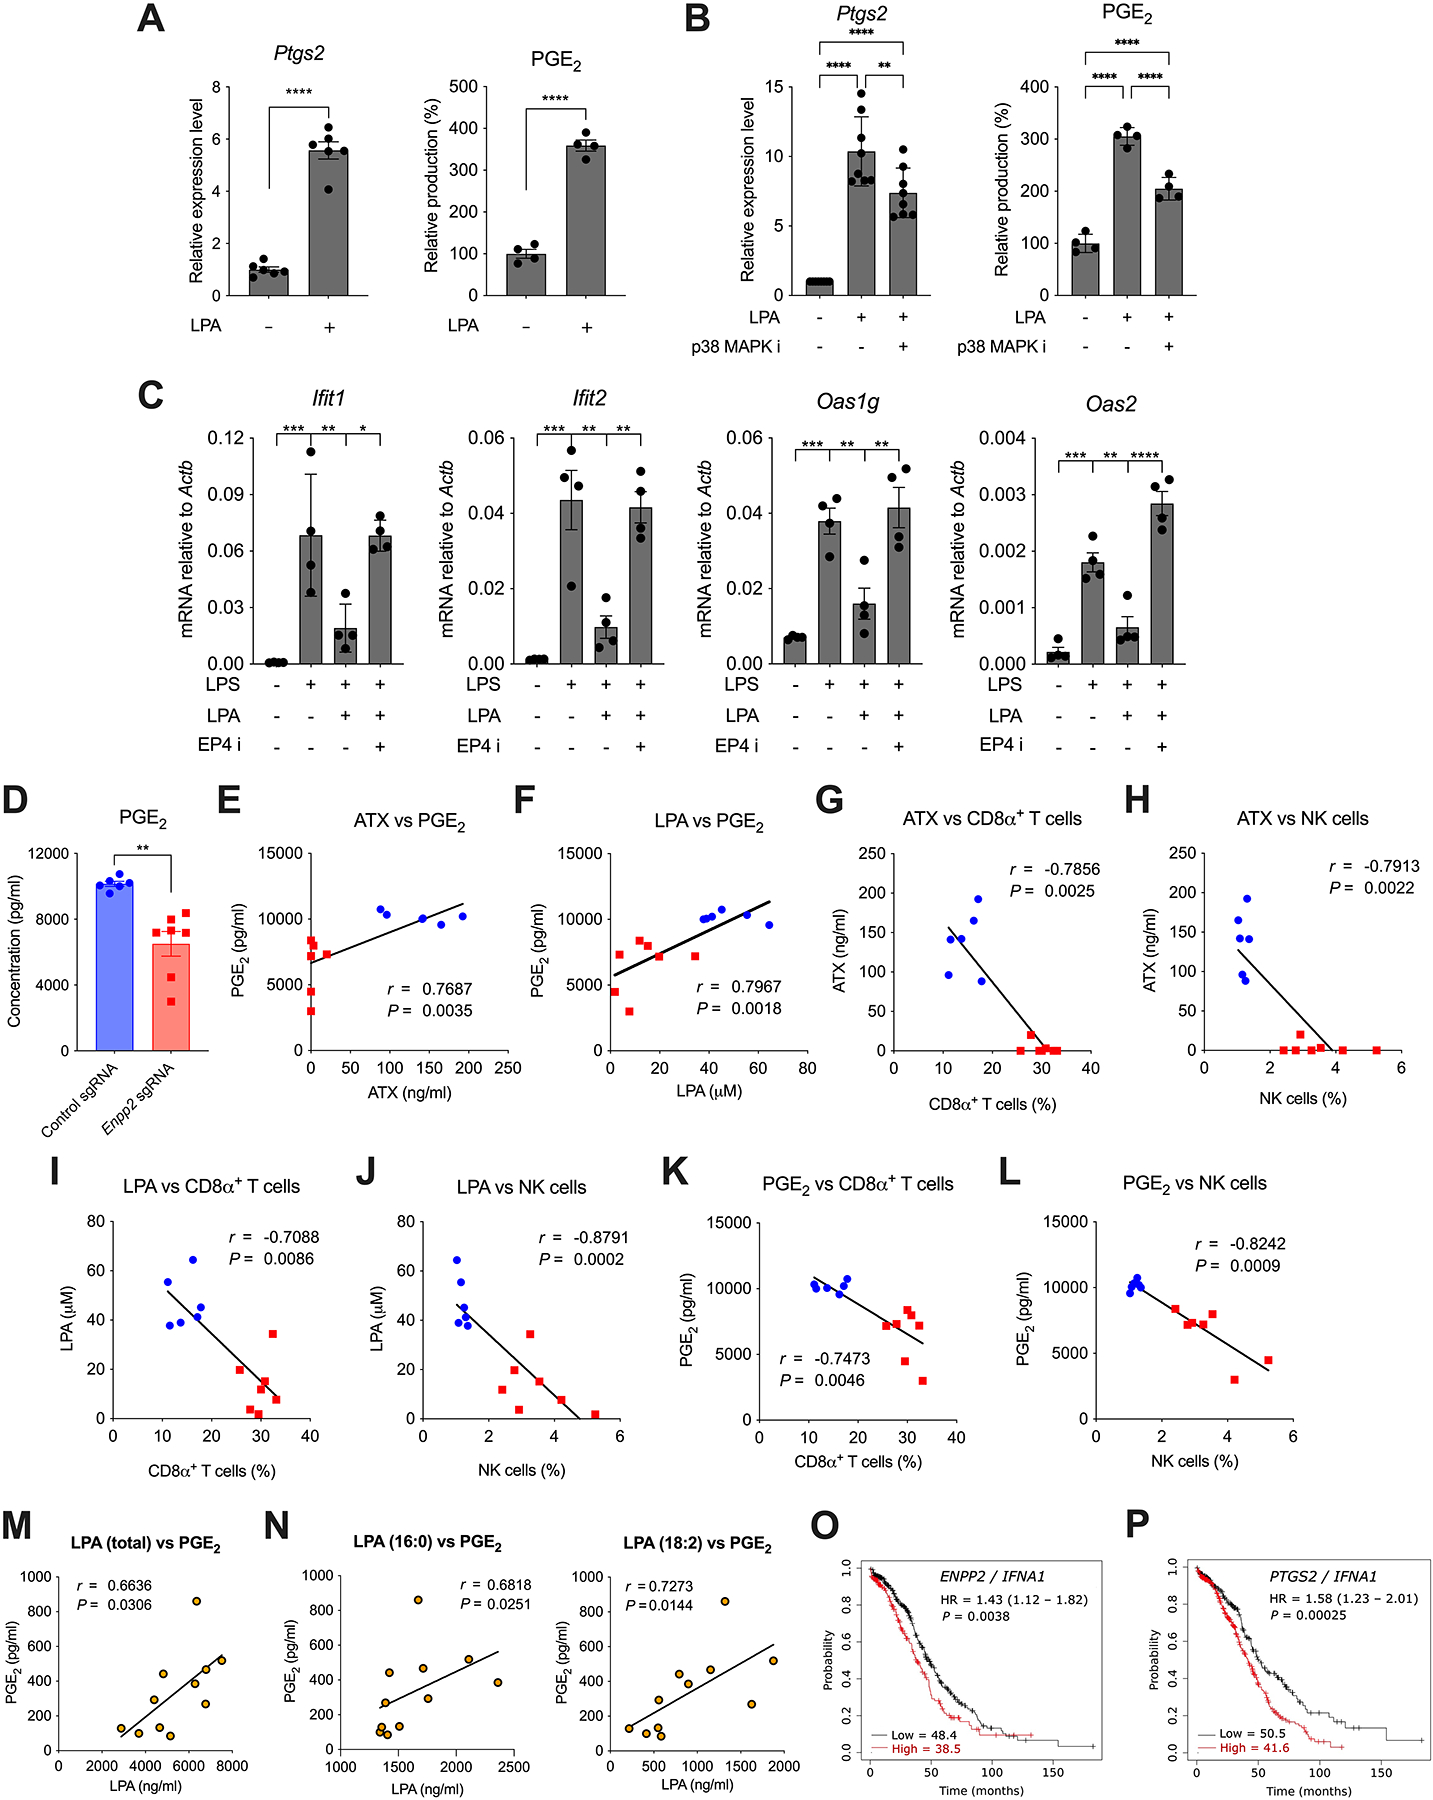
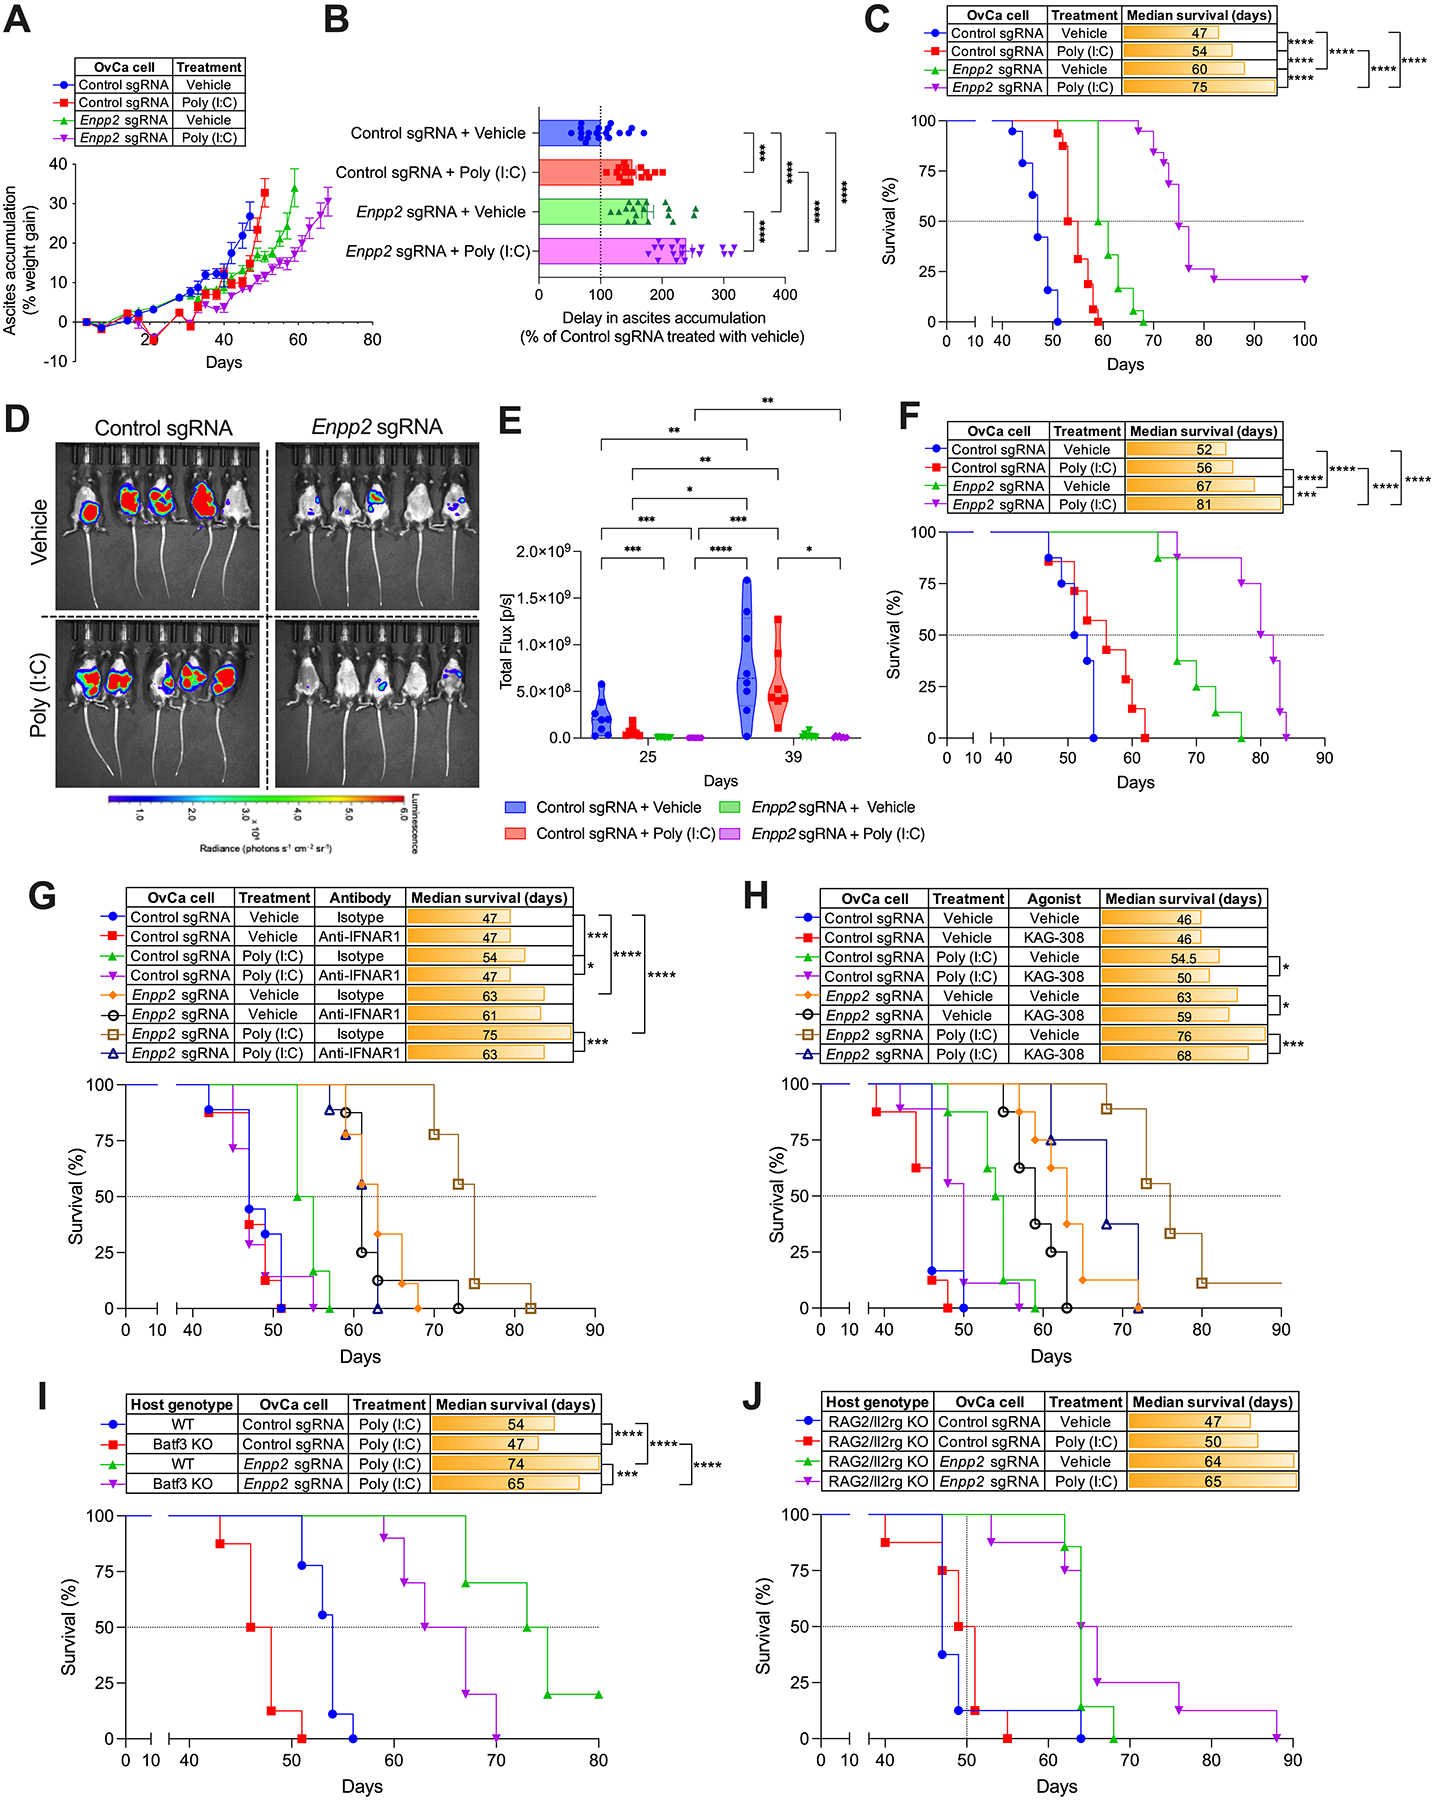
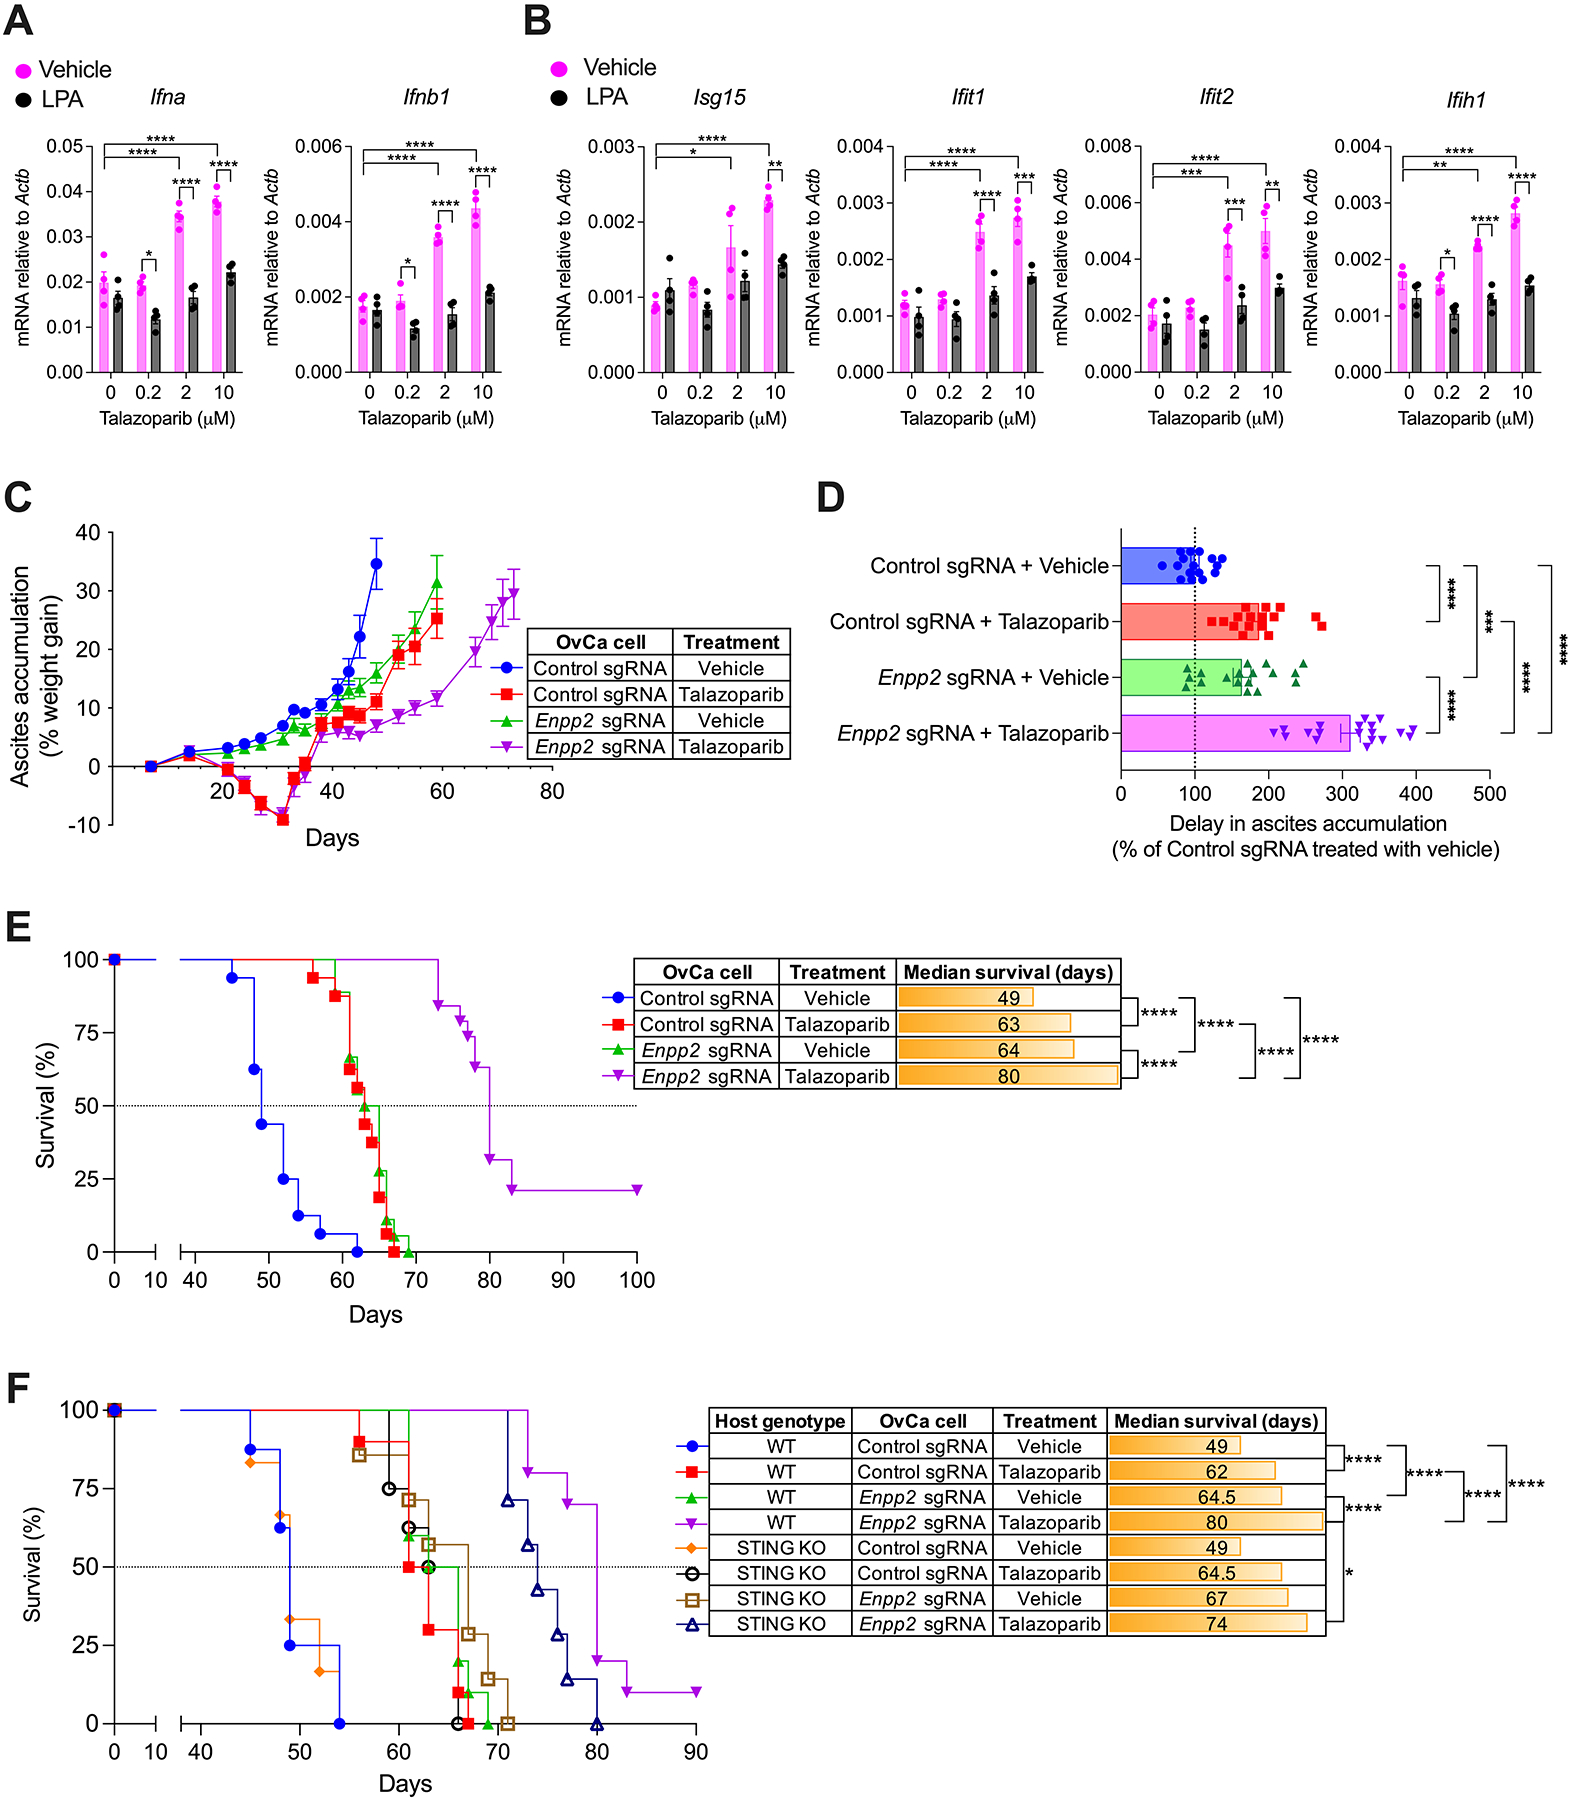
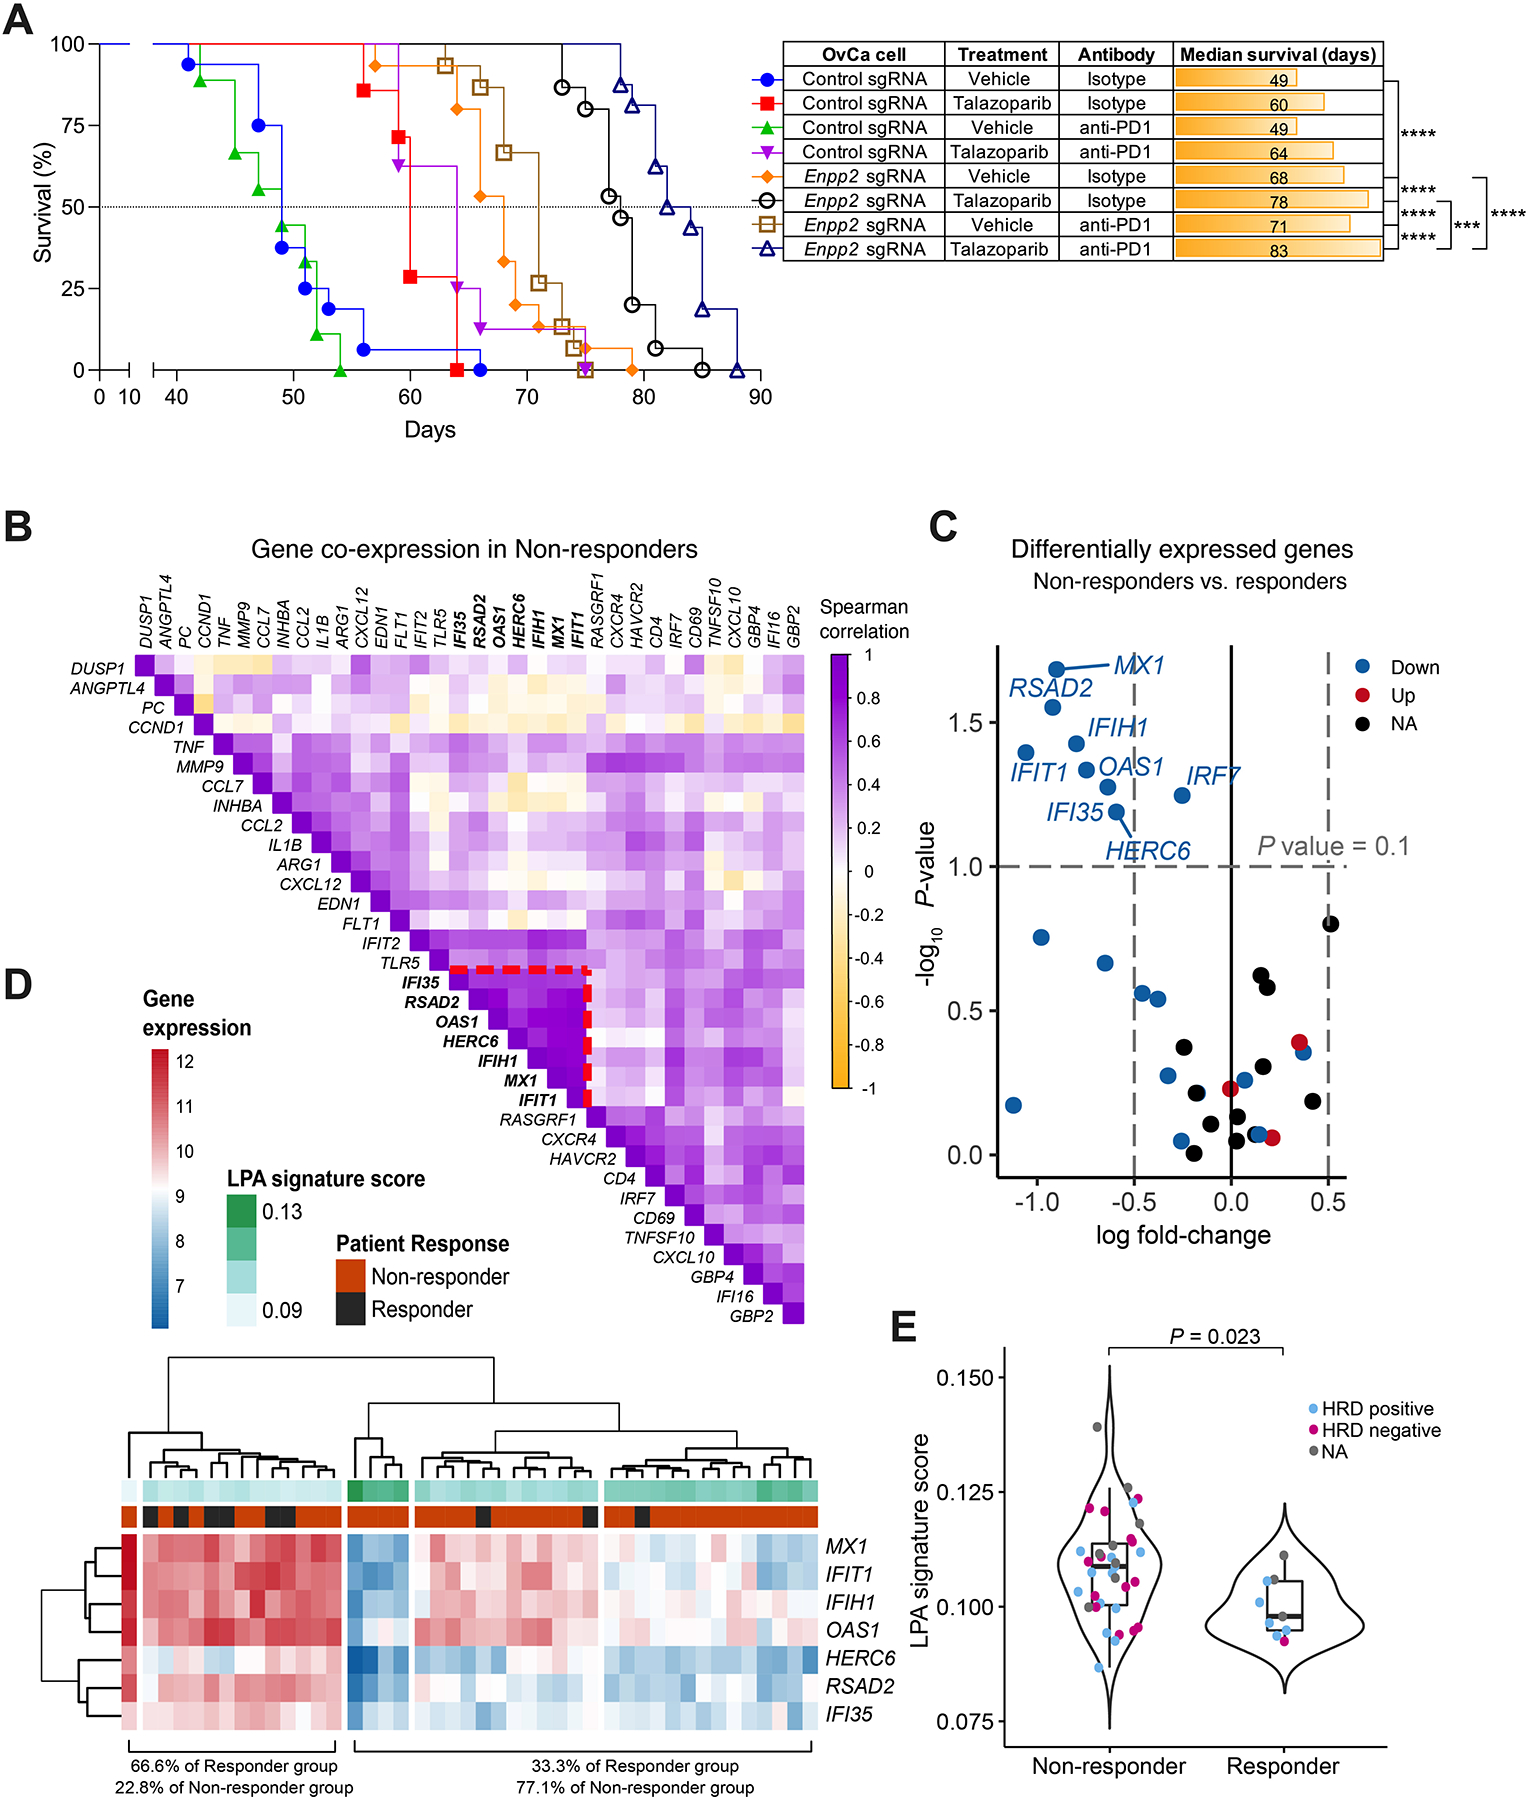
Lysophosphatidic acid (LPA) is a bioactive lipid enriched in the tumor microenvironment of immunosuppressive malignancies such as ovarian cancer. Although LPA enhances the tumorigenic attributes of cancer cells, the immunomodulatory activity of this phospholipid messenger remains largely unexplored. Here, we report that LPA operates as a negative regulator of type I interferon (IFN) responses in ovarian cancer. Ablation of the LPA-generating enzyme autotaxin (ATX) in ovarian cancer cells reprogrammed the tumor immune microenvironment, extended host survival, and improved the effects of therapies that elicit protective responses driven by type I IFN. Mechanistically, LPA sensing by dendritic cells triggered PGE2 biosynthesis that suppressed type I IFN signaling via autocrine EP4 engagement. Moreover, we identified an LPA-controlled, immune-derived gene signature associated with poor responses to combined PARP inhibition and PD-1 blockade in patients with ovarian cancer. Controlling LPA production or sensing in tumors may therefore be useful to improve cancer immunotherapies that rely on robust induction of type I IFN.

Significance: This study uncovers that ATX-LPA is a central immunosuppressive pathway in the ovarian tumor microenvironment. Ablating this axis sensitizes ovarian cancer hosts to various immunotherapies by unleashing protective type I IFN responses. Understanding the immunoregulatory programs induced by LPA could lead to new biomarkers predicting resistance to immunotherapy in patients with cancer. See related commentary by Conejo-Garcia and Curiel, p. 1841. This article is highlighted in the In This Issue feature, p. 1825.


Figures

Figure 1.
Figure 1.. Genetic loss of ATX in malignant cells compromises metastatic OvCa progression.
(A) LPA concentration was determined by ELISA in malignant ascites from human OvCa patients (n = 17) and mice bearing ID8-Defb29/Vegf-A OvCa for 5–6 weeks (n = 10). (B) Lipidomic analyses were performed to evaluate specific LPA species in malignant ascites from human OvCa patients (n = 15) and mice bearing advanced OvCa (n = 4). (C) Cancer cells, DCs, macrophages, and CD3+ T cells were sorted from peritoneal wash samples of mice bearing metastatic OvCa for 3–4 weeks (n = 9). Expression of the Enpp2 transcript was determined by RT-qPCR, and data were normalized to endogenous levels of Actb. (D) Expression of the Enpp2 transcript was determined in cancer cells sorted from the ascites of mice bearing control or Enpp2-null OvCa for 40 days (n = 6/group). (E) Autotaxin (ATX) and LPA concentrations were quantified in ascites from mice bearing control or Enpp2-null OvCa for 40 days (n = 6–7/group). (F) Ascites accumulation and (G) overall host survival in mice developing control or Enpp2-null ID8-Defb29/Vegf-A OvCa (n = 15–16 mice/group). (H) Quantification of peritoneal carcinomatosis in mice bearing luciferase-expressing control or Enpp2-null PPNM tumors for 13, 27 and 41 days (n = 24–25/group). (I) Overall survival rates for the same mice described in panel H (n = 24–25 mice/group). Data in C, D, E and F are shown as mean ± SEM. (C), One-way ANOVA (Tukey’s multiple comparisons test). (D, E), Two-tailed Student’s t-test. (F), Two-way ANOVA (Šídák’s multiple comparisons test). (H), Two-way ANOVA (Tukey’s multiple comparisons test). (G, I), Log-rank test for survival. **P<0.01, ***P<0.001, ****P<0.0001. Control sgRNA, scrambled single-guide RNA. Enpp2 sgRNA, autotaxin-targeting single-guide RNA.
Figure 2.
Figure 2.. Ablation of ATX reprograms the immune microenvironment of metastatic OvCa.
(A-E) Peritoneal wash samples were collected from mice developing control or Enpp2-null ID8-Defb29/Vegf-A OvCa for 35–40 days, and cells were analyzed by flow cytometry (n = 6–7/group). (F-J) The proportion of IFNγ− and TNFα−expressing cells within CD3+CD4+CD44+ and CD3+CD8α+CD44+ T cells was determined in the ascites of mice bearing control or Enpp2-null OvCa (n = 5–6/group). Data in B-E, G-J are shown as mean ± SEM. (C-E, G-J), Two-tailed Student’s t-test. *P<0.05, **P<0.01, ****P<0.0001.
Figure 3.
Figure 3.. LPA blunts type-I IFN production by DCs.
BMDCs were left untreated or stimulated with LPA (100 μM) for 2 or 6 hours, and global transcriptional profiles were analyzed by RNA-seq (n = 3 independent biological replicates per group). (A) Ingenuity Pathway Analysis (IPA) for predicted upstream regulators of differentially expressed genes. (B-C) Heatmap representation of type-I IFN (B) and PTGER4/EP4 (C) target genes. (D-G) BMDCs, sDCs, or pDCs were left untreated or pretreated for 2 hours with LPA at 10 μM (+) or 100 μM (++), and cells were then stimulated with LPS, Poly (I:C), or CpG ODN1585, as described in the methods. Production of IFN-β in culture supernatants was determined by ELISA (n = 4). (H) MoDCs or purified pDCs from cancer-free donors were treated with LPA (100 μM) for 2 hours and cells were then stimulated with LPS, Poly (I:C), or CpG-C274 as described in the methods (n = 5–7). Production of IFN-α or IFN-β in culture supernatants was determined by ELISA. (I-J) Representative immunoblot analysis for phospho-TBK1 (pTBK1), total TBK1, phospho-IRF3 (pIRF3), and total IRF3 in LPA-exposed BMDCs stimulated with either LPS (100 ng/ml) (I) or Poly (I:C) (10 μg/ml) (J) for the indicated times. (K-L) RT-qPCR analysis of type-I IFN transcripts (K) and type-I ISGs (L) in tDCs sorted from the ascites of mice bearing control or Enpp2-null ID8-Defb29/Vegf-A OvCa. Data were normalized to Actb in all cases (n = 4 independent mice/group). FDR, false discovery rate; fold/average, fold change of expression relative to average normalized reads of all samples; Expr, log2 value of normalized reads. Data in D-G and K-L are shown as mean ± SEM. (D-G), One-way ANOVA (Tukey’s multiple comparisons test). (H), Two-tailed paired Student’s t-test. (K, L), Two-tailed Student’s t-test. *P<0.05, **P<0.01, ***P<0.001, ****P<0.0001.
Figure 4.
Figure 4.. LPA-induced PGE2 suppresses type-I IFN responses in DCs via EP4.
(A, left) BMDCs were left untreated or incubated with LPA (100 μM) for 2 hours and expression of Ptgs2 was determined by RT-qPCR (n = 6). (A, right) BMDCs were left untreated or incubated with LPA (100 μM) for 6 hours and PGE2 was determined in culture supernatant by ELISA (n = 4). (B, left) BMDCs were pretreated with the p38 MAPK kinase inhibitor SB203580 for 1 hour and then stimulated with LPA for 2 hours. Expression of Ptgs2 was determined by RT-qPCR (n = 8). (B, right) BMDCs were pretreated with the p38 MAPK kinase inhibitor SB203580 for 1 hour and then stimulated with LPA for 6 hours. PGE2 levels were determined in culture supernatant by ELISA (n = 4). (C) BMDCs were pretreated with the EP4 antagonist PGN 1531 (5 μM) for 1 hour and then stimulated with LPA and LPS for 4 hours. Expression of type-I ISGs were quantified by RT-qPCR. Data were normalized to Actb (n = 4). (D) PGE2 was quantified in ascites fluid from mice bearing control or Enpp2-null ID8-Defb29/Vegf-A OvCa for 40 days (n = 6–7/group). Correlation of PGE2 levels with ATX (E) or LPA (F) concentration in the same samples. (G-L) Proportion of infiltrating CD8α+ T cells or NK cells vs. levels of ATX (G-H), LPA (I-J), or PGE2 (K-L) in the peritoneal cavity of mice bearing control (blue dots) or Enpp2-null (red dots) OvCa (n = 13). (M-N) PGE2 concentration vs. levels of LPA (total), LPA (16:0), and LPA (18:2) in ascites from human OvCa patients (n = 11). (O-P) Overall survival curves for HGSOC patients in TCGA cohorts classified by the expression ratios of ENPP2/IFNA1 (O) or PTGS2/IFNA1 (P); HR, Hazard ratio. Numbers in the bottom of the graph denote the median overall survival (months) for each group. Data in A-D are shown as mean ± SEM. (A, D), Two-tailed Student’s t-test. (B, C), One-way ANOVA (Tukey’s multiple comparisons test). (E-N), Spearman’s rank correlation coefficient (r). (O and P), Log-rank test. (A-D), *P<0.05, **P<0.01, ***P<0.001, ****P<0.0001. (E-P), exact P-values are shown.
Figure 5.
Figure 5.. Therapeutic effects of Poly (I:C) administration in mice bearing ATX-null OvCa.
Wild type C57BL/6J mice were challenged i.p. with control or Enpp2-null ID8-Defb29/Vegf-A (A-C; n = 16–19 mice/group) or PPNM (D-F; n = 7–8 mice/group) cancer cells. After 10 days, mice were treated with vehicle control or Poly (I:C) as described in the methods. (A) Ascites accumulation denoted as percent weight gain over time. (B) Changes in ascites development were analyzed by calculating the area above the curve in each experimental group starting on day 21 and a cutoff of 35% of weight gain. Data are represented as percent change compared with the control sgRNA group treated with vehicle. (C) Overall survival curves for the same mice described in panels A and B. (D) Representative bioluminescent imaging at day 39 and quantification of peritoneal carcinomatosis (E) in mice bearing luciferase-expressing control or Enpp2-null PPNM tumors for 25 and 39 days with or without Poly (I:C) treatment. (F) Overall survival curves for the same mice described in panels D and E. (G) Experiments were repeated as in A-C, but 3 days after tumor implantation mice (n = 6–9/group) were treated with isotype control or anti-IFNAR1 blocking antibodies, as described in the methods. Host survival was monitored over time. (H) Experiments were repeated as in A-C, but 9 days after tumor implantation mice (n = 6–9/group) were orally treated with vehicle control or the EP4 agonist KAG-308 as described in the methods. Host survival was monitored over time. (I) Overall survival in mice of the indicated genotypes implanted with control or Enpp2-null ID8-Defb29/Vegf-A OvCa treated with Poly (I:C) (n = 8–10/group). (J) Overall survival in Rag2/Il2rg double knockout mice implanted with control or Enpp2-null ID8-Defb29/Vegf-A OvCa receiving the indicated treatments (n = 7–8/group). Data in A and B are shown as mean ± SEM. (B), One-Way ANOVA with Tukey’s multiple comparisons test. (E), Two-way ANOVA (Tukey’s multiple comparisons test). (C, F, G, H, I and J), Log-rank test for survival. *P<0.05, **P<0.01, ***P<0.001, ****P<0.0001.
Figure 6.
Figure 6.. Therapeutic effects of the PARP inhibitor talazoparib in mice bearing ATX-null OvCa.
(A and B) RT-qPCR analysis of type-I IFN transcripts (A) and type-I ISGs (B) in BMDCs cocultured with talazoparib-treated OvCa cells in the presence or absence of LPA. Data were normalized to Actb in all cases (n = 4). (C-E) C57BL/6J mice (n = 16–19/group) were challenged via i.p. injection with 1.5 × 10⁶ control or Enpp2-null ID8-Defb29/Vegf-A OvCa cells. After 7 days, mice were treated once daily with vehicle or talazoparib (0.33 mg/kg) by oral gavage for up to 28 days. (C) Ascites accumulation denoted as percent weight gain over time. (D) Changes in ascites development were analyzed by calculating the area above the curve in each experimental group starting on day 35 and a cutoff of 35% of weight gain. Data are represented as percent change compared with control sgRNA group treated with vehicle. (E) Overall survival curves for the same mice described in C and D. (F) Survival experiments were repeated as described in C-E but including STING-deficient (KO) hosts (n = 6–10/group). Data in A-D are shown as mean ± SEM. (A and B), Two-way ANOVA (Tukey’s multiple comparisons test). (D), One-Way ANOVA with Tukey’s multiple comparisons test. (E and F), Log-rank test analysis for survival. *P<0.05, **P<0.01, ***P<0.001, ****P<0.0001.
Figure 7.
Figure 7.. Expression of LPA-controlled genes and clinical response to combined PARP and PD-1 inhibition.
(A) C57BL/6J female mice (n = 7–16/group) were challenged i.p. with control or Enpp2-null ID8-Defb29/Vegf-A OvCa cells. After 7 days, mice were treated with talazoparib alone or in combination with isotype control or anti-PD-1 antibodies as described in the methods, and overall survival was monitored. (B) Correlation analysis within the non-responder group uncovering a distinct module of co-regulated genes (highlighted with red dashed lines). (C) Differential mRNA expression analysis between the groups showing that the 7 co-regulated genes are significantly decreased in non-responder patients. (D) Hierarchical clustering analysis of patient groups and LPA signature score, defined as the inverse of the median expression. (E) LPA signature score distribution as a function of the response category of each sample (Kruskal-Wallis test). (A), Log-rank test for survival. ***P<0.001, ****P<0.0001

Comment in

  • Belly Fat Weakens Immune Fitness.
    Conejo-Garcia JR, Curiel TJ. Conejo-Garcia JR, et al. Cancer Discov. 2022 Aug 5;12(8):1841-1843. doi: 10.1158/2159-8290.CD-22-0611. Cancer Discov. 2022. PMID: 35929132

References

    1. Benesch MG, Tang X, Maeda T, Ohhata A, Zhao YY, Kok BP, et al. Inhibition of autotaxin delays breast tumor growth and lung metastasis in mice. FASEB J 2014;28(6):2655–66 doi 10.1096/fj.13-248641. - DOI - PubMed
    1. Chen J, Li H, Xu W, Guo X. Evaluation of serum ATX and LPA as potential diagnostic biomarkers in patients with pancreatic cancer. BMC Gastroenterol 2021;21(1):58 doi 10.1186/s12876-021-01635-6. - DOI - PMC - PubMed
    1. Li YY, Zhang WC, Zhang JL, Zheng CJ, Zhu H, Yu HM, et al. Plasma levels of lysophosphatidic acid in ovarian cancer versus controls: a meta-analysis. Lipids Health Dis 2015;14:72 doi 10.1186/s12944-015-0071-9. - DOI - PMC - PubMed
    1. Liu S, Umezu-Goto M, Murph M, Lu Y, Liu W, Zhang F, et al. Expression of autotaxin and lysophosphatidic acid receptors increases mammary tumorigenesis, invasion, and metastases. Cancer Cell 2009;15(6):539–50 doi 10.1016/j.ccr.2009.03.027. - DOI - PMC - PubMed
    1. Yamada T, Sato K, Komachi M, Malchinkhuu E, Tobo M, Kimura T, et al. Lysophosphatidic acid (LPA) in malignant ascites stimulates motility of human pancreatic cancer cells through LPA1. J Biol Chem 2004;279(8):6595–605 doi 10.1074/jbc.M308133200. - DOI - PubMed

Publication types

MeSH terms