Intestinal Enteroendocrine Cell Signaling: Retinol-binding Protein 2 and Retinoid Actions
- PMID: 35552670
- PMCID: PMC9162388
- DOI: 10.1210/endocr/bqac064
Intestinal Enteroendocrine Cell Signaling: Retinol-binding Protein 2 and Retinoid Actions
Abstract
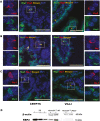
Retinol-binding protein 2-deficient (Rbp2-/-) mice are more prone to obesity, glucose intolerance, and hepatic steatosis than matched controls. Glucose-dependent insulinotropic polypeptide (GIP) blood levels are dysregulated in these mice. The present studies provide new insights into these observations. Single cell transcriptomic and immunohistochemical studies establish that RBP2 is highly expressed in enteroendocrine cells (EECs) that produce incretins, either GIP or glucagon-like peptide-1. EECs also express an enzyme needed for all-trans-retinoic acid (ATRA) synthesis, aldehyde dehydrogenase 1 family member A1, and retinoic acid receptor-alpha, which mediates ATRA-dependent transcription. Total and GIP-positive EECs are significantly lower in Rbp2-/- mice. The plasma transport protein for retinol, retinol-binding protein 4 (RBP4) is also expressed in EECs and is cosecreted with GIP upon stimulation. Collectively, our data support direct roles for RBP2 and ATRA in cellular processes that give rise to GIP-producing EECs and roles for RBP2 and RBP4 within EECs that facilitate hormone storage and secretion.
Keywords: enteroendocrine cells; glucagon-like peptide-1; glucose-dependent insulinotropic polypeptide; incretins; retinoids; retinol-binding protein 2.
© The Author(s) 2022. Published by Oxford University Press on behalf of the Endocrine Society. All rights reserved. For permissions, please e-mail: journals.permissions@oup.com.
Figures


Similar articles
-
Dietary Vitamin A Affects the Function of Incretin-Producing Enteroendocrine Cells in Male Mice Fed a High-Fat Diet.J Nutr. 2023 Oct;153(10):2901-2914. doi: 10.1016/j.tjnut.2023.08.030. Epub 2023 Aug 28. J Nutr. 2023. PMID: 37648113 Free PMC article.
-
Retinoids and retinoid-binding proteins: Unexpected roles in metabolic disease.Curr Top Dev Biol. 2025;161:89-111. doi: 10.1016/bs.ctdb.2024.10.001. Epub 2024 Oct 24. Curr Top Dev Biol. 2025. PMID: 39870440 Free PMC article. Review.
-
Retinol-binding protein 2 (RBP2): biology and pathobiology.Crit Rev Biochem Mol Biol. 2020 Apr;55(2):197-218. doi: 10.1080/10409238.2020.1768207. Epub 2020 May 28. Crit Rev Biochem Mol Biol. 2020. PMID: 32466661 Free PMC article. Review.
-
Retinol-binding protein 2 (RBP2): More than just dietary retinoid uptake.Biochim Biophys Acta Mol Cell Biol Lipids. 2022 Aug;1867(8):159179. doi: 10.1016/j.bbalip.2022.159179. Epub 2022 May 6. Biochim Biophys Acta Mol Cell Biol Lipids. 2022. PMID: 35533980 Free PMC article. Review.
-
Retinol-binding protein 2 (RBP2) binds monoacylglycerols and modulates gut endocrine signaling and body weight.Sci Adv. 2020 Mar 11;6(11):eaay8937. doi: 10.1126/sciadv.aay8937. eCollection 2020 Mar. Sci Adv. 2020. PMID: 32195347 Free PMC article.
Cited by
-
Dietary Vitamin A Affects the Function of Incretin-Producing Enteroendocrine Cells in Male Mice Fed a High-Fat Diet.J Nutr. 2023 Oct;153(10):2901-2914. doi: 10.1016/j.tjnut.2023.08.030. Epub 2023 Aug 28. J Nutr. 2023. PMID: 37648113 Free PMC article.
-
Effect of empagliflozin on circulating proteomics in heart failure: mechanistic insights into the EMPEROR programme.Eur Heart J. 2022 Dec 21;43(48):4991-5002. doi: 10.1093/eurheartj/ehac495. Eur Heart J. 2022. PMID: 36017745 Free PMC article. Clinical Trial.
-
Retinoids and retinoid-binding proteins: Unexpected roles in metabolic disease.Curr Top Dev Biol. 2025;161:89-111. doi: 10.1016/bs.ctdb.2024.10.001. Epub 2024 Oct 24. Curr Top Dev Biol. 2025. PMID: 39870440 Free PMC article. Review.
-
Stratification of enterochromaffin cells by single-cell expression analysis.bioRxiv [Preprint]. 2025 Jan 23:2023.08.24.554649. doi: 10.1101/2023.08.24.554649. bioRxiv. 2025. Update in: Elife. 2025 Apr 04;12:RP90596. doi: 10.7554/eLife.90596. PMID: 37662229 Free PMC article. Updated. Preprint.
-
Single-cell resolution of intestinal regeneration in pythons without crypts illuminates conserved vertebrate regenerative mechanisms.Proc Natl Acad Sci U S A. 2024 Oct 22;121(43):e2405463121. doi: 10.1073/pnas.2405463121. Epub 2024 Oct 18. Proc Natl Acad Sci U S A. 2024. PMID: 39423244 Free PMC article.
References
-
- Ong DE, Newcomer M, Chytil F. Cellular retinoid-binding proteins. In: The Retinoids: Biology, Chemistry and Medicine. 2nd ed. Raven Press; 1994: 283-318.
-
- Ong DE. Vitamin A-binding proteins. Nutr Rev. 1985;43(8):225-232. - PubMed
-
- Cheng L, Qian SJ, Rothschild C, et al. . Alteration of the binding specificity of cellular retinol-binding protein II by site-directed mutagenesis. J Biol Chem. 1991;266(36):24404-24412. - PubMed
Publication types
MeSH terms
Substances
Grants and funding
LinkOut - more resources
Full Text Sources
Molecular Biology Databases
Miscellaneous

