

Simultaneous high-resolution T2 -weighted imaging and quantitative T2 mapping at low magnetic field strengths using a multiple TE and multi-orientation acquisition approach
- PMID: 35553454
- PMCID: PMC9322579
- DOI: 10.1002/mrm.29273
Simultaneous high-resolution T2 -weighted imaging and quantitative T2 mapping at low magnetic field strengths using a multiple TE and multi-orientation acquisition approach
Abstract
Purpose: Low magnetic field systems provide an important opportunity to expand MRI to new and diverse clinical and research study populations. However, a fundamental limitation of low field strength systems is the reduced SNR compared to 1.5 or 3T, necessitating compromises in spatial resolution and imaging time. Most often, images are acquired with anisotropic voxels with low through-plane resolution, which provide acceptable image quality with reasonable scan times, but can impair visualization of subtle pathology.
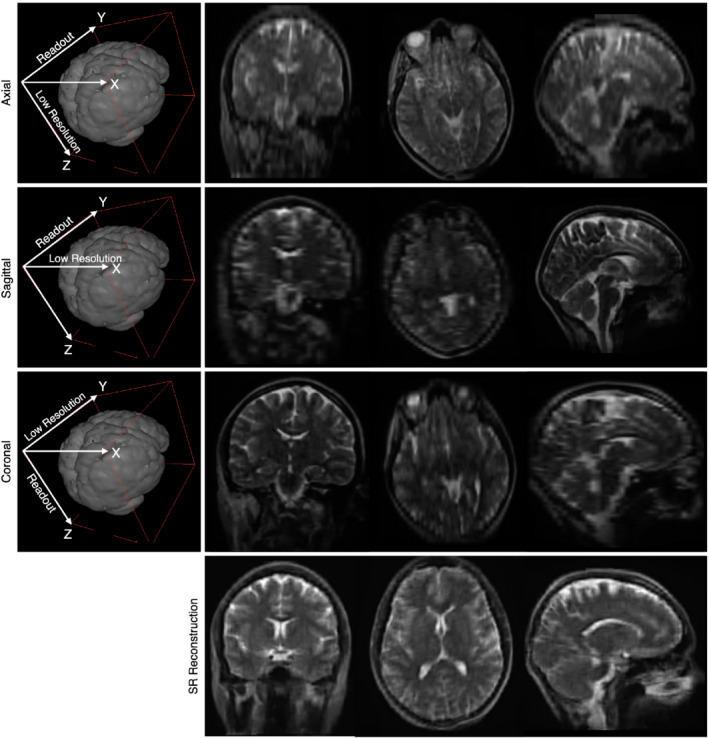
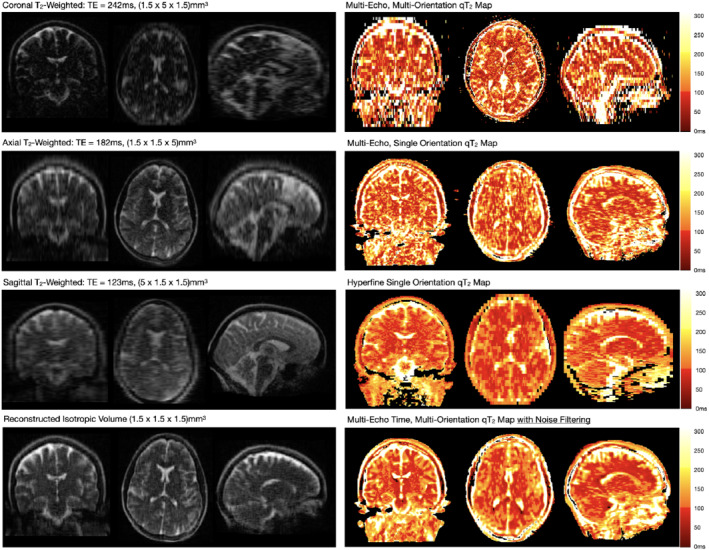
Methods: Here, we describe a super-resolution approach to reconstruct high-resolution isotropic T2 -weighted images from a series of low-resolution anisotropic images acquired in orthogonal orientations. Furthermore, acquiring each image with an incremented TE allows calculations of quantitative T2 images without time penalty.
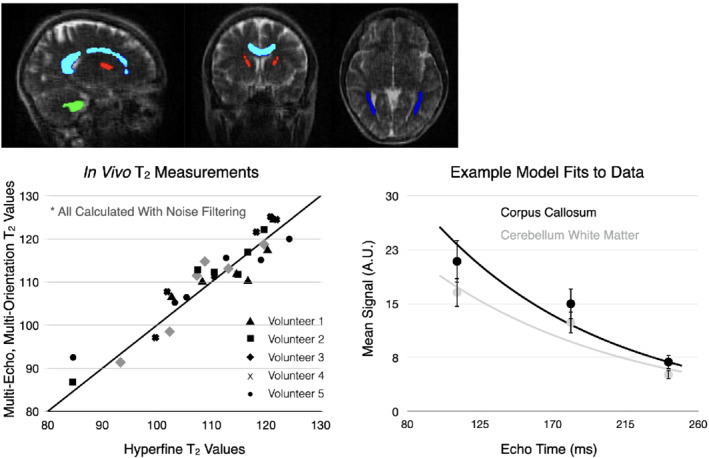
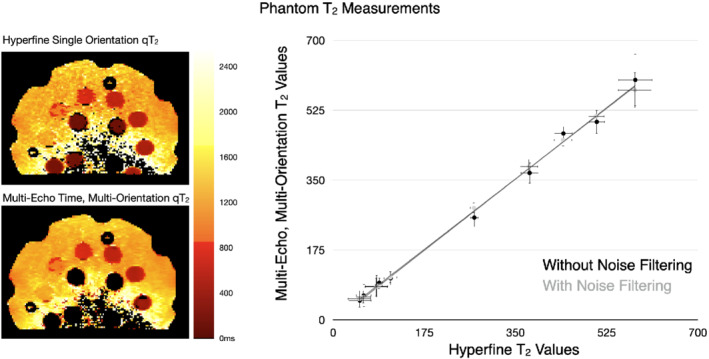
Results: Our approach is demonstrated via phantom and in vivo human brain imaging, with simultaneous 1.5 × 1.5 × 1.5 mm3 T2 -weighted and quantitative T2 maps acquired using a clinically feasible approach that combines three acquisition that require approximately 4-min each to collect. Calculated T2 values agree with reference multiple TE measures with intraclass correlation values of 0.96 and 0.85 in phantom and in vivo measures, respectively, in line with previously reported brain T2 values at 150 mT, 1.5T, and 3T.
Conclusion: Our multi-orientation and multi-TE approach is a time-efficient method for high-resolution T2 -weighted images for anatomical visualization with simultaneous quantitative T2 imaging for increased sensitivity to tissue microstructure and chemical composition.
Keywords: child brain development; low field MRI; magnetic resonance imaging; pediatric neuroimaging.
© 2022 The Authors. Magnetic Resonance in Medicine published by Wiley Periodicals LLC on behalf of International Society for Magnetic Resonance in Medicine.
Conflict of interest statement
The authors report no significant financial conflicts of interest with respect to the subject matter of this manuscript.
Figures
Similar articles
-
Blip up-down acquisition for spin- and gradient-echo imaging (BUDA-SAGE) with self-supervised denoising enables efficient T2 , T2 *, para- and dia-magnetic susceptibility mapping.Magn Reson Med. 2022 Aug;88(2):633-650. doi: 10.1002/mrm.29219. Epub 2022 Apr 18. Magn Reson Med. 2022. PMID: 35436357
-
Model-based super-resolution reconstruction of T2 maps.Magn Reson Med. 2020 Mar;83(3):906-919. doi: 10.1002/mrm.27981. Epub 2019 Sep 13. Magn Reson Med. 2020. PMID: 31517404
-
T2-weighted turbo spin-echo magnetic resonance imaging of canine brain anatomy at 1.5T, 3T, and 7T field strengths.Anat Rec (Hoboken). 2022 Jan;305(1):222-233. doi: 10.1002/ar.24724. Epub 2021 Aug 19. Anat Rec (Hoboken). 2022. PMID: 34357697
-
Tailored magnetic resonance fingerprinting for simultaneous non-synthetic and quantitative imaging: A repeatability study.Med Phys. 2022 Mar;49(3):1673-1685. doi: 10.1002/mp.15465. Epub 2022 Feb 7. Med Phys. 2022. PMID: 35084744
-
Initial assessment of 3D magnetic resonance fingerprinting (MRF) towards quantitative brain imaging for radiation therapy.Med Phys. 2020 Mar;47(3):1199-1214. doi: 10.1002/mp.13967. Epub 2019 Dec 30. Med Phys. 2020. PMID: 31834641
Cited by
-
A Novel Portable, Mobile MRI: Comparison with an Established Low-Field Intraoperative MRI System.Asian J Neurosurg. 2023 Sep 22;18(3):492-498. doi: 10.1055/s-0043-1760857. eCollection 2023 Sep. Asian J Neurosurg. 2023. PMID: 38152522 Free PMC article.
-
Morphological Brain Analysis Using Ultra Low-Field MRI.Hum Brain Mapp. 2025 Jul;46(10):e70232. doi: 10.1002/hbm.70232. Hum Brain Mapp. 2025. PMID: 40586128 Free PMC article.
-
Relaxation measurements of an MRI system phantom at low magnetic field strengths.MAGMA. 2023 Jul;36(3):477-485. doi: 10.1007/s10334-023-01086-y. Epub 2023 May 20. MAGMA. 2023. PMID: 37209233 Free PMC article.
-
Evaluating analytic strategies to obtain high-resolution, vertex-level measures of cortical neuroanatomy in children in low- and middle-income countries.Commun Biol. 2025 Jun 12;8(1):918. doi: 10.1038/s42003-025-08322-2. Commun Biol. 2025. PMID: 40506530 Free PMC article.
-
Super resolution using sparse sampling at portable ultra-low field MR.Front Neurol. 2024 May 24;15:1330203. doi: 10.3389/fneur.2024.1330203. eCollection 2024. Front Neurol. 2024. PMID: 38854960 Free PMC article.
References
-
- Renner N, Kleyer A, Kronke G, et al. T2 mapping as a new method for quantitative assessment of cartilage damage in rheumatoid arthritis. J Rheumatol. 2020;47:820‐825. - PubMed
Publication types
MeSH terms
Grants and funding
LinkOut - more resources
Full Text Sources
Medical
