. 2022 Jun 22;11(6):613-629.
doi: 10.1093/stcltm/szac022.

Maturation Delay of Human GABAergic Neurogenesis in Fragile X Syndrome Pluripotent Stem Cells

Affiliations

Maturation Delay of Human GABAergic Neurogenesis in Fragile X Syndrome Pluripotent Stem Cells

Ai Zhang et al. Stem Cells Transl Med. .

Abstract

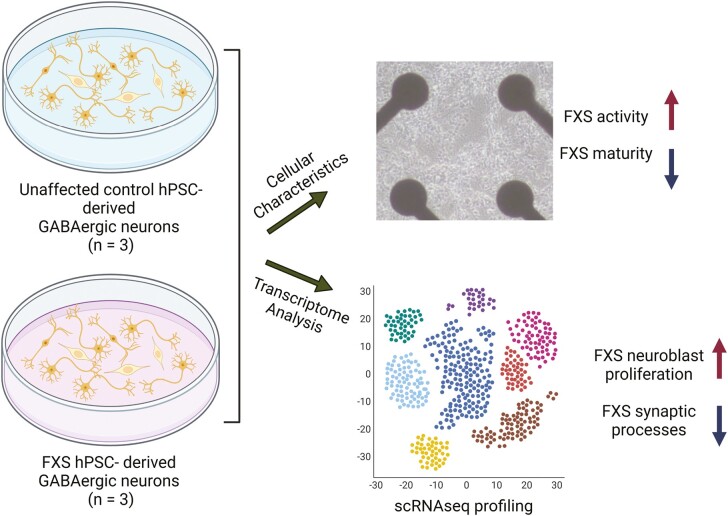
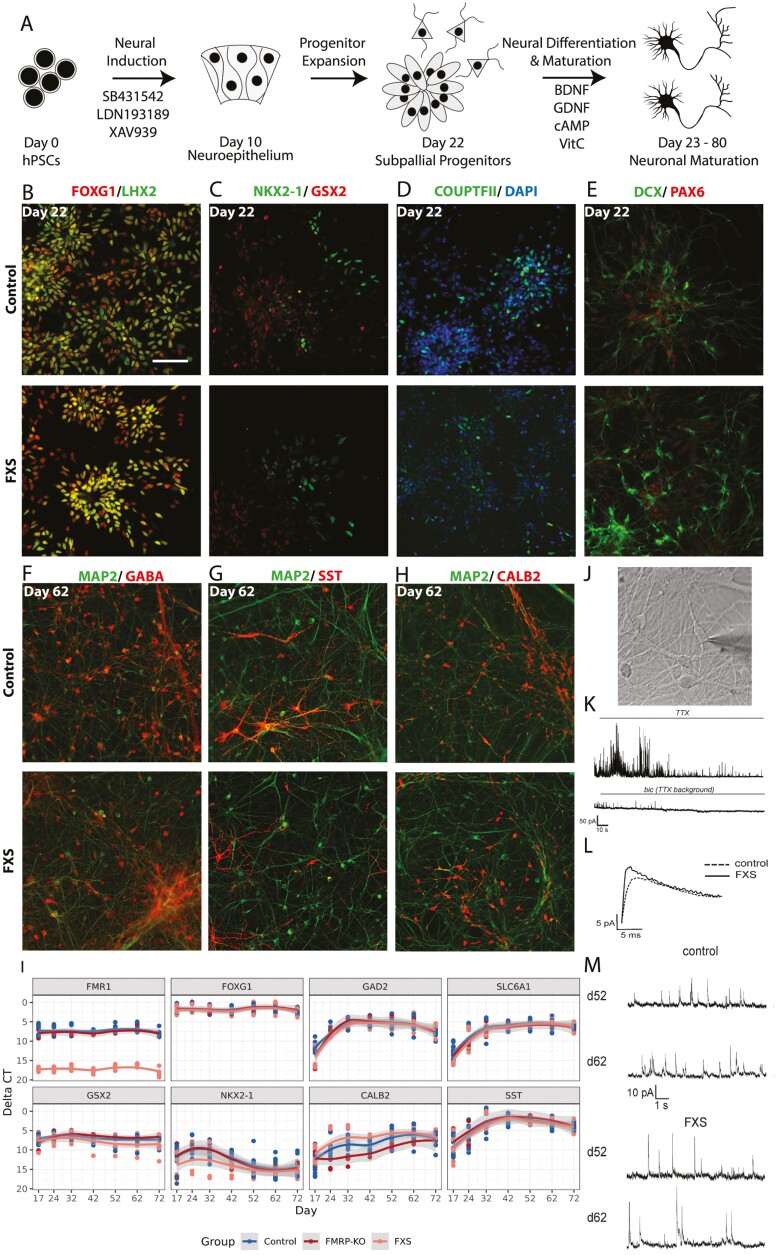
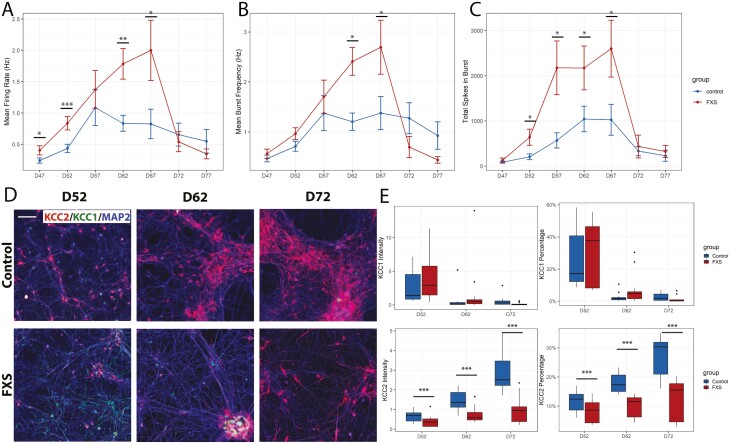
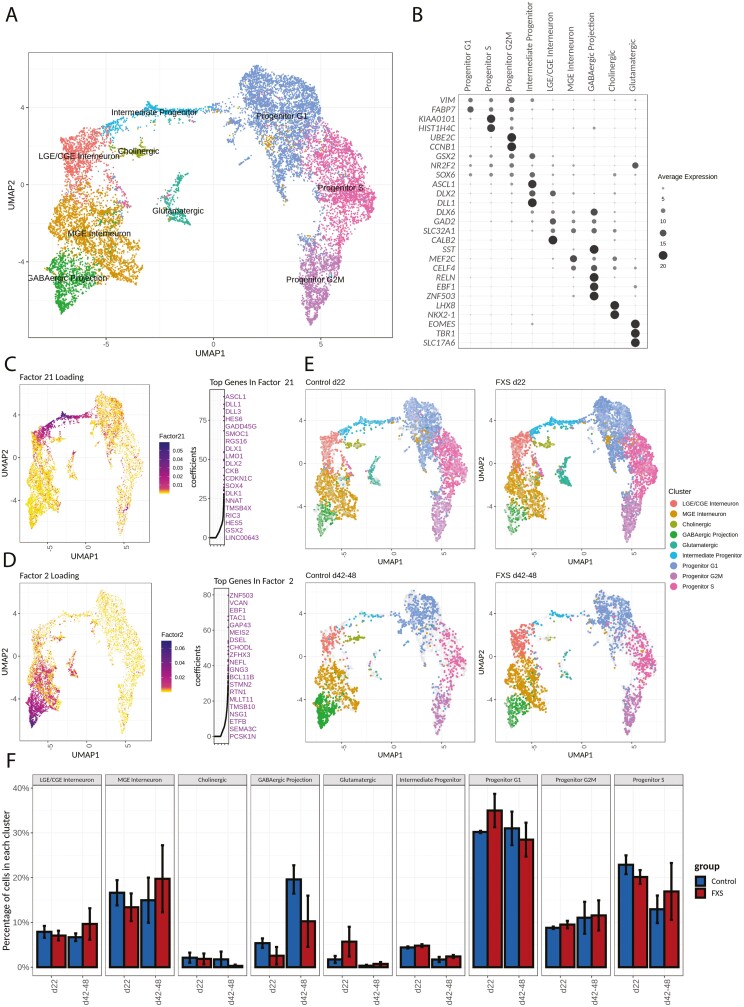
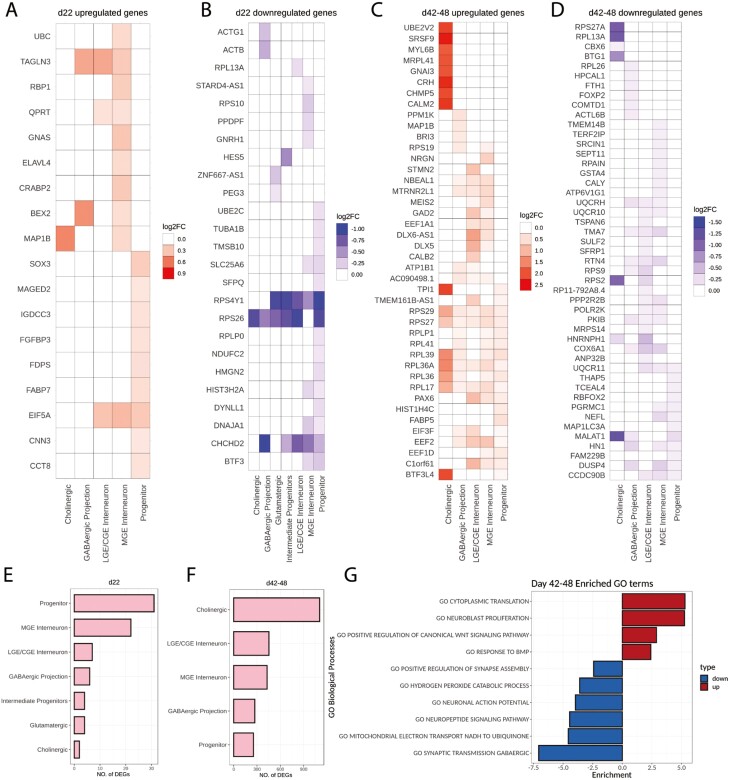
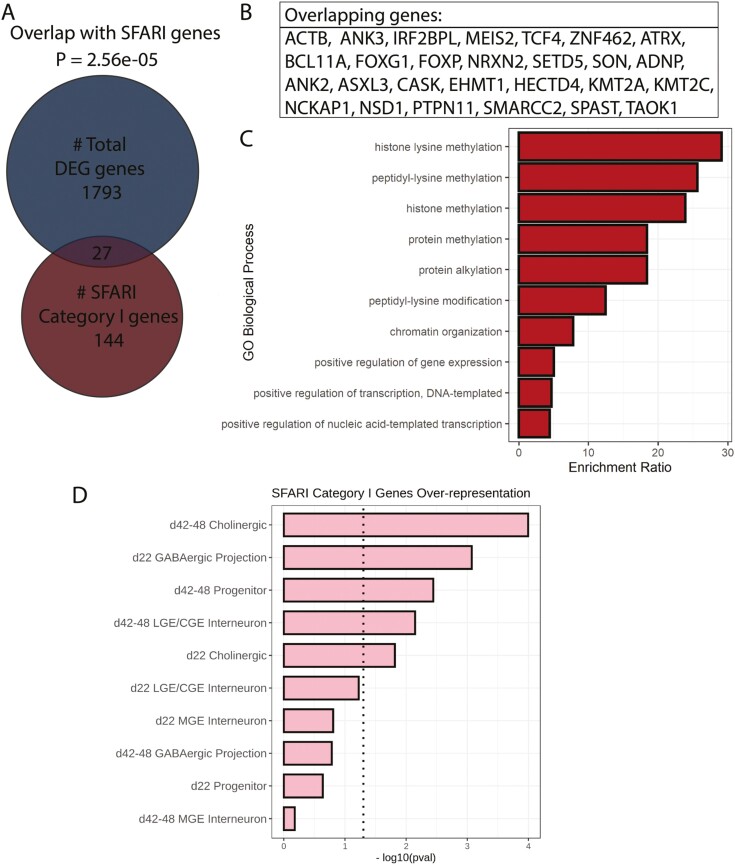
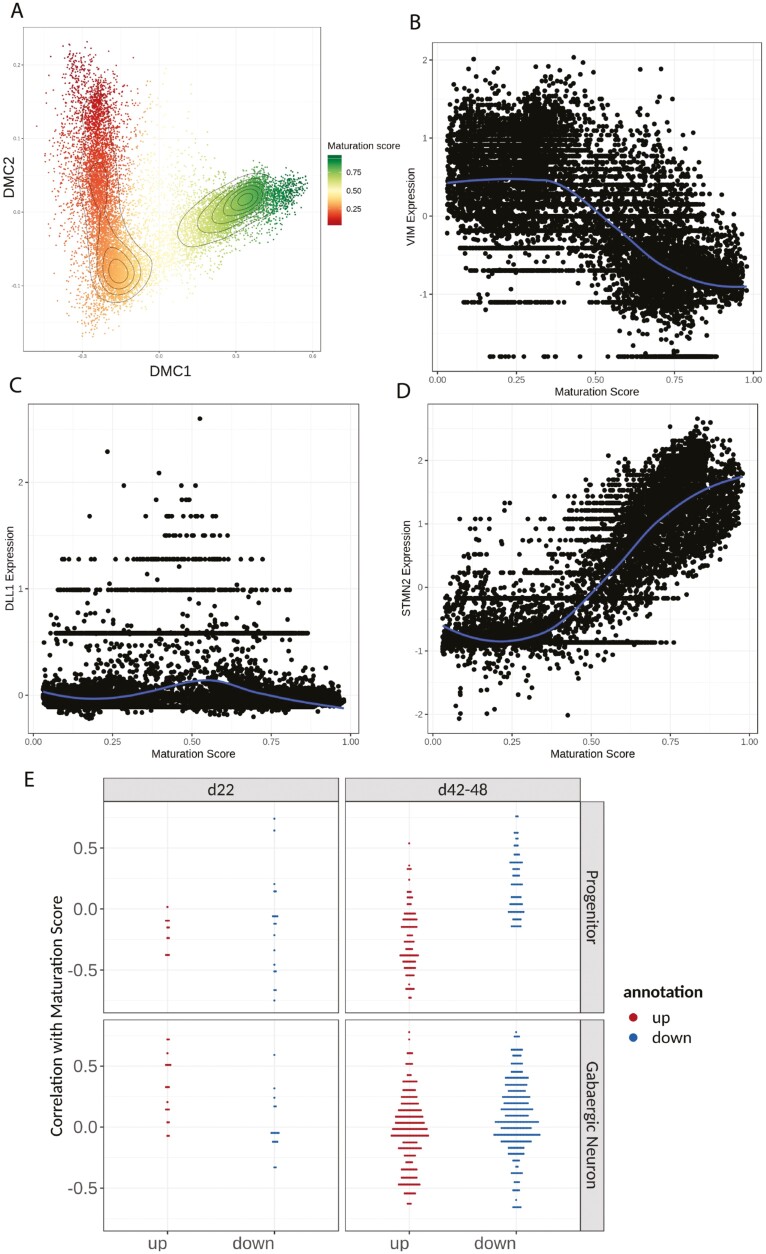
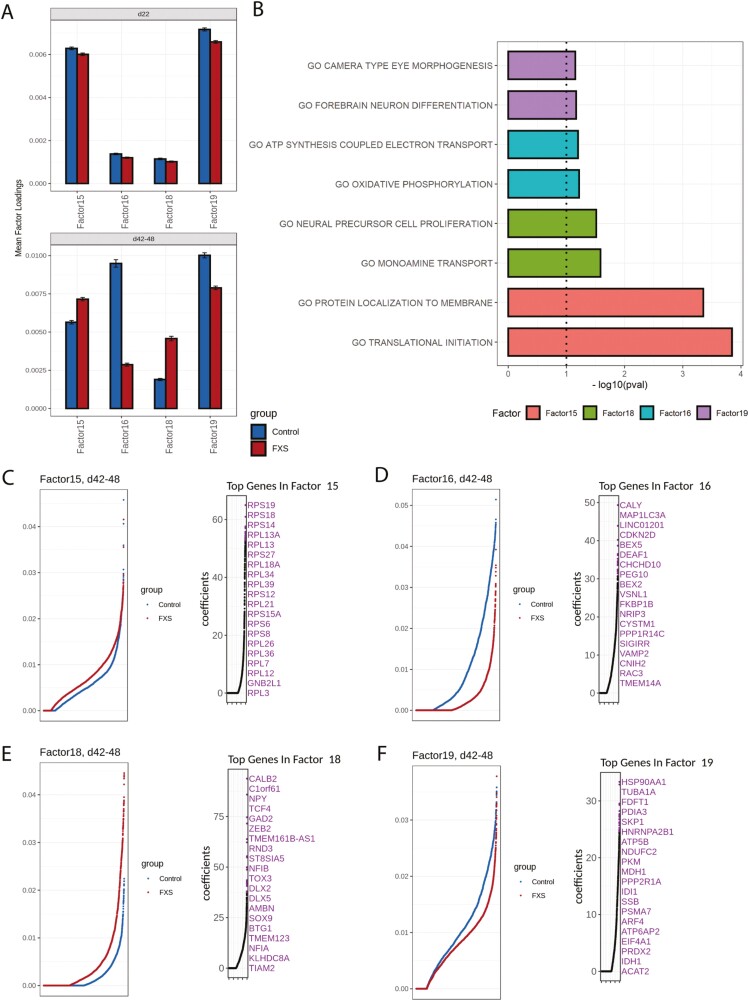
Fragile X Syndrome (FXS), the leading monogenic cause of intellectual disability and autism spectrum disorder, is caused by expansion of a CGG trinucleotide repeat in the 5'-UTR of the Fragile X Mental Retardation-1 (FMR1) gene. Epigenetic silencing of FMR1 results in loss of the Fragile X Mental Retardation Protein (FMRP). Although most studies to date have focused on excitatory neurons, recent evidence suggests that GABAergic inhibitory networks are also affected. To investigate human GABAergic neurogenesis, we established a method to reproducibly derive inhibitory neurons from multiple FXS and control human pluripotent stem cell (hPSC) lines. Electrophysiological analyses suggested that the developing FXS neurons had a delay in the GABA functional switch, a transition in fetal development that converts the GABAA channel's function from depolarization to hyperpolarization, with profound effects on the developing brain. To investigate the cause of this delay, we analyzed 14 400 single-cell transcriptomes from FXS and control cells at 2 stages of GABAergic neurogenesis. While control and FXS cells were similar at the earlier time point, the later-stage FXS cells retained expression of neuroblast proliferation-associated genes and had lower levels of genes associated with action potential regulation, synapses, and mitochondria compared with controls. Our analysis suggests that loss of FMRP prolongs the proliferative stage of progenitors, which may result in more neurons remaining immature during the later stages of neurogenesis. This could have profound implications for homeostatic excitatory-inhibitory circuit development in FXS, and suggests a novel direction for understanding disease mechanisms that may help to guide therapeutic interventions.

Keywords: GABAergic neurons; autism; fragile X syndrome; hESCs; human iPSCs; neurogenesis.


Figures

None
Graphical abstract
Figure 1.
Figure 1.
A directed differentiation protocol yields inhibitory neurons representing a mixed ganglionic eminence fate that form functional GABAergic synapses. (A) In addition to dual SMAD inhibition, additional WNT inhibition was also applied during neural induction. On day 10, neural progenitors were withdrawn from small molecule treatments, and progenitors expanded from day 10 to day 22. Cells were dissociated on day 22 and seeded as single cells for terminal differentiation and maturation in the presence of neurotrophic factors BDNF, GDNF, cAMP, and vitamin C. Representative immunocytochemistry images of differentiating cultures from one control cell line (SAB1-13D) and one FXS cell line (SC105iPS6) are shown in B-H. (B-E) At progenitor stage on day 22, this protocol yielded ventral forebrain progenitor cells. Bar: 100 µm. (F-H) At neuronal maturation stage on day 62 of differentiation, inhibitory neurons derived from ventral forebrain progenitors dominated the cultures, as marked by GABA, SST, and CALB2 antibodies. (I) Expression of key GE lineage markers were assayed by qRT-PCR at differentiation days 17, 24, 32, 42, 52, 62, and 72. Three separate batches of differentiations were included. (J) Phase-contrast image of a patch-clamped neuron. (K) Recorded traces illustrate the experimental paradigm. mIPSCs were recorded in the presence of tetrodotoxin (TTX), that blocks action potentials, and bicuculline, a GABAA receptor blocker, was used at the end of each recording to confirm inhibitory postsynaptic currents. (L) Superimposed mIPSC events obtained by averaging individual events of control and FXS neurons. (M) Representative mIPSC traces of control (n = 21) and FXS neurons (n = 17) on days 52 and 62. Scale bar (B-H) = 100 μm.
Figure 2.
Figure 2.
Functional and immunocytochemical analyses suggest functional delay in FXS inhibitory neuronal culture. (A-C) Spontaneous firing activity was measured from days 47 to 77 in FXS and control cultures. FXS cultures showed reduced active spiking activity across most time points as measured by mean firing rate (A). Burst frequency and the number of total spikes per burst are significantly higher in FXS cultures at the indicated time points (B, C). Three control and 3 FXS cell lines were assessed, including an FMR1 knockout hESC line and isogenic control. Wilcoxon signed-rank tests were performed. Immunocytochemistry was performed with KCC1, KCC2, and MAP2 on days 52, 62, and 72 of neuronal culture with FXS and control cell cultures. Representative images are shown in (D). Two batches of differentiations were included, with 3 control and 3 FXS cell lines (including a pair of isogenic control and FMR1 knockout). Mean intensity, and percentage of positive pixels normalized to MAP2 were measured for KCC1 and KCC2 (E). While KCC1+neurons were not variable between control and FXS cultures, the number of KCC2+ neurons was greater than control at all time points. * P < .05, ** P < .01, *** P < .001. Scale bar (D) = 100 μm.
Figure 3.
Figure 3.
Single-cell RNA sequencing reveals diverse cell types present in FXS and control hPSC-derived inhibitory neuron cell cultures. (A) Unbiased clustering of scRNA-seq data. Cell types were annotated according to both expression of known marker genes (B) and factor loadings relevant to each cell cluster (CD). Progenitor clusters are predominantly separated by cell cycle phase. The neuronal population is composed predominantly of GABAergic neurons and a small percentage of glutamatergic neurons. (B) Expression of genes specific to each cluster. (C, D) Non-Negative Matrix Factorization was used to delineate factors of weighted genes and their associations with each cluster. For each factor shown in C-D, factor loadings are color coded in the UMAP representation on the left, while the top 20 genes with highest coefficients are marked on the right. (C) Top genes in Factor 21, such as ASCL1, HES6, and DLX2, are markers for intermediate progenitors. (D) Top genes in Factor 2, such as EBF1, ZNF503, and BCL11B, are associated with GABAergic projection neurons. (E) UMAP representation of cells from either control or FXS samples at 2 different time points. The gray background represents the rest of cells in the complete dataset. (F) Quantification of cluster composition at each time point. Progenitor populations decreased as the neuronal population increased over time. Intermediate progenitor and glutamatergic neurons were a minor cell population.
Figure 4.
Figure 4.
Differentially expressed genes include both shared and cell type- and time point-specific genes. (A-D) Top 10 differentially expressed genes in each cluster are shown by log2 fold change value. Red indicates upregulation while blue indicates downregulation. Many genes, such as a group coding for ribosomal proteins, showed a shared pattern of upregulation across cell clusters. (E, F) The number of differentially expressed genes increased dramatically from the early time point (day 22) (E) to the later time point (days 42-48) (F). (G) GO biological process terms enriched in DEG genes at the later time point (days 42-48).
Figure 5.
Figure 5.
Sets of differentially expressed genes were enriched with autism-associated genes, especially at later time points. (A) Overall, 27 differentially expressed genes overlap with 144 Category I genes from the SFARI database. An over-representation test was carried out by hypergeometric test and P-value of overlap by chance is 2.56e-05. (B) List of overlapping genes between the DEGs in this study and the SFARI Category I genes. (C) GO analysis of the overlapping genes showed their involvement in the histone lysine methylation process. (D) Overlap between SFARI genes and DEGs by cell type and time points. Dotted line indicates statistical significance (P < .05).
Figure 6.
Figure 6.
Maturation score based on differentiation trajectory showed FXS cells had lower maturation scores in GABAergic neuron clusters on day 48. (A) Diffusion map representation of the scRNA-seq dataset based on the first 2 components. Colors are coded by the maturation score. (B-D) Scatter plots of normalized expression (centered around 0) of key marker genes. The gene expression from each cell was plotted against the maturation score. (B) VIM marks neural progenitors and shows the highest expression in cells with low maturation scores. (C) DLL1 marks intermediate progenitors, and its expression peaked in cells that have mid-level maturation scores. (D) STMN2 marks neurons and has the highest expression in cells with high maturation scores. (E) Correlation of gene expression to maturation score was plotted against upor downregulated genes. On day 22, the correlation of DEG genes were randomly distributed. On days 42-48, especially in the progenitor cluster, upregulated genes in FXS were negatively correlated with the maturation score, while downregulated genes in FXS were positively correlated with maturation score.
Figure 7.
Figure 7.
Factors associated with FXS cells revealed differences in cellular processes and maturation state. (A) Mean factor loadings from control (blue) and FXS (red) samples are shown at different time points for factors 15, 16, 18, and 19. Difference was minor at the early time point (day 22), but increased on the later time point (days 42-48). Factors 15 and 18 showed higher mean loading in FXS samples, while Factors 16 and 19 showed consistently lower mean loadings in FXS samples at the later time point. (B) Top GO biological process terms associated with factors that showed the most loading difference between FXS and control. (C-F) For each factor shown, loadings from either control or FXS cells were ranked and plotted on the left, and the top 20 genes with the highest coefficients from the corresponding factor are marked on the right. (C) Factor 15 showed a group of ribosomal genes, suggesting increased translation processes in FXS cells. (D) Top genes in Factor 16 showed a group of genes responsible for synaptic vesicular transport (CALY, VSNL1, VAMP2), indicating more mature neuronal processes. (E) Factor 18 showed genes associated with early-born GABAergic neurons (DLX2, DLX5), indicating younger neurons in FXS cells. (F) Top genes in Factor 19 belong to a group of genes responsible for energy metabolism including ATP5F1B, NDUFC2, PKM, ACAT2, MDH1, and IDH1.

Similar articles

Cited by

References

    1. Cornish K, Turk J, Hagerman R.. The fragile X continuum: new advances and perspectives. J Intellect Disabil Res. 2008;52(Pt 6):469-482. - PubMed
    1. Lewis P, Abbeduto L, Murphy M, et al. . Cognitive, language and social-cognitive skills of individuals with fragile X syndrome with and without autism. J Intellect Disabil Res. 2006;50(Pt 7):532-545. - PubMed
    1. McDuffie A, Abbeduto L, Lewis P, et al. . Autism spectrum disorder in children and adolescents with fragile X syndrome: within-syndrome differences and age-related changes. Am J Intellect Dev Disabil 2010;115(4):307-326. - PMC - PubMed
    1. Pasciuto E, Bagni C.. SnapShot: FMRP interacting proteins. Cell 2014;159(1):218-2e1. - PubMed
    1. Suhl JA, Chopra P, Anderson BR, Bassell GJ, Warren ST.. Analysis of FMRP mRNA target datasets reveals highly associated mRNAs mediated by G-quadruplex structures formed via clustered WGGA sequences. Hum Mol Genet. 2014;23(20):5479-5491. - PMC - PubMed

Publication types

MeSH terms

Substances