. 2022 May 15;23(5):407-422.
doi: 10.1631/jzus.B2100930.

Proteomic characterization of four subtypes of M2 macrophages derived from human THP-1 cells

Affiliations

Proteomic characterization of four subtypes of M2 macrophages derived from human THP-1 cells

Pengfei Li et al. J Zhejiang Univ Sci B. .

Abstract

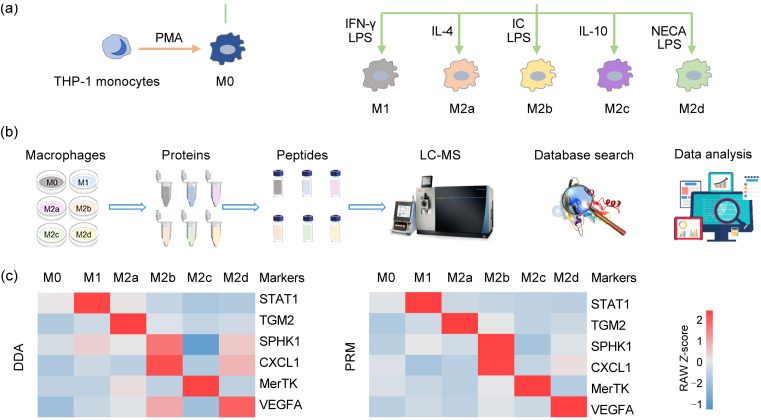
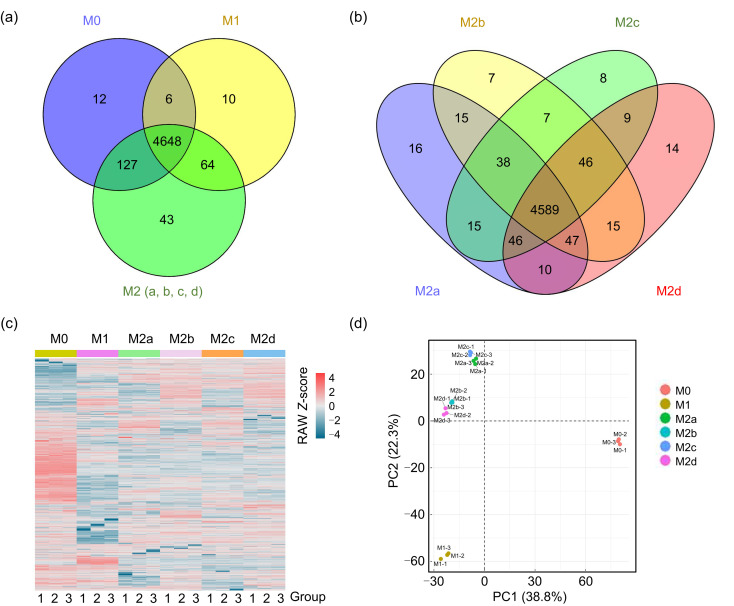
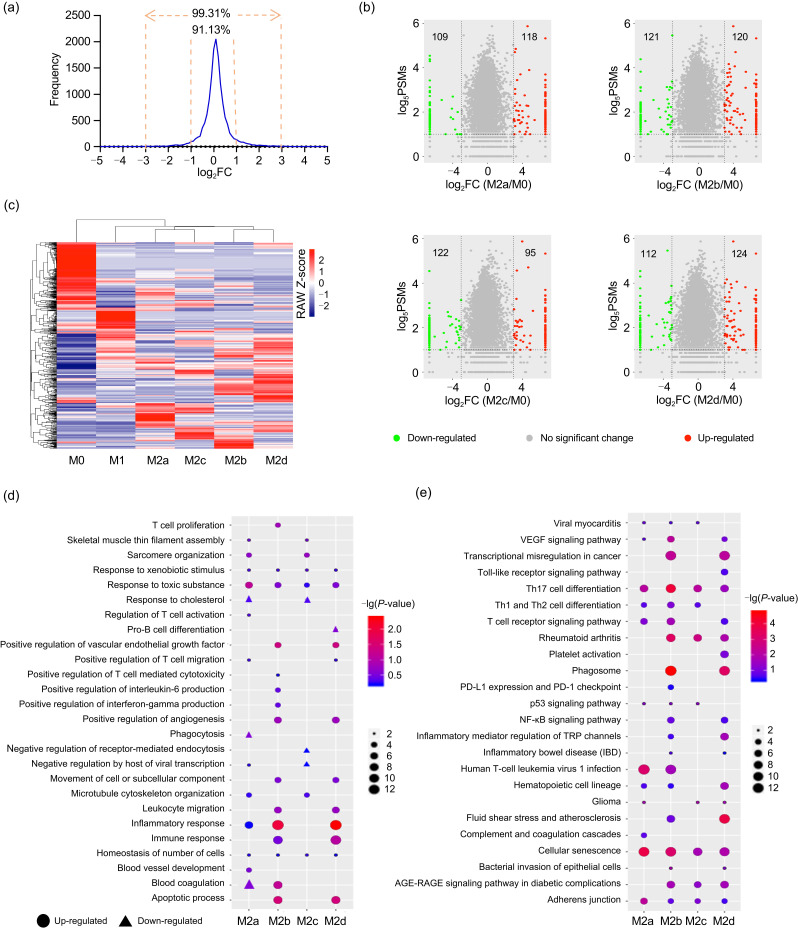
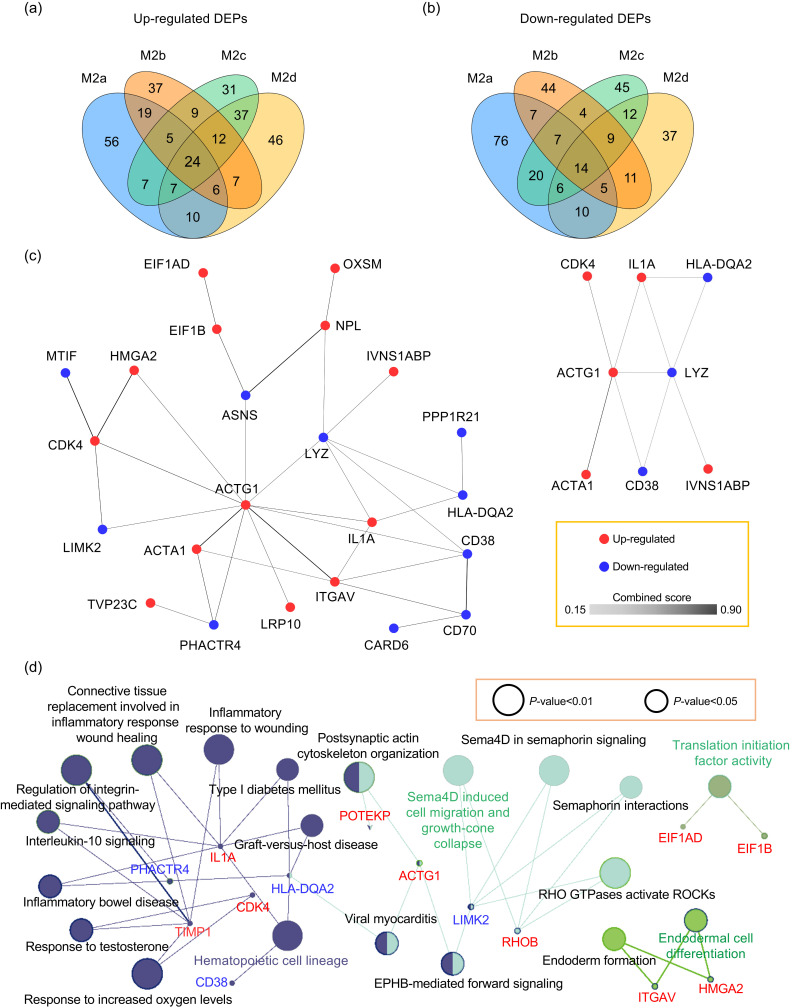
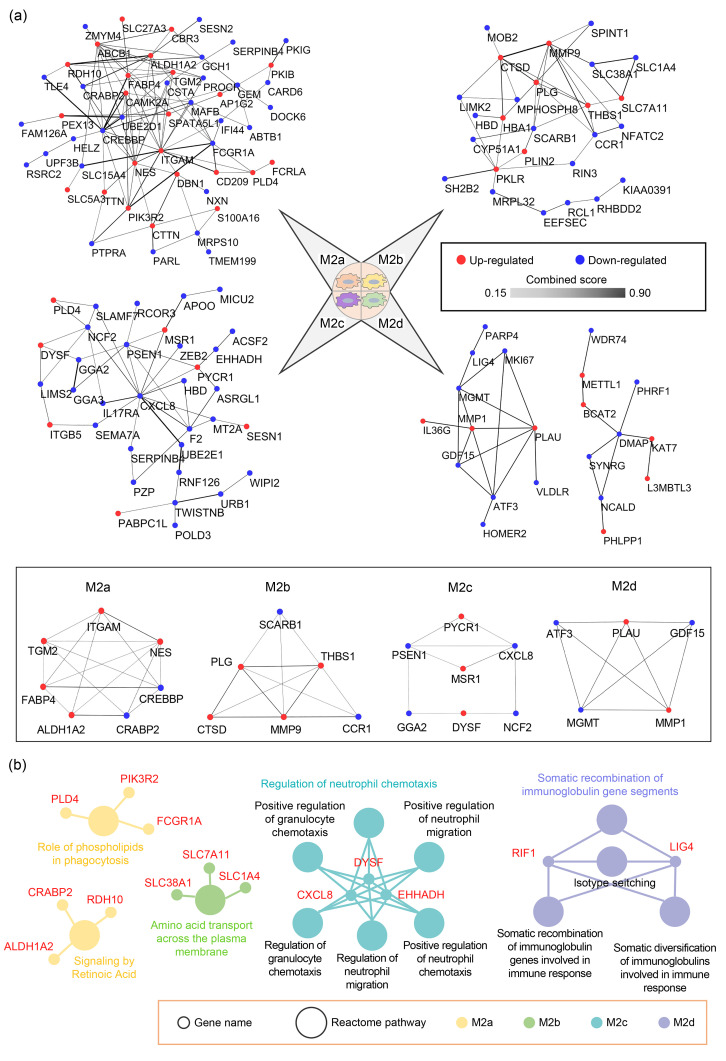
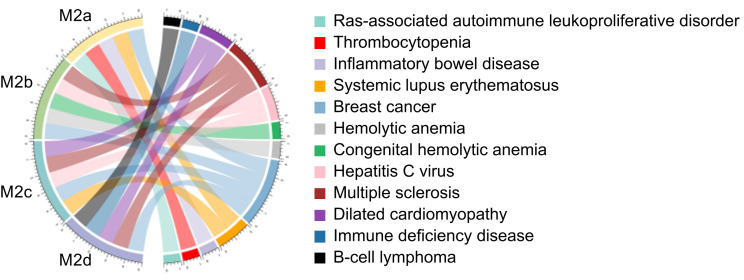
Macrophages are widely distributed immune cells that contribute to tissue homeostasis. Human THP-1 cells have been widely used in various macrophage-associated studies, especially those involving pro-inflammatory M1 and anti-inflammatory M2 phenotypes. However, the molecular characterization of four M2 subtypes (M2a, M2b, M2c, and M2d) derived from THP-1 has not been fully investigated. In this study, we systematically analyzed the protein expression profiles of human THP-1-derived macrophages (M0, M1, M2a, M2b, M2c, and M2d) using quantitative proteomics approaches. The commonly and specially regulated proteins of the four M2 subtypes and their potential biological functions were further investigated. The results showed that M2a and M2b, and M2c and M2d have very similar protein expression profiles. These data could serve as an important resource for studies of macrophages using THP-1 cells, and provide a reference to distinguish different M2 subtypes in macrophage-associated diseases for subsequent clinical research.

Keywords: Biological function; M2 subtype; Macrophage; Proteomics; THP-1 cells.


Figures

Fig. 1
Fig. 1. Preparation and validation of different macrophage phenotypes induced from THP-1 monocytes. (a) Processes of inducing THP-1 monocytes into different macrophage phenotypes using different inducers. (b) Workflow of this study, including the cell culture, protein extraction, peptide enrichment, liquid chromatography-mass spectrometry (LC-MS) data generation, database search, and data analysis. (c) Protein expression levels of several recognized markers in M0, M1, M2a, M2b, M2c, and M2d macrophages were analyzed using two MS-based proteomic methods. PMA: phorbol-12-myristate-13-acetate; IFN: interferon; LPS: lipopolysaccharide; IL: interleukin; IC: immune complex; NECA: 5'-N-ethylcarboxamidoadenosine; DDA: data-dependent acquisition; PRM: parallel reaction monitoring; STAT1: signal transducer and activator of transcription 1; TGM2: transglutaminase 2; SPHK1: sphingosine kinase 1; CXCL1: C-X-C motif chemokine ligand 1; MerTK: Mer receptor tyrosine kinase; VEGFA: vascular endothelial growth factor A.
Fig. 2
Fig. 2. Quantitative proteomic profiling of M0, M1, M2a, M2b, M2c, and M2d macrophages. (a) Venn diagram of quantifiable proteins among M0, M1, and all four M2 macrophage subtypes. (b) Venn diagram of quantifiable proteins among M2a, M2b, M2c, and M2d macrophages. (c) Heatmap of quantified proteins in macrophages. Groups indicate three technical repeats under each condition. (d) Principal component analysis of quantitative proteomics in six macrophage subtypes. PC: principal component.
Fig. 3
Fig. 3. Identification and function analyses of DEPs between M2 subtypes and M0 macrophages. (a) Ratio distributions of quantified proteins among technical replicates of the M0 phenotype. The cutoff was set as two- or eight-fold change. (b) Volcano plot of DEP distributions in the four M2 subtypes. (c) Clustering analysis of respective DEPs in the four subtypes of M2 macrophages. (d) Biological processes analysis of DEPs in the four subtypes of M2 macrophages. (e) KEGG pathway analysis of DEPs in the four subtypes of M2 macrophages. (d, e) The lists of input DEPs were shown in Table S2. DEPs: differentially expressed proteins; PSMs: peptide-spectrum matches; VEGF: vascular endothelial growth factor; Th: T helper; PD-L1: programmed death-ligand 1; NF-κB: nuclear factor-κB; TRP: transient receptor potential; AGE: advanced glycation end-product; RAGE: receptor for AGE.
Fig. 4
Fig. 4. PPI networks and Reactome pathways involving the common DEPs in the four M2 macrophage subtypes. (a) Venn diagram showing commonly up-regulated proteins of the four M2 subtypes. (b) Venn diagram showing commonly down-regulated proteins of the four M2 subtypes. (c) PPI network of common DEPs (left) and module of highly interacting proteins (right). Edges represent protein‒protein associations, and the colors varying from light to dark represent the combined score of DEPs from 0.15 to 0.90. (d) Reactome pathways of common DEPs in the four M2 subtypes. Common DEPs were screened in the four M2 macrophage subtypes with M0 and M1 macrophages as control groups. (c, d) The list of input DEPs is shown in Table S4. Red indicates commonly up-regulated proteins and blue indicates commonly down-regulated proteins. PPI and Reactome pathways enrichment P-value<0.05. PPI: protein‒protein interactions; DEPs: differentially expressed proteins(Note: for interpretation of the references to color in this figure legend, the reader is referred to the web version of this article).
Fig. 5
Fig. 5. PPI networks and Reactome pathways involving the special DEPs in the four M2 macrophage subtypes. (a) PPI networks (top) and highly interactive proteins (down) of special DEPs in M2a, M2b, M2c, and M2d macrophages. Edges represent protein‒protein associations, and the colors varying from light to dark represent the combined score of DEPs from 0.15 to 0.90. (b) Reactome pathways of special DEPs in the four M2 subtypes. The list of input DEPs is shown in Table S6. PPI and Reactome pathways enrichment P-value<0.05. PPI: protein‒protein interactions; DEPs: differentially expressed proteins(Note: for interpretation of the references to color in this figure legend, the reader is referred to the web version of this article).
Fig. 6
Fig. 6. Predicting immune-associated diseases of special DEPs in the four M2 subtypes. Enrichment P-value<0.05. DEPs: differentially expressed proteins.

Similar articles

Cited by

References

    1. Avila-Ponce de León U, Vazquez-Jimenez A, Matadamas-Guzman M, et al. , 2021. Transcriptional and microenvironmental landscape of macrophage transition in cancer: a boolean analysis. Front Immunol, 12: 642842. 10.3389/fimmu.2021.642842 - DOI - PMC - PubMed
    1. Bader GD, Hogue CWV, 2003. An automated method for finding molecular complexes in large protein interaction networks. BMC Bioinformatics, 4: 2. 10.1186/1471-2105-4-2 - DOI - PMC - PubMed
    1. Batchu S, 2020. Progressive multiple sclerosis transcriptome deconvolution indicates increased M2 macrophages in inactive lesions. Eur Neurol, 83(4): 433-435. 10.1159/000510075 - DOI - PMC - PubMed
    1. Baumeier C, Escher F, Aleshcheva G, et al. , 2021. Plasminogen activator inhibitor-1 reduces cardiac fibrosis and promotes M2 macrophage polarization in inflammatory cardiomyopathy. Basic Res Cardiol, 116: 1. 10.1007/s00395-020-00840-w - DOI - PMC - PubMed
    1. Ben-Ari Fuchs S, Lieder I, Stelzer G, et al. , 2016. GeneAnalytics: an integrative gene set analysis tool for next generation sequencing, RNAseq and microarray data. OMICS, 20(3): 139-151. 10.1089/omi.2015.0168 - DOI - PMC - PubMed