. 2022 Apr;13(2):812-821.
doi: 10.21037/jgo-22-303.

Identification of potential prognostic biomarkers for hepatocellular carcinoma

Affiliations

Identification of potential prognostic biomarkers for hepatocellular carcinoma

Lanyi Zhang et al. J Gastrointest Oncol. 2022 Apr.

Abstract

Background: The incidence of liver cancer is increasing every year. Hepatocellular carcinoma (HCC) accounts for nearly 90% of liver cancer, and the overall 5-year survival rate of become of Hepatocellular carcinoma patients less than 20%. However, the molecular mechanism of HCC progression and prognosis still requires further exploration.

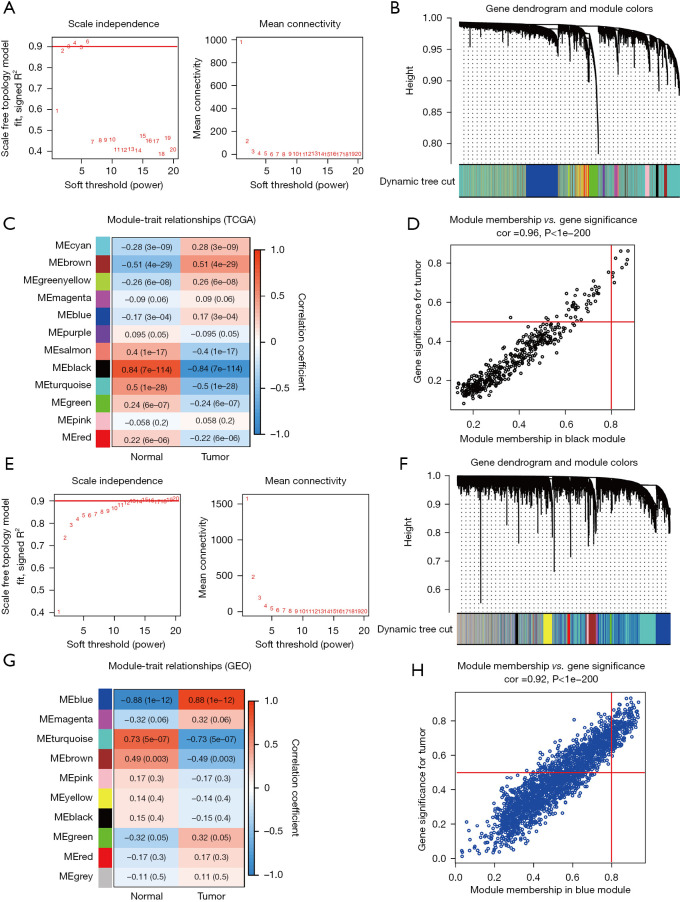
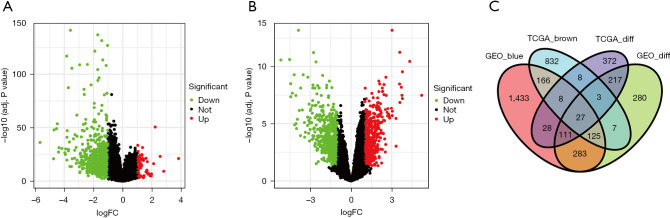
Methods: In this study, we downloaded the gene expression data from the Cancer Genome Atlas (TCGA) Genomic Data and the official website of GEO database. Weighted gene co-expression network analysis (WGCNA) and Pearson's correlation coefficient were utilized to detect the gene modules. The shared differentially-expressed genes (DEGs) were screened out by a Venn diagram, and the hub genes were identified through protein-protein interaction (PPI) network analyses. GO and KEGG enrichment analyses were constructed for these hub genes. Overall survival (OS) and correlation analysis were conducted to investigate the relationship between the hub genes and clinical features.

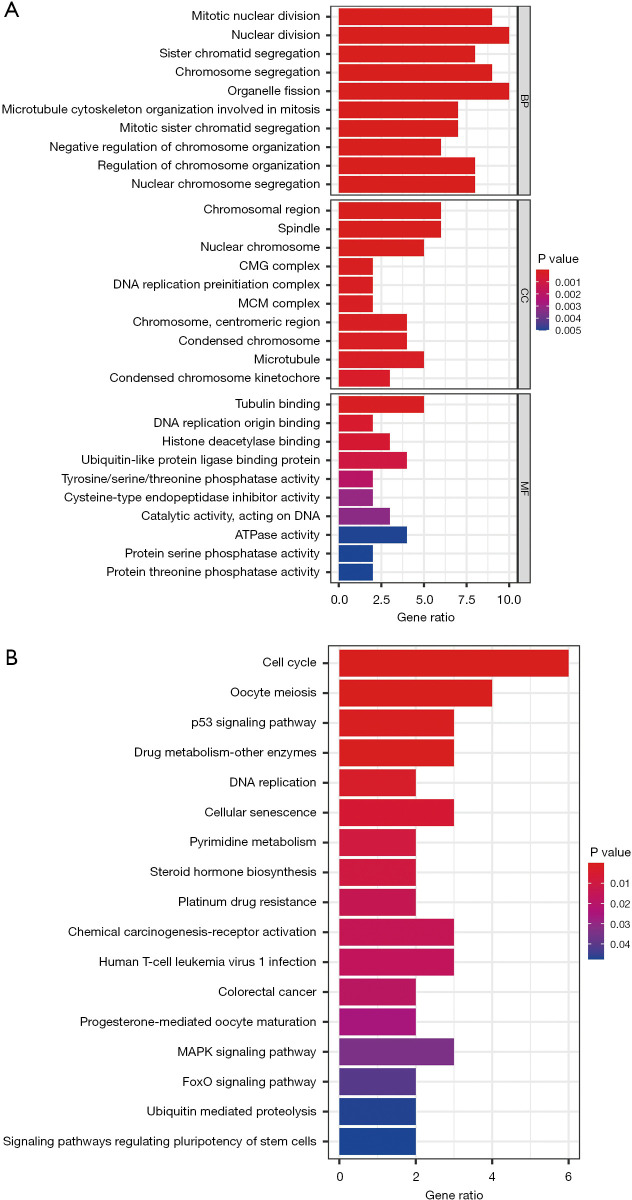
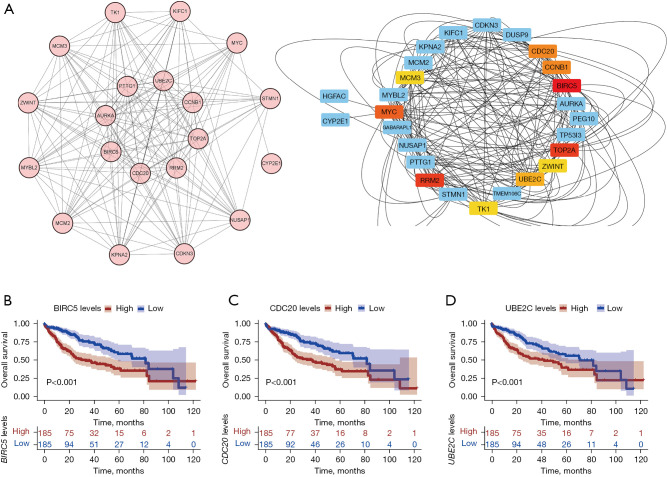
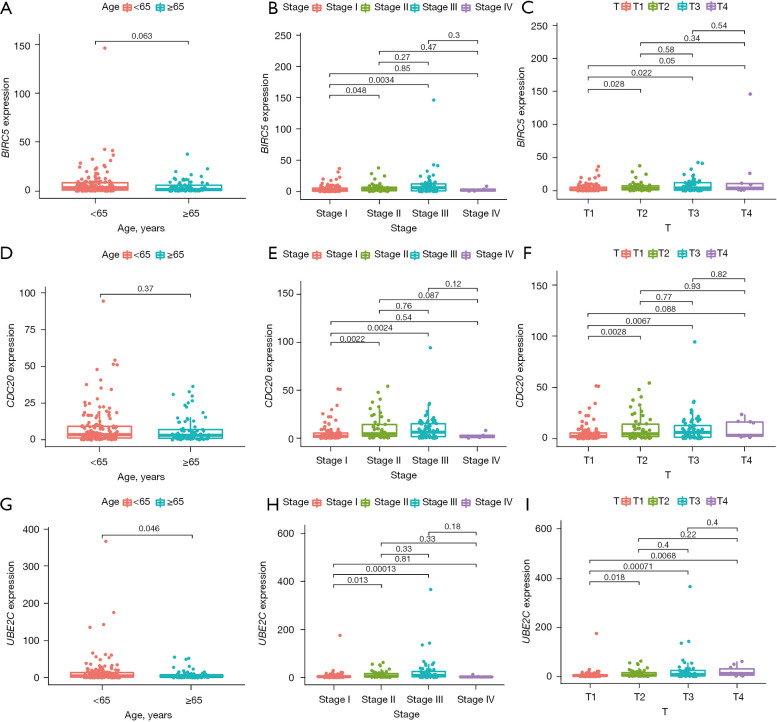
Results: We screened out 27 shared DEGs, and the mainly enriched GO terms were mitotic nuclear division, chromosomal region, and tubulin binding. Furthermore, the top three enriched KEGG pathways were "cell cycle", "oocyte meiosis", and "p53 signaling pathway". According to the Maximal Clique Centrality (MCC) algorithm, the top 10 candidate hub genes were MYC, MCM3, CDC20, CCNB1, BIRC5, UBE2C, TOP2A, RRM2, TK1, and PTTG1, among which BIRC5, CDC20, and UBE2C showed a strong correlation with the OS.

Conclusions: Three hub genes (BIRC5, CDC20, and UBE2C) were identified and found to be correlated to the progression and prognosis of HCC. These may become potential targets for HCC therapy.

Keywords: Hepatocellular carcinoma (HCC); overall survival (OS) analysis; prognosis; progression; weighted gene co-expression network analysis (WGCNA).


Conflict of interest statement

Conflicts of Interest: All authors have completed the ICMJE uniform disclosure form (available at https://jgo.amegroups.com/article/view/10.21037/jgo-22-303/coif). The authors have no conflicts of interest to declare.

Figures

Figure 1
Figure 1
WCGNA and identification of gene modules. (A) Scale independence in TCGA database when β was set at 3; (B) gene dendrograms and module colors; (C) Correlation analysis between ME and gene modules; (D) Scatter diagrams between gene significance vs. module membership; (E) scale independence in GSE60502 dataset when β was set at 13; (F) gene dendrograms and module colors in GSE60502 dataset; (G) Correlation analysis between ME and gene modules in the GSE60502 dataset; (H) a scatter plot of gene significance vs. module membership in the GSE60502 dataset. WCGNA, Weighted Gene Co-expression Network Analysis; TCGA, The Cancer Genome Atlas; ME, module eigengenes.
Figure 2
Figure 2
Differentially expressed genes analyses. (A) The differentially expressed genes of HCC patients’ in TCGA database; (B) The differentially expressed genes of HCC patients’ in the GSE60502 dataset; (C) Venn diagram showing the 27 shared genes of TCGA database and the GSE60502 dataset. DEGs, differentially-expressed genes; TCGA_diff, DEGs in TCGA database; TCGA_brown, brown module in TCGA database; GEO_diff, DEGs in GSE60502 dataset; GEO_blue, blue module in GSE60502 dataset. DEGs, differentially-expressed genes; HCC, hepatocellular carcinoma; TCGA, The Cancer Genome Atlas.
Figure 3
Figure 3
Gene function enrichment analysis of the 27 shared genes. (A) GO analysis; (B) Bubble diagram of the KEGG pathway enrichment analysis. BP, biological process; CC, cellular component; MF, molecular function; GO, Gene Ontology; KEGG, Kyoto Encyclopedia of Genes and Genomes.
Figure 4
Figure 4
Identification of hub genes. (A) PPI network analysis (left). Top 10 candidate hub genes based on the MCC algorithm (right); (B) overall survival analysis associated with BIRC5 expression. P<0.001; (C) overall survival analysis associated with CDC20 expression. P<0.001; (D) overall survival analysis associated with UBE2C expression. P<0.001. PPI, protein-protein interaction; MCC, Maximal Clique Centrality.
Figure 5
Figure 5
Analysis of the prognostic value of hub genes. (A-C) BIRC5 expression correlated to (A) age, (B) stages, and (C) T category of HCC patients; (D-F) CDC20 expression correlated to (D) age, (E) stages, and (F) T category of HCC patients; (G-I) UBE2C expression correlated to (G) age, (H) stages, and (I) T category of HCC patients. HCC, hepatocellular carcinoma.

References

    1. Llovet JM, Kelley RK, Villanueva A, et al. Hepatocellular carcinoma. Nat Rev Dis Primers 2021;7:6. 10.1038/s41572-020-00240-3 - DOI - PubMed
    1. Anwanwan D, Singh SK, Singh S, et al. Challenges in liver cancer and possible treatment approaches. Biochim Biophys Acta Rev Cancer 2020;1873:188314. 10.1016/j.bbcan.2019.188314 - DOI - PMC - PubMed
    1. Tomczak K, Czerwińska P, Wiznerowicz M. The Cancer Genome Atlas (TCGA): an immeasurable source of knowledge. Contemp Oncol (Pozn) 2015;19:A68-77. 10.5114/wo.2014.47136 - DOI - PMC - PubMed
    1. Edgar R, Domrachev M, Lash AE. Gene Expression Omnibus: NCBI gene expression and hybridization array data repository. Nucleic Acids Res 2002;30:207-10. 10.1093/nar/30.1.207 - DOI - PMC - PubMed
    1. Langfelder P, Horvath S. WGCNA: an R package for weighted correlation network analysis. BMC Bioinformatics 2008;9:559. 10.1186/1471-2105-9-559 - DOI - PMC - PubMed