

Development and verification of a hypoxia- and immune-associated prognosis signature for esophageal squamous cell carcinoma
- PMID: 35557566
- PMCID: PMC9086047
- DOI: 10.21037/jgo-22-69
Development and verification of a hypoxia- and immune-associated prognosis signature for esophageal squamous cell carcinoma
Abstract
Background: Esophageal cancer is one of the most common gastrointestinal malignancies worldwide, with high morbidity and mortality in China. The clinical importance of the interaction between hypoxia and immune status in the tumor microenvironment has been established in esophageal squamous cell carcinoma (ESCC). This study aims to develop a new hypoxia- and immune-based gene signature to predict the survival of ESCC patients.
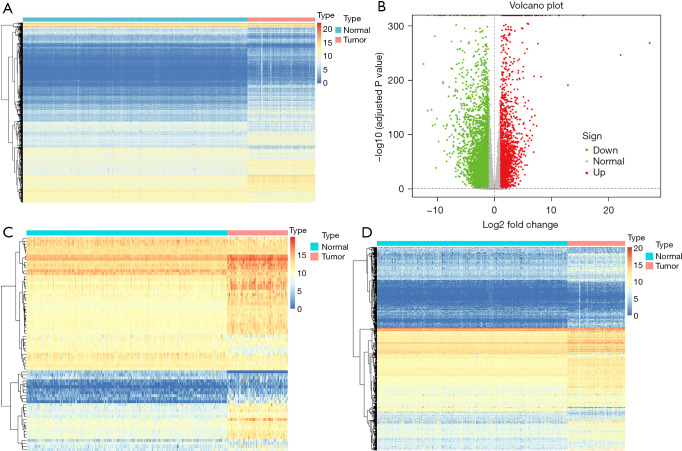
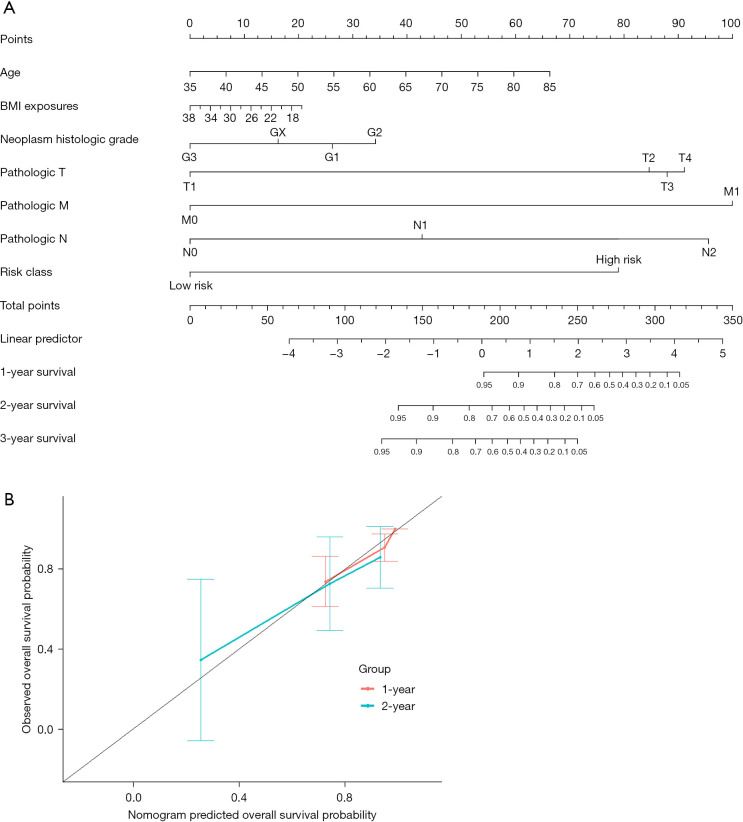
Methods: The RNA-sequencing and clinical data of 173 cases of ESCC and 271 normal tissues were obtained from The Cancer Genome Atlas (TCGA) data portal and the Genotype-Tissue Expression (GTEx) database. Hypoxia-related genes (HRGs) and immune-related genes (IRGs) were retrieved from publicly shared data. Differentially expressed gene (DEG) analyses were carried out by the DESeq2 method using the edgeR package in R. Based on the intersection of the DEGs and HRGs/IRGs, differentially expressed HRGs (DEHRGs) and differentially expressed IRGs (DEIRGs) were obtained. DEHRGs and DEIRGs associated with prognosis were evaluated using univariate Cox proportional hazards analysis. A prognostic risk score model was constructed according to the genes acquired through Cox regression. Univariate analysis and Cox proportional hazards analysis were used to determine the independent prognostic factors related to prognosis. A nomogram was developed to predict the 1-, 2-, and 3-year overall survival (OS) probability.
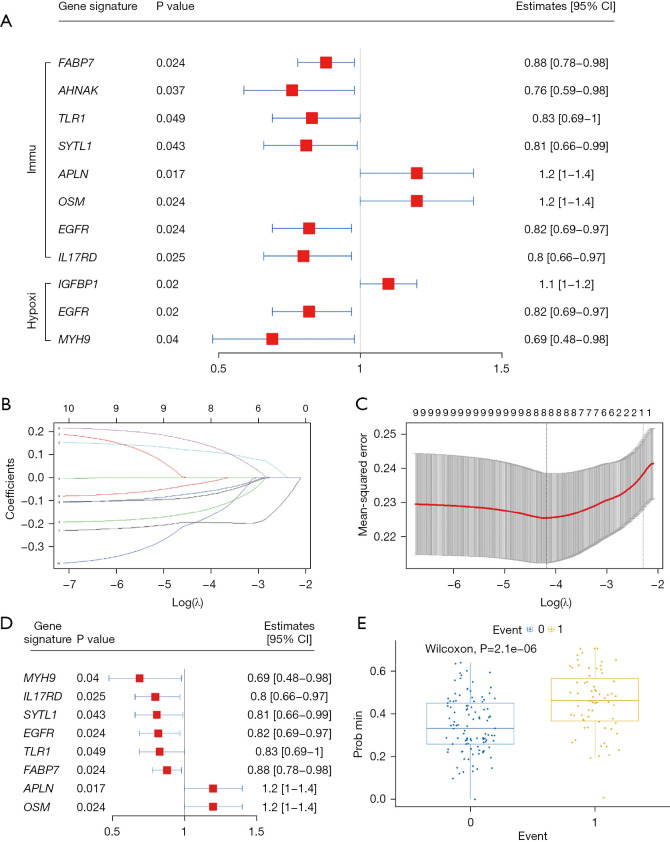
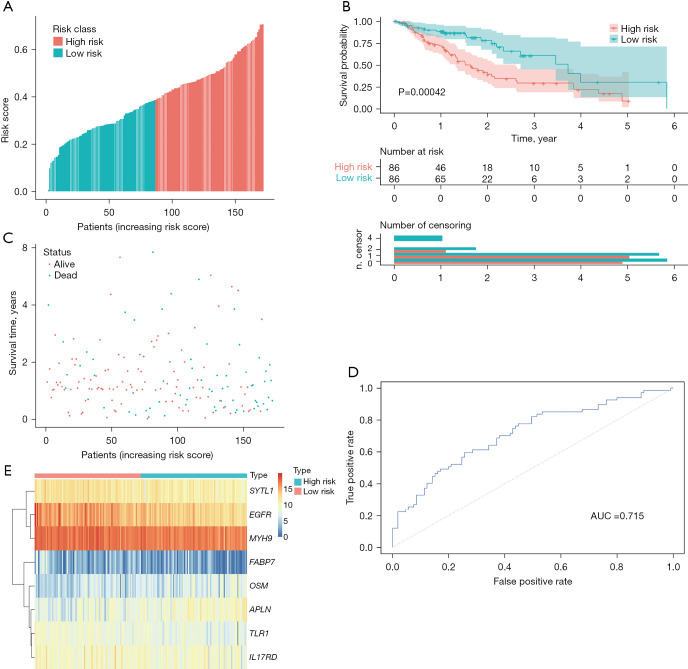
Results: A total of 73 intersecting genes were obtained as DEHRGs and a total of 548 intersecting genes were obtained as DEIRGs. The risk score was established using 8 genes (FABP7, TLR1, SYTL1, APLN, OSM, EGFR, IL17RD, MYH9) acquired from univariate Cox analysis. Based on this 8-gene-based risk score, a risk prognosis classifier was constructed to classify the samples into high- and low-risk groups according to the median risk score. The nomogram model was constructed to predict the OS of ESCC patients.
Conclusions: The hypoxia- and immune-based gene signature might serve as a prognostic classifier for clinical decision-making regarding individualized management, follow-up plans, and treatment strategies for ESCC patients.
Keywords: Esophageal cancer; hypoxia; immune; microenvironment; prognosis.
2022 Journal of Gastrointestinal Oncology. All rights reserved.
Conflict of interest statement
Conflicts of Interest: All authors have completed the ICMJE uniform disclosure form (available at https://jgo.amegroups.com/article/view/10.21037/jgo-22-69/coif). The authors have no conflicts of interest to declare.
Figures
Similar articles
-
A novel immune-related gene signature predicts survival in esophageal squamous cell carcinoma.Transl Cancer Res. 2021 May;10(5):2354-2367. doi: 10.21037/tcr-20-2665. Transl Cancer Res. 2021. PMID: 35116551 Free PMC article.
-
Development and Validation of a Prognostic Gene Signature Correlated With M2 Macrophage Infiltration in Esophageal Squamous Cell Carcinoma.Front Oncol. 2021 Dec 3;11:769727. doi: 10.3389/fonc.2021.769727. eCollection 2021. Front Oncol. 2021. PMID: 34926275 Free PMC article.
-
A robust signature associated with patient prognosis and tumor immune microenvironment based on immune-related genes in lung squamous cell carcinoma.Int Immunopharmacol. 2020 Nov;88:106856. doi: 10.1016/j.intimp.2020.106856. Epub 2020 Aug 7. Int Immunopharmacol. 2020. PMID: 32777677
-
Establishment of a risk model by integrating hypoxia genes in predicting prognosis of esophageal squamous cell carcinoma.Cancer Med. 2023 Jan;12(2):2117-2133. doi: 10.1002/cam4.5002. Epub 2022 Jul 4. Cancer Med. 2023. PMID: 35789548 Free PMC article.
-
Development of immune gene pair-based signature predictive of prognosis and immunotherapy in esophageal cancer.Ann Transl Med. 2021 Oct;9(20):1591. doi: 10.21037/atm-21-5217. Ann Transl Med. 2021. PMID: 34790797 Free PMC article.
Cited by
-
A new risk score model based on lactate dehydrogenase for predicting prognosis in esophageal squamous cell carcinoma treated with chemoradiotherapy.J Thorac Dis. 2023 Apr 28;15(4):2116-2128. doi: 10.21037/jtd-23-388. Epub 2023 Apr 26. J Thorac Dis. 2023. PMID: 37197526 Free PMC article.
-
A novel fatty acid metabolism-related signature identifies MUC4 as a novel therapy target for esophageal squamous cell carcinoma.Sci Rep. 2024 May 30;14(1):12476. doi: 10.1038/s41598-024-62917-z. Sci Rep. 2024. PMID: 38816411 Free PMC article.
-
Clinical efficacy of combination therapy of an immune checkpoint inhibitor with taxane plus platinum versus an immune checkpoint inhibitor with fluorouracil plus platinum in the first-line treatment of patients with locally advanced, metastatic, or recurrent esophageal squamous cell carcinoma.Front Oncol. 2022 Dec 20;12:1015302. doi: 10.3389/fonc.2022.1015302. eCollection 2022. Front Oncol. 2022. PMID: 36605427 Free PMC article.
-
Hypoxia promotes histone H3K9 lactylation to enhance LAMC2 transcription in esophageal squamous cell carcinoma.iScience. 2024 Jun 5;27(7):110188. doi: 10.1016/j.isci.2024.110188. eCollection 2024 Jul 19. iScience. 2024. PMID: 38989468 Free PMC article.
-
Deciphering the Hypoxia-immune interface in esophageal squamous carcinoma: a prognostic network model.Front Oncol. 2023 Dec 12;13:1296814. doi: 10.3389/fonc.2023.1296814. eCollection 2023. Front Oncol. 2023. PMID: 38148838 Free PMC article.
References
LinkOut - more resources
Full Text Sources
Research Materials
Miscellaneous