. 2022 Apr 26:16:824454.
doi: 10.3389/fnins.2022.824454. eCollection 2022.

TNF-α Orchestrates Experience-Dependent Plasticity of Excitatory and Inhibitory Synapses in the Anterior Piriform Cortex

Affiliations

TNF-α Orchestrates Experience-Dependent Plasticity of Excitatory and Inhibitory Synapses in the Anterior Piriform Cortex

Anni Guo et al. Front Neurosci. .

Abstract

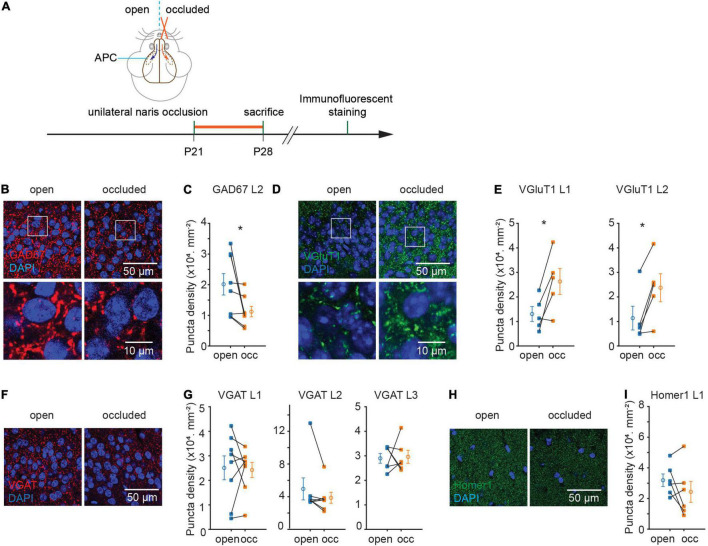
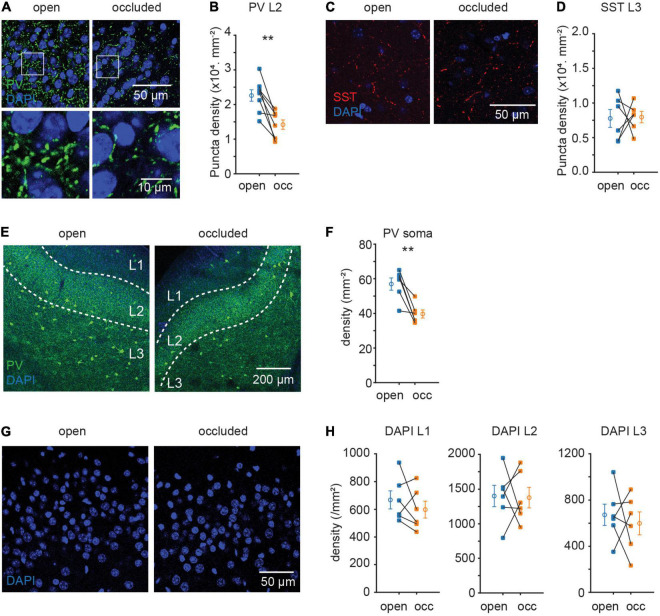
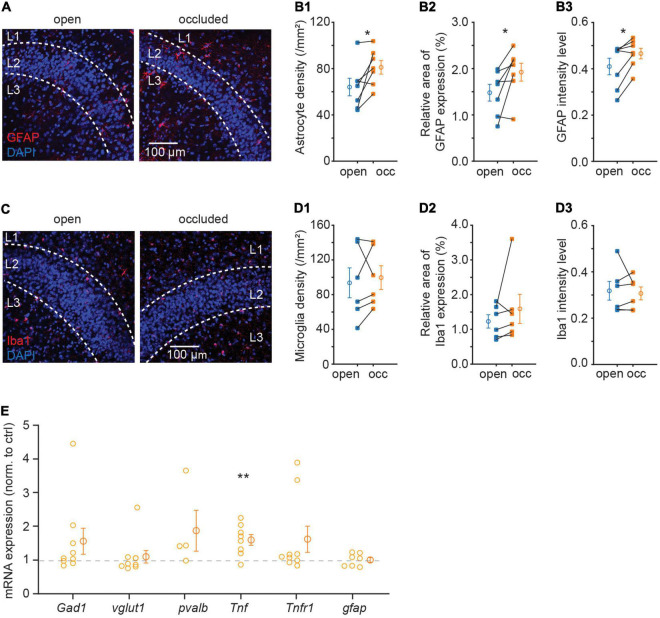
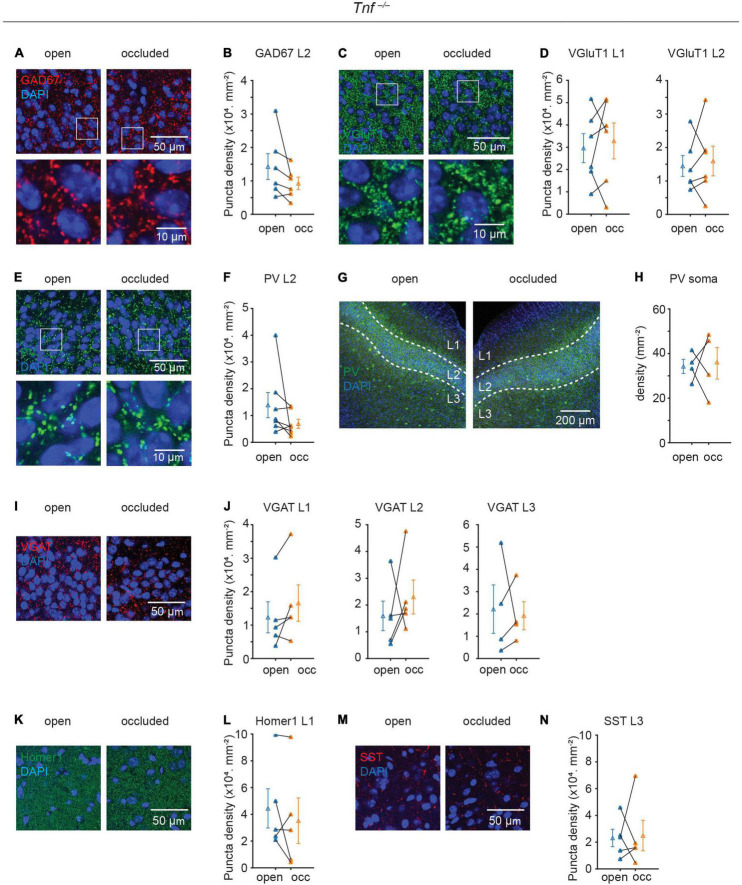
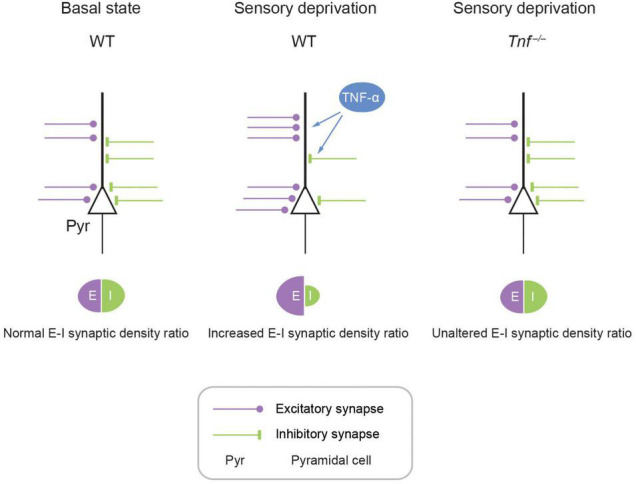
Homeostatic synaptic plasticity, which induces compensatory modulation of synapses, plays a critical role in maintaining neuronal circuit function in response to changing activity patterns. Activity in the anterior piriform cortex (APC) is largely driven by ipsilateral neural activity from the olfactory bulb and is a suitable system for examining the effects of sensory experience on cortical circuits. Pro-inflammatory cytokine tumor necrosis factor-α (TNF-α) can modulate excitatory and inhibitory synapses, but its role in APC is unexplored. Here we examined the role of TNF-α in adjusting synapses in the mouse APC after experience deprivation via unilateral naris occlusion. Immunofluorescent staining revealed that activity deprivation increased excitatory, and decreased inhibitory, synaptic density in wild-type mice, consistent with homeostatic regulation. Quantitative RT-PCR showed that naris occlusion increased the expression of Tnf mRNA in APC. Critically, occlusion-induced plasticity of excitatory and inhibitory synapses was completely blocked in the Tnf knockout mouse. Together, these results show that TNF-α is an important orchestrator of experience-dependent plasticity in the APC.

Keywords: GABAergic interneurons; cytokines; excitation and inhibition balance; glial cells; homeostatic plasticity.


Conflict of interest statement

The authors declare that the research was conducted in the absence of any commercial or financial relationships that could be construed as a potential conflict of interest.

Figures

FIGURE 1
FIGURE 1
Sensory deprivation induced structural plasticity of excitatory and inhibitory synapses in anterior piriform cortex (APC). (A) Timeline of experiment. Unilateral naris occlusion was performed in P21 wild type mice. 7 days after naris occlusion, mice were sacrificed for further immunostaining. (B) Representative images of GAD67 puncta in layer 2 of APC. (C) Quantification of GAD67 puncta density in layer 2 of APC (p = 0.04, N = 8). (D) Representative images of VGluT1 puncta in layer 2 side of APC. (E) Quantification of VGluT1 puncta density in layer 1 and layer 2 of APC. (L1: p = 0.03, N = 5; L2: p = 0.02, N = 5). (F) Representative images of VGAT puncta in layer2 of APC. (G) Quantification of VGAT puncta density in APC (L1: p = 0.84, N = 8; L2: p = 0.22, N = 7; L3: p = 0.87, N = 6). (H) Representative images of Homer1 puncta in layer 1 of APC. (I) Quantification of Homer1 puncta density in layer 1 of APC (p = 0.23, N = 6). N-number represents the total number of animals used in experiments. n = 3 repeats of experiments were performed. Mann-Whitney test was used for VGAT puncta density in L2. Paired t-test was used for the rest of the datasets. (occ: occluded).
FIGURE 2
FIGURE 2
Sensory deprivation induced selective plasticity in PV neurons. (A) Representative images of PV puncta in layer 2 of APC. (B) Quantification of PV puncta density in layer 2 of APC. (p = 0.002, N = 8) (C) representative images of SST puncta in layer 3 of APC. (D) Quantification of SST puncta density in layer 3 of APC. (p = 0.93, N = 6) (E) representative images of PV neuron in APC. (F) Quantification of PV neuron density in APC. (p = 0.008, N = 6) (G) representative images of DAPI in layer 2 of APC. (H) Quantification of cell density in APC. (L1: p = 0.356, N = 6; L2: p = 0.921, N = 6; L3: p = 0.638, N = 6). n = 3 repeats of experiments were performed. Paired t-test was used for all datasets.
FIGURE 3
FIGURE 3
Sensory deprivation increased astrocyte density and expression of TNF-α in APC. (A) Representative images of GFAP in APC. (B) Quantification of astrocyte density (B1), GFAP relative area of GFAP expression percentage (B2) and mean intensity (B3) in APC. (B1: p = 0.037, B2: p = 0.038, B3: p = 0.031, N = 7) (C) representative images of Iba1 in APC. (D) Quantification of microglia density (D1), Iba1 relative area of Iba1 expression percentage (D2) and mean intensity (D3) in APC. (D1: p = 0.599, D2: p = 0.313, D3: p = 0.676, N = 6) (E) relative mRNA expression of Gad1, vglut1, pvalb, Tnf, Tnfr1, and gfap in the occluded side; foldchange is normalized to open side (p = 0.185, N = 9; p = 0.601, N = 9; p = 0.246, N = 4; p = 0.008, N = 8; p = 0.149, N = 9; p = 0.953, N = 7). n = 3 repeats of experiments were performed in (A–D); n = 2–4 repeats of experiments were performed in (E). Mann-Whitney test was used for GFAP mean intensity and Iba1 relative area of Iba1 expression percentage. Paired t-test was used for the rest of the datasets.
FIGURE 4
FIGURE 4
Plasticity of excitatory and inhibitory synapses induced by sensory deprivation is abolished in Tnf–/– mice. (A) Representative images of GAD67 puncta in layer 2 of APC. (B) Quantification of GAD67 puncta density in layer 2 of APC. (p = 0.148, N = 6) (C) representative images of VGluT1 puncta in layer 2 of APC. (D) Quantification of VGluT1 puncta density in layer 1 and layer 2 of APC. (L1: p = 0.661, N = 6; L2: p = 0.703, N = 6) (E) Representative images of PV puncta in layer 2 side of APC. (F) Quantification of PV puncta density in layer 2 of APC. (p = 0.156, N = 7) (G) representative images of PV neuron in APC. (H) Quantification of PV neuron density in APC. (p = 0.885, N = 4) (I) representative images of VGAT puncta in layer 2 of APC. (J) Quantification of VGAT puncta density in layer 2 of APC (L1: p = 0.15, N = 5; L2: p = 0.5, N = 5; L3: p = 0.81, N = 5). (K) Representative images of Homer1 puncta in layer 1 of APC. (L) Quantification of Homer1 puncta density in layer 1 of APC (p = 0.41, N = 5). (M) Representative images of SST puncta in layer 3 of APC. (N) Quantification of SST puncta density in layer 3 of APC (p = 0.89, N = 5). n = 2– 3 repeats of experiments were performed. Mann-Whitney test was used for PV puncta density in L2. Paired t-test was used for the rest of the datasets.
FIGURE 5
FIGURE 5
Schematic model showing TNF-α mediates experience-dependent modulation of synaptic plasticity of structural excitatory-inhibitory ratio in APC. In the APC, E-I synaptic density ratio is determined by local neural activity, which in turn is primarily determined by the upstream activity in the OB. Fluctuating activity levels induce plasticity in the APC. For example, hypo-activity in the form of sensory deprivation can increase excitation while decreasing inhibition, achieving an enhancement of E-I synaptic density ratio. This augmentation of E-I synaptic density ratio is mediated by astrocytic TNF-α, as evidenced by the complete abolishment of this plasticity in the Tnf–/– mouse.

Similar articles

Cited by

References

    1. Altimimi H. F., Stellwagen D. (2013). Persistent synaptic scaling independent of AMPA receptor subunit composition. J. Neurosci. 33 11763–11767. 10.1523/JNEUROSCI.1102-13.2013 - DOI - PMC - PubMed
    1. Alyu F., Dikmen M. (2017). Inflammatory aspects of epileptogenesis: contribution of molecular inflammatory mechanisms. Acta Neuropsychiatr. 29 1–16. 10.1017/neu.2016.47 - DOI - PubMed
    1. Beattie E. C., Stellwagen D., Morishita W., Bresnahan J. C., Byeong K. H., von Zastrow M., et al. (2002). Control of synaptic strength by glial TNFα. Science 295 2282–2285. 10.1126/science.1067859 - DOI - PubMed
    1. Becker D., Deller T., Vlachos A. (2015). Tumor necrosis factor (TNF)-receptor 1 and 2 mediate homeostatic synaptic plasticity of denervated mouse dentate granule cells. Sci. Rep. 5 1–10. 10.1038/srep12726 - DOI - PMC - PubMed
    1. Becker D., Zahn N., Deller T., Vlachos A. (2013). Tumor necrosis factor alpha maintains denervation-induced homeostatic synaptic plasticity of mouse dentate granule cells. Front. Cell. Neurosci. 7:257. 10.3389/fncel.2013.00257 - DOI - PMC - PubMed

LinkOut - more resources