. 2022 Apr 26:13:837385.
doi: 10.3389/fneur.2022.837385. eCollection 2022.

Sensitivity of Diffusion MRI to White Matter Pathology: Influence of Diffusion Protocol, Magnetic Field Strength, and Processing Pipeline in Systemic Lupus Erythematosus

Affiliations

Sensitivity of Diffusion MRI to White Matter Pathology: Influence of Diffusion Protocol, Magnetic Field Strength, and Processing Pipeline in Systemic Lupus Erythematosus

Evgenios N Kornaropoulos et al. Front Neurol. .

Abstract

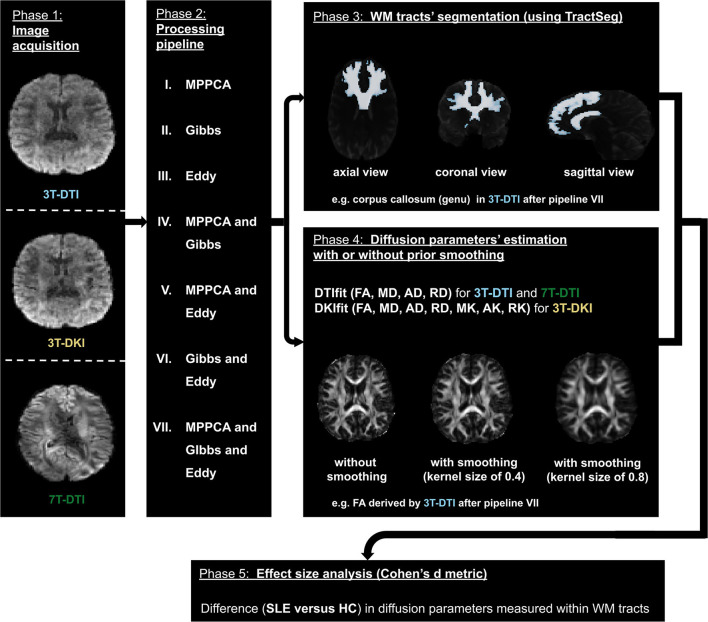
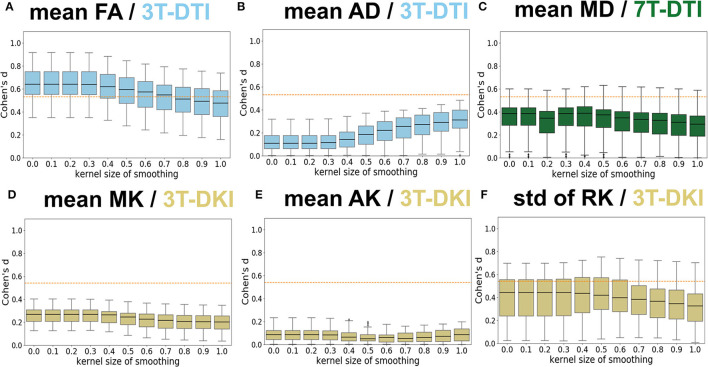
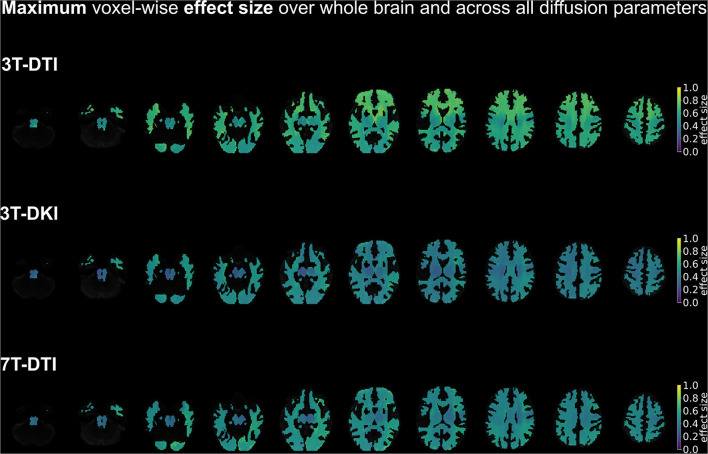
There are many ways to acquire and process diffusion MRI (dMRI) data for group studies, but it is unknown which maximizes the sensitivity to white matter (WM) pathology. Inspired by this question, we analyzed data acquired for diffusion tensor imaging (DTI) and diffusion kurtosis imaging (DKI) at 3T (3T-DTI and 3T-DKI) and DTI at 7T in patients with systemic lupus erythematosus (SLE) and healthy controls (HC). Parameter estimates in 72 WM tracts were obtained using TractSeg. The impact on the sensitivity to WM pathology was evaluated for the diffusion protocol, the magnetic field strength, and the processing pipeline. Sensitivity was quantified in terms of Cohen's d for group comparison. Results showed that the choice of diffusion protocol had the largest impact on the effect size. The effect size in fractional anisotropy (FA) across all WM tracts was 0.26 higher when derived by DTI than by DKI and 0.20 higher in 3T compared with 7T. The difference due to the diffusion protocol was larger than the difference due to magnetic field strength for the majority of diffusion parameters. In contrast, the difference between including or excluding different processing steps was near negligible, except for the correction of distortions from eddy currents and motion which had a clearly positive impact. For example, effect sizes increased on average by 0.07 by including motion and eddy correction for FA derived from 3T-DTI. Effect sizes were slightly reduced by the incorporation of denoising and Gibbs-ringing removal (on average by 0.011 and 0.005, respectively). Smoothing prior to diffusion model fitting generally reduced effect sizes. In summary, 3T-DTI in combination with eddy current and motion correction yielded the highest sensitivity to WM pathology in patients with SLE. However, our results also indicated that the 3T-DKI and 7T-DTI protocols used here may be adjusted to increase effect sizes.

Keywords: DKI; DTI; ROI-based analysis; diffusion MRI; diffusion processing; effect sizes; ultra-high magnetic field strength (7T); white matter fiber-tracts.


Conflict of interest statement

The authors declare that the research was conducted in the absence of any commercial or financial relationships that could be construed as a potential conflict of interest.

Figures

Figure 1
Figure 1
The workflow. The diffusion MRI (dMRI) data were acquired using three different acquisition protocols: 3T-diffusion tensor imaging (DTI), 3T-diffusion kurtosis imaging (DKI), and 7T-DTI (left- most block). The three slices in the left block correspond to the same axial view of the dMRI volume with a b-value of 1,000 s/mm2 in each of the three protocols. Subsequently, dMRI data were processed by seven different processing pipelines (a second block from the left). The processed data were then used by TractSeg to segment 72 major white matter (WM) tracts (top right most block). The processed dMRI data were also fitted using either DTI or DKI (depending on the initial acquisition) to extract dMRI parameters. To assess the impact of smoothing prior to model fitting, this fitting step was performed with different degrees of smoothing, ranging from no to substantial smoothing (right most block second from top). Finally, Cohen's d was computed from the average and SD of the parameters within the 72 WM tracts segmented earlier (bottom block).
Figure 2
Figure 2
Examples of parameter maps. The maps derived by 3T-DTI are labelled in cyan, the ones derived by 7T-DTI in green, and the ones derived by 3T-DKI in gold color.
Figure 3
Figure 3
Demonstration of how a tract's volume change across six exemplar human controls for each of the three examined acquisition protocols. We chose to present the variation in the cingulum (top 3 rows) and in the fornix (bottom three rows), as an example of a tract that does not and does, respectively, challenge TractSeg in segmenting it. Note that the fornix is a very small tract in contrast to the cingulum that has a more recognizable shape, faciliating in that way TractSeg on segmenting it and vice-versa for the fornix.
Figure 4
Figure 4
Evaluation of volume variation in the tracts. The tract segmentation was based on data acquired with 3T-DTI (cyan), 3T-DKI (gold), and 7T-DTI (green) data. In cases where TractSeg provides the left and right part of one fiber-tract as two different tracts (e.g., in case of left and right arcuate fasciculus), the left and right parts of the tract were averaged. The vertical dashed line shows the threshold of 0.25, which corresponds to a high variation.
Figure 5
Figure 5
Impact of the processing pipeline. The impact of the processing pipelines (x-axis) is evaluated through effect size estimates (Cohen's d scores, y-axis). Top row: effect size estimates in mean fractional anisotropy (FA) from 3T-DTI (top left), 3T-DKI (top center), and 7T-DTI (top right). Bottom row: effect size estimates with mean diffusivity (MD) from 3T-DTI (top left), 3T-DKI (top center), and 7T-DTI (top right). No smoothing was applied. Each dot represents one tract. An orange dotted line in each plot defines the threshold in effect size above which the result is considered significant.
Figure 6
Figure 6
Depiction of the impact on effect sizes of each processing method. Impact is demonstrated in shades of blue (positive impact) and red (negative impact), with the former colors denoting an increase in effect size on that tract due to the method and the latter a decrease in effect size due to the method. The top panel refers to the impact of MPPCA method, the middle panel to the impact of Gibbs method, and the bottom panel to the impact of Eddy method. The depicted results were obtained by averaging over the mean diffusion tensor and kurtosis parameters, as well as the acquisition protocols.
Figure 7
Figure 7
Influence of Gaussian smoothing. Different levels of Gaussian smoothing (sigma, x-axis) were evaluated by the effect size estimates (Cohen's d, y-axis). (A–F) shows the effect on mean FA from 3T-DTI, mean axial diffusivity (AD) from 3T-DTI, mean MD from 7T-DTI, mean MK from 3T-DKI, mean AK from 3T-DKI, and SD of RK from 3T-DKI. The box plots show Cohen's d scores among tracts. Overall, smoothing had a detrimental influence on effect sizes. An orange dotted line in each plot defines the threshold in effect size above which the result is considered significant.
Figure 8
Figure 8
Evaluation of the acquisition protocol on the effect size. Columns show different diffusion parameters obtained with different protocols 3T-DTI, 3T-DKI, or 7T-DTI, shown in cyan, gold, and green, respectively. The mean (A) and SD (B) of each diffusion parameter, derived for each protocol were examined. Pipeline VII was used in all cases. No smoothing was applied. The swarm and box plots show the distribution and quartiles (together with the median) of Cohen's d values among tracts, respectively. Overall, 3T-DTI was the acquisition protocol that yielded the three most sensitive diffusion parameters [mean FA, SD of FA, and mean radial diffusivity (RD)], and exhibited effect sizes above 0.54 a threshold of significance before correcting for multiple comparisons) in the largest number of tracts. Moreover, the results between 3T-DTI and 7T-DTI were more similar than those between 3T-DTI and 3T-DKI, which implies that the choice of the diffusion protocol impacted the effect size analysis more than the choice of the magnetic field strength. Kurtosis parameters did not yield significant effect sizes, with the exception of the SD of RK, which had significant effects in a small number of tracts. An orange dotted line in each plot defines the threshold in effect size above which the result is considered significant.
Figure 9
Figure 9
Effect size of diffusion tensor parameters (FA, MD, AD, and RD) over the whole brain, when derived by the different acquisition protocols (3T-DTI, 3T-DKI, and 7T-DTI). Effect sizes in the depicted brains range from 0.0 (deep purple areas) to 1.0 (yellow areas). Overall, FA and RD were the parameters with the highest effect sizes across all three acquisition protocols, but the FA derived by 3T-DTI was the diffusion indices with the highest number of areas in the brain exceeding the value 0.54 of effect size. In the case of FA, 3T-DTI (top panel, first row) yielded the highest number of tracts with significantly large effect size than 3T-DKI (top panel, second row) and 7T-DTI (top panel, third row) since the brains in the top panel appear brighter than the brains in the second and third panels.
Figure 10
Figure 10
A summary of the spatial distribution of effect sizes over the whole brain, taking the maximum voxel-wise effect sizes across all diffusion tensor and kurtosis parameters (FA, MD, AD, and RD for all three acquisition protocols plus MK, AK, and RK in case of 3T-DKI). Effect sizes in the depicted brains range from 0.0 (deep purple areas) to 1.0 (yellow areas). Overall, 3T-DTI was the protocol with the highest effect sizes among all three acquisition protocols, with more voxels with an effect size exceeding the value 0.54, which was the threshold for significance (turquoise colors).

Similar articles

Cited by

References

    1. Lebel C, Gee M, Camicioli R, Wieler M, Martin W, Beaulieu C. Diffusion tensor imaging of white matter tract evolution over the lifespan. Neuroimage. (2012) 60:340–52. 10.1016/j.neuroimage.2011.11.094 - DOI - PubMed
    1. Schneider DK, Galloway R, Bazarian JJ, Diekfuss JA, Dudley J, Leach JL, et al. . Diffusion tensor imaging in athletes sustaining repetitive head impacts: a systematic review of prospective studies. J Neurotrauma. (2019) 36:2831–49. 10.1089/neu.2019.6398 - DOI - PubMed
    1. Mahan MY, Rafter DJ, Truwit CL, Oswood M, Samadani U. Evaluation of diffusion measurements reveals radial diffusivity indicative of microstructural damage following acute, mild traumatic brain injury. Magn Reson Imaging. (2020) 77:137–47. 10.1016/j.mri.2020.12.012 - DOI - PubMed
    1. Kubicki M, McCarley R, Westin CF, Park HJ, Maier S, Kikinis R, et al. . A review of diffusion tensor imaging studies in schizophrenia. J Psychiatr Res. (2007) 41:15–30. 10.1016/j.jpsychires.2005.05.005 - DOI - PMC - PubMed
    1. Cetin-Karayumak S, Di Biase MA, Chunga N, Reid B, Somes N, Lyall AE, et al. . White matter abnormalities across the lifespan of schizophrenia: a harmonized multi-site diffusion MRI study. Mol Psychiatry. (2020) 25:3208–19. 10.1038/s41380-019-0509-y - DOI - PMC - PubMed

LinkOut - more resources