

Design, synthesis and characterization of novel chromone based-copper(ii) antitumor agents with N, N-donor ligands: comparative DNA/RNA binding profile and cytotoxicity
- PMID: 35557803
- PMCID: PMC9089433
- DOI: 10.1039/c8ra06722h
Design, synthesis and characterization of novel chromone based-copper(ii) antitumor agents with N, N-donor ligands: comparative DNA/RNA binding profile and cytotoxicity
Abstract
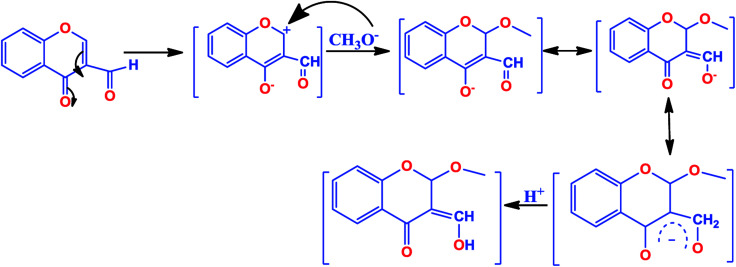
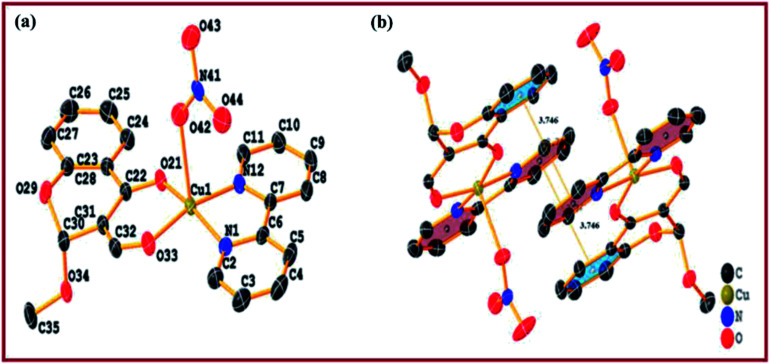
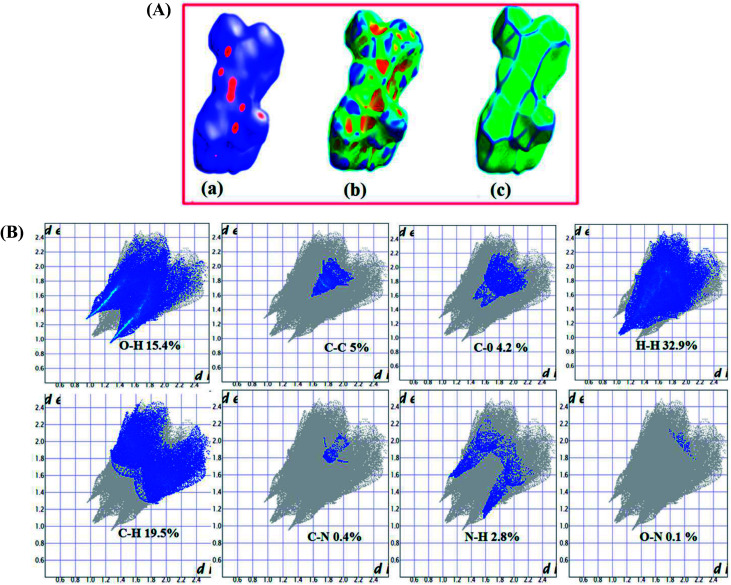
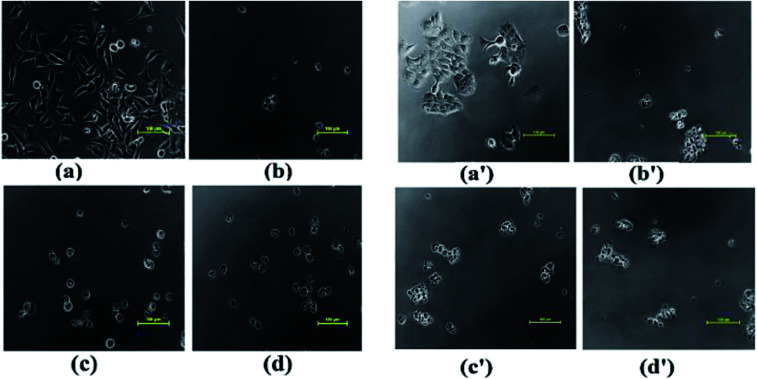
A series of new chromone based-Cu(ii) complexes 1-3 derived from bioactive pharmacophore, 3-formylchromone and N,N-donor ligands viz., 1,10-phenanthroline, 2,2'-bipyridine and 1R,2R-DACH were synthesized as potential antitumor agents and thoroughly characterized by UV-vis, FT-IR, EPR, ESI-MS and elemental analysis. Single X-crystal diffraction studies of complex 2 revealed triclinic P1̄ space group with square pyramidal geometry around the Cu(ii) center. Comparative in vitro binding studies with ct-DNA and tRNA were carried out using absorption and emission titration experiments which revealed intercalative mode of binding with higher binding propensity of complexes 1-3 towards tRNA as compared to ct-DNA. Additionally, complex 1 exhibited high binding affinity among all the three complexes due to the involvement of phen co-ligands via π-stacking interactions in between nucleic acid base pairs. Furthermore, Hirshfeld surface analysis was carried out for complex 2 to investigate various intra and intermolecular non-covalent interactions (H-bonding, C-H⋯π etc.) accountable for stabilization of crystal lattice. The cleavage activity of complex 1 was performed by gel electrophoretic assay with pBR322 DNA and tRNA which revealed efficient DNA/tRNA cleaving ability of complex, suggesting tRNA cleavage both concentration and time dependent. Furthermore, in vitro cytotoxic activity of complexes 1-3 on a selected panel of human cancer cell lines was performed which revealed that all three complexes exhibited remarkably good cytotoxic activity with GI50 value < 10 μg mL-1 (<20 μM).
This journal is © The Royal Society of Chemistry.
Conflict of interest statement
There are no conflicts to declare.
Figures


Similar articles
-
Structure elucidation {spectroscopic, single crystal X-ray diffraction and computational DFT studies} of new tailored benzenesulfonamide derived Schiff base copper(II) intercalating complexes: Comprehensive biological profile {DNA binding, pBR322 DNA cleavage, Topo I inhibition and cytotoxic activity}.Bioorg Chem. 2020 Jan;94:103427. doi: 10.1016/j.bioorg.2019.103427. Epub 2019 Nov 9. Bioorg Chem. 2020. PMID: 31735357
-
RNA-targeted Cu(II)-based potential antitumor drug entity: comprehensive structural, biological {DNA/RNA binding, cleavage, cytotoxicity} and computational studies.J Biomol Struct Dyn. 2021 Oct;39(16):6070-6083. doi: 10.1080/07391102.2020.1797535. Epub 2020 Jul 25. J Biomol Struct Dyn. 2021. PMID: 32715942
-
Mechanistic insights into a novel chromone-appended Cu(II) anticancer drug entity: in vitro binding profile with DNA/RNA substrates and cytotoxic activity against MCF-7 and HepG2 cancer cells.Dalton Trans. 2015 Jun 14;44(22):10330-42. doi: 10.1039/c5dt00770d. Dalton Trans. 2015. PMID: 25970097
-
Water soluble transition metal [Ni(II), Cu(II) and Zn(II)] complexes of N-phthaloylglycinate bis(1,2-diaminocyclohexane). DNA binding, pBR322 cleavage and cytotoxicity.Dalton Trans. 2022 Aug 9;51(31):11713-11729. doi: 10.1039/d2dt01312f. Dalton Trans. 2022. PMID: 35852297
-
Water soluble ionic Co(II), Cu(II) and Zn(II) diimine-glycinate complexes targeted to tRNA: structural description, in vitro comparative binding, cleavage and cytotoxic studies towards chemoresistant prostate cancer cells.Dalton Trans. 2020 Dec 8;49(46):16830-16848. doi: 10.1039/d0dt02657c. Dalton Trans. 2020. PMID: 33179662
Cited by
-
Comparative in vitro cytotoxicity and binding investigation of artemisinin and its biogenetic precursors with ctDNA.RSC Adv. 2020 Jun 25;10(41):24203-24214. doi: 10.1039/d0ra02042g. eCollection 2020 Jun 24. RSC Adv. 2020. PMID: 35516214 Free PMC article.
-
Evaluation of cytotoxic potential of structurally well-characterized RNA targeted ionic non-steroidal anti-inflammatory (NSAID) Cu(ii) & Zn(ii) DACH-mefenamato drug conjugates against human cancer cell lines.RSC Adv. 2019 Dec 24;10(1):166-178. doi: 10.1039/c9ra07464c. eCollection 2019 Dec 20. RSC Adv. 2019. PMID: 35492558 Free PMC article.
-
A Review on Applications of Computational Methods in Drug Screening and Design.Molecules. 2020 Mar 18;25(6):1375. doi: 10.3390/molecules25061375. Molecules. 2020. PMID: 32197324 Free PMC article. Review.
-
A Coumarin-Based Fluorescent Probe for Ratiometric Detection of Cu2+ and Its Application in Bioimaging.Front Chem. 2020 Oct 2;8:800. doi: 10.3389/fchem.2020.00800. eCollection 2020. Front Chem. 2020. PMID: 33134262 Free PMC article.
-
Ru(II)(ƞ6-p-cymene) Conjugates Loaded onto Graphene Oxide: An Effective pH-Responsive Anticancer Drug Delivery System.Molecules. 2022 Nov 5;27(21):7592. doi: 10.3390/molecules27217592. Molecules. 2022. PMID: 36364418 Free PMC article.
References
-
- Gandin V. Tisato F. Dolmella A. Pellei M. Santini C. Giorgetti M. Marzano C. Porchia M. J. Med. Chem. 2014;57:4745–4760. doi: 10.1021/jm500279x. - DOI - PubMed
- Gou Y. Qi J. Ajayi J. P. Zhang Y. Zhou Z. Wu X. Yang F. Liang H. Mol. Pharmaceutics. 2015;12:3597–3609. doi: 10.1021/acs.molpharmaceut.5b00314. - DOI - PubMed
LinkOut - more resources
Full Text Sources
Research Materials
Miscellaneous