. 2018 Dec 4;8(71):40505-40510.
doi: 10.1039/c8ra07971d.

Na-Ga-Si type-I clathrate single crystals grown via Na evaporation using Na-Ga and Na-Ga-Sn fluxes

Affiliations

Na-Ga-Si type-I clathrate single crystals grown via Na evaporation using Na-Ga and Na-Ga-Sn fluxes

Hironao Urushiyama et al. RSC Adv. .

Abstract

Single crystals of a Na-Ga-Si clathrate, Na8Ga5.70Si40.30, of size 2.9 mm were grown via the evaporation of Na from a Na-Ga-Si melt with the molar ratio of Na : Ga : Si = 4 : 1 : 2 at 773 K for 21 h under an Ar atmosphere. The crystal structure was analyzed using X-ray diffraction with the model of the type-I clathrate (cubic, a = 10.3266(2) Å, space group Pmn, no. 223). By adding Sn to a Na-Ga-Si melt (Na : Ga : Si : Sn = 6 : 1 : 2 : 1), single crystals of Na8Ga x Si46-x (x = 4.94-5.52, a = 10.3020(2)-10.3210(3) Å), with the maximum size of 3.7 mm, were obtained via Na evaporation at 723-873 K. The electrical resistivities of Na8Ga5.70Si40.30 and Na8Ga4.94Si41.06 were 1.40 and 0.72 mΩ cm, respectively, at 300 K, and metallic temperature dependences of the resistivities were observed. In the Si L2,3 soft X-ray emission spectrum of Na8Ga5.70Si40.30, a weak peak originating from the lowest conduction band in the undoped Si46 was observed at an emission energy of 98 eV.


Conflict of interest statement

There are no conflicts to declare.

Figures

Fig. 1
Fig. 1. Optical micrographs of the single crystals grown via Na evaporation from the Na–Ga–Si–Sn starting sample at 873 K for 3 h under an Ar atmosphere (∼105 Pa), followed by alcohol and acid treatments.
Fig. 2
Fig. 2. Ga content of type-I clathrates Na8GaxSi46−xversus heating temperatures of Na–Ga–Si mixture (△) and Na–Ga–Si–Sn mixtures (●).
Fig. 3
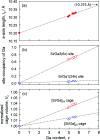
Fig. 3. Plots of a-axis length (a), 6c and 24k site occupancies of Ga (b), and normalized volumes of [Si/Ga]24 cage and [Si/Ga]20 cage (c) versus Ga content x of Na8GaxSi46−x.
Fig. 4
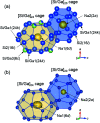
Fig. 4. [Si/Ga]20 and [Si/Ga]24 cages of Na8Ga5.70Si40.30 depicting with spheres of occupancies (a) and 99% probability displacement ellipsoids (b).
Fig. 5
Fig. 5. Plot of a-axis length versus ionic radius (coordination number 12) of the guest atoms for Na8Si46, Na8Ga5.7Si40.3 and A8(Al/Ga)8Si38 (A = Na, K, Rb, and Cs). The hypothetical a-axis length of Na8Ga8Si38 estimated in Fig. 3(a) is also plotted with ×.
Fig. 6
Fig. 6. Si L2,3 SXE spectra of Na8Ga5.70Si40.30, Na8Si46, and d-Si.
Fig. 7
Fig. 7. Temperature dependence of electrical resistivity for single crystals of Na8Ga5.70Si40.30, Na8Ga4.94Si41.06, and Na8Si46.

References

    1. Kasper J. S. Hagenmuller P. Pouchard M. Cros C. Science. 1965;150:1713. doi: 10.1126/science.150.3704.1713. - DOI - PubMed
    1. Adams G. B. O'Keeffe M. Demkov A. A. Sankey O. F. Huang Y.-M. Phys. Rev. B. 1994;49:8048. doi: 10.1103/PhysRevB.49.8048. - DOI - PubMed
    1. Dolyniuk J.-A. Owens-Baird B. Wang J. Zaikina J. V. Kovnir K. Mater. Sci. Eng. R Rep. 2016;108:1. doi: 10.1016/j.mser.2016.08.001. - DOI
    1. Kawaji H. Horie H. Yamanaka S. Ishikawa M. Phys. Rev. Lett. 1995;74:1427. doi: 10.1103/PhysRevLett.74.1427. - DOI - PubMed
    1. Morito H. Yamada T. Ikeda T. Yamane H. J. Alloys Compd. 2009;480:723. doi: 10.1016/j.jallcom.2009.02.036. - DOI