

Influence of Donor Race and Donor-recipient Race-matching on Pediatric Kidney Transplant Outcomes
- PMID: 35557992
- PMCID: PMC9088235
- DOI: 10.1097/TXD.0000000000001324
Influence of Donor Race and Donor-recipient Race-matching on Pediatric Kidney Transplant Outcomes
Abstract
Existing literature has demonstrated the significant relationship between race and kidney transplant outcomes; however, there are conflicting and limited data on the influence of donor race or donor-recipient race-matching on pediatric kidney transplant outcomes.
Methods: Analysis included kidney-only transplant recipients between ages 2 and 17 from 2000 to 2017 enrolled in the Organ Procurement and Transplantation Network and their associated donors. Multivariable regression models were used to compare outcomes by donor race and donor-recipient race-matched status.
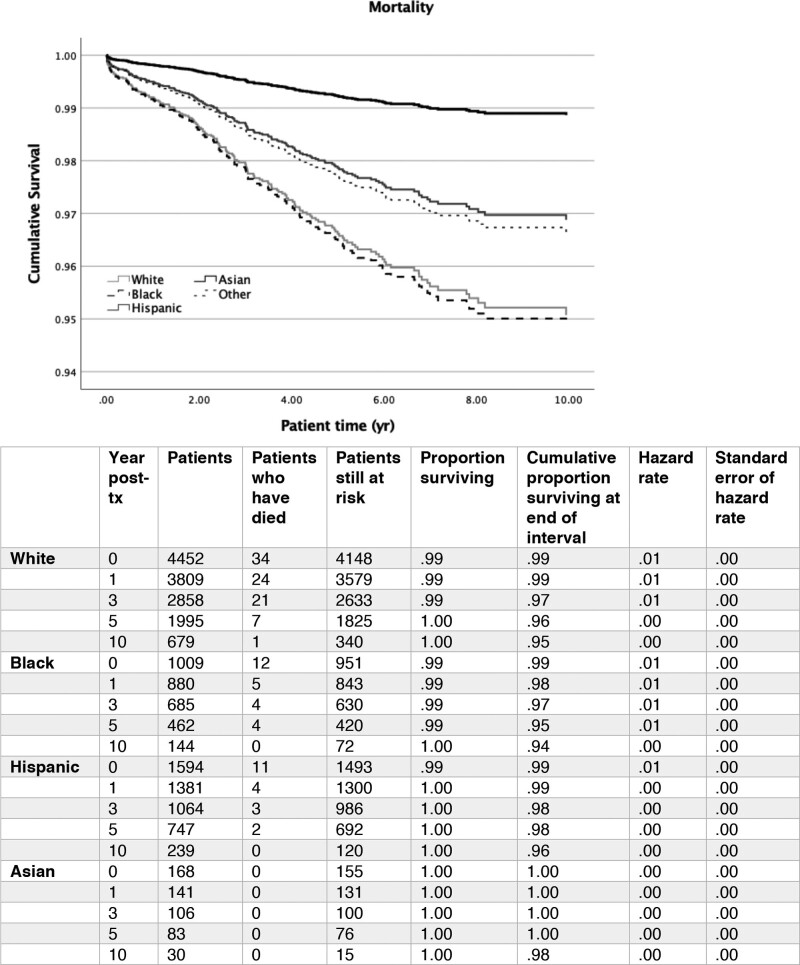
Results: Of the total 7343 recipients, 4458 (60.7%) recipients received a kidney from a White donor, 1009 (13.7%) from a Black donor, 1594 (21.7%) from Hispanic donor, and 169 (4.1%) from an Asian donor; 4089 (55.7%) were race-matched. No donor races were significantly associated with transplant outcomes (all P > 0.05). Race-matched status was not associated with graft failure (hazard ratio, 1.03; 95% confidence interval [CI] = 0.89-1.2; P = 0.68), mortality (hazard ratio, 1.1; 95% CI, 0.79-1.53; P = 0.56), acute rejection at 1 y (odds ratio, 0.94; 95% CI, 0.77-1.15; P = 0.53), or delayed graft function (odds ratio, 1.02; 95% CI, 0.80-1.29; P = 0.91).
Conclusions: Neither donor race nor race-matched status is associated with better transplant outcomes. Further studies are necessary to confirm the impact of donor race and race-matching more fully on pediatric kidney transplant outcomes.
Copyright © 2022 The Author(s). Transplantation Direct. Published by Wolters Kluwer Health, Inc.
Conflict of interest statement
The authors declare no funding or conflicts of interest.
Figures


References
-
- Flores G; Committee On Pediatric Research. Technical report–racial and ethnic disparities in the health and health care of children. Pediatrics. 2010;125:e979–e1020. - PubMed
-
- Guan I, Singer P, Frank R, et al. Role of race in kidney transplant outcomes in children with focal segmental glomerulosclerosis. Pediatr Transplant. 2016;20:790–797. - PubMed
-
- Isaacs RB, Nock SL, Spencer CE, et al. Racial disparities in renal transplant outcomes. AM J Kidney Dis. 1999;34:706–712. - PubMed
-
- Zhou YC, Cecka JM, Terasaki PI. Effect of race on kidney transplants. Clin Transpl. 1990;447–459. - PubMed
LinkOut - more resources
Full Text Sources
