

Peptide of Trichinella spiralis Infective Larval Extract That Harnesses Growth of Human Hepatoma Cells
- PMID: 35558100
- PMCID: PMC9086976
- DOI: 10.3389/fcimb.2022.882608
Peptide of Trichinella spiralis Infective Larval Extract That Harnesses Growth of Human Hepatoma Cells
Abstract
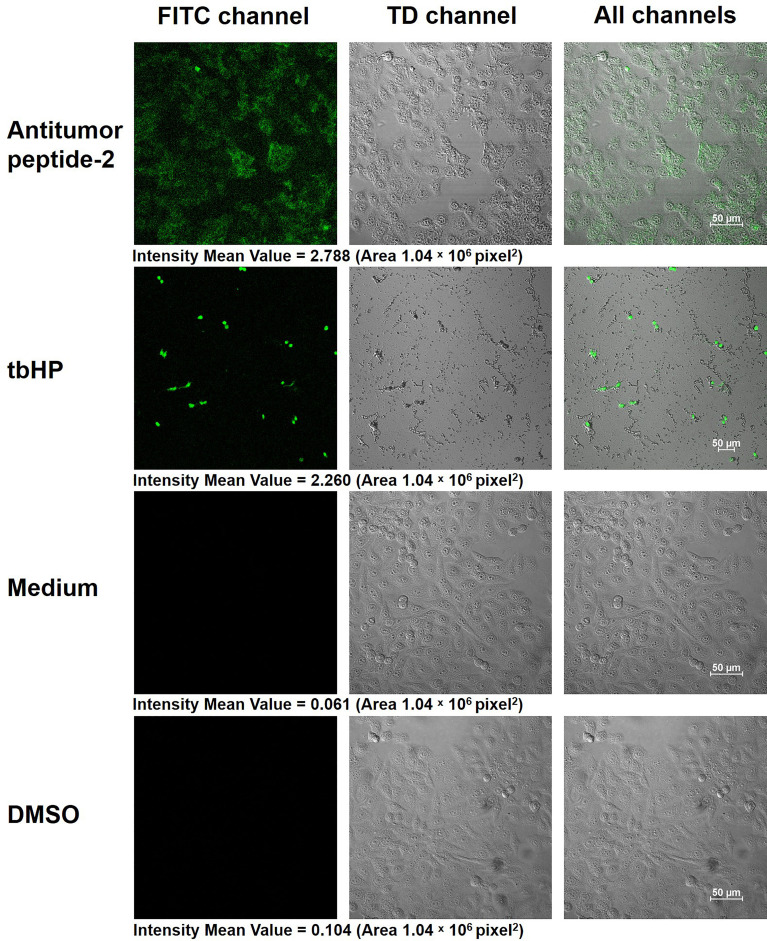
Trichinella spiralis, a tissue-dwelling helminth, causes human trichinellosis through ingestion of undercooked meat containing the parasite's infective larvae. However, benefits from T. spiralis infection have been documented: reduction of allergic diseases, inhibition of collagen-induced arthritis, delay of type 1 diabetes progression, and suppression of cancer cell proliferation. Since conventional cancer treatments have limited and unreliable efficacies with adverse side effects, novel adjunctive therapeutic agents and strategies are needed to enhance the overall treatment outcomes. This study aimed to validate the antitumor activity of T. spiralis infective larval extract (LE) and extricate the parasite-derived antitumor peptide. Extracts of T. spiralis infective larvae harvested from striated muscles of infected mice were prepared and tested for antitumor activity against three types of carcinoma cells: hepatocellular carcinoma HepG2, ovarian cancer SK-OV-3, and lung adenocarcinoma A549. The results showed that LE exerted the greatest antitumor effect on HepG2 cells. Proteomic analysis of the LE revealed 270 proteins. They were classified as cellular components, proteins involved in metabolic processes, and proteins with diverse biological functions. STRING analysis showed that most LE proteins were interconnected and played pivotal roles in various metabolic processes. In silico analysis of anticancer peptides identified three candidates. Antitumor peptide 2 matched the hypothetical protein T01_4238 of T. spiralis and showed a dose-dependent anti-HepG2 effect, not by causing apoptosis or necrosis but by inducing ROS accumulation, leading to inhibition of cell proliferation. The data indicate the potential application of LE-derived antitumor peptide as a complementary agent for human hepatoma treatment.
Keywords: Trichinella spiralis; antitumor peptide; drug discovery; human hepatocellular carcinoma HepG2 cell; infective larva; proteomics.
Copyright © 2022 Ruenchit, Reamtong, Khowawisetsut, Adisakwattana, Chulanetra, Kulkeaw and Chaicumpa.
Conflict of interest statement
The authors declare that the research was conducted in the absence of any commercial or financial relationships that could be construed as a potential conflict of interest.
Figures


Similar articles
-
[The usefulness of ELISA test for early serological detection of Trichinella spp. infection in pigs].Wiad Parazytol. 2007;53(2):149-51. Wiad Parazytol. 2007. PMID: 17912813 Polish.
-
Immuno-proteomic analysis of Trichinella spiralis, T. pseudospiralis, and T. papuae extracts recognized by human T. spiralis-infected sera.Parasitol Res. 2018 Jan;117(1):201-212. doi: 10.1007/s00436-017-5694-5. Epub 2017 Nov 30. Parasitol Res. 2018. PMID: 29189952
-
Identification and profiling of Trichinella spiralis circulating antigens and proteins in sera of mice with trichinellosis.PLoS One. 2022 Mar 10;17(3):e0265013. doi: 10.1371/journal.pone.0265013. eCollection 2022. PLoS One. 2022. PMID: 35271623 Free PMC article.
-
Immunoproteomic analysis of Trichinella spiralis and Trichinella britovi excretory-secretory muscle larvae proteins recognized by sera from humans infected with Trichinella.PLoS One. 2020 Nov 5;15(11):e0241918. doi: 10.1371/journal.pone.0241918. eCollection 2020. PLoS One. 2020. PMID: 33152047 Free PMC article.
-
Vaccines against Trichinella spiralis: Progress, challenges and future prospects.Transbound Emerg Dis. 2018 Dec;65(6):1447-1458. doi: 10.1111/tbed.12917. Epub 2018 Jun 6. Transbound Emerg Dis. 2018. PMID: 29873198 Review.
Cited by
-
Parasites revive hope for cancer therapy.Eur J Med Res. 2024 Oct 5;29(1):489. doi: 10.1186/s40001-024-02057-2. Eur J Med Res. 2024. PMID: 39367471 Free PMC article. Review.
-
The role of helminths and their antigens in cancer therapy: insights from cell line models.Infect Agent Cancer. 2024 Oct 9;19(1):52. doi: 10.1186/s13027-024-00613-3. Infect Agent Cancer. 2024. PMID: 39385244 Free PMC article. Review.
References
-
- Bruschi F., Carulli G., Azzarà A., Homan W., Minnucci S., Rizzuti-Gullaci A., et al. . (2000). Inhibitory Effects of Human Neutrophil Functions by the 45-kDa Glycoprotein Derived From the Parasitic Nematode Trichinella Spiralis . Int. Arch. Allergy Immunol. 122, 58–65. doi: 10.1159/000024359 - DOI - PubMed
Publication types
MeSH terms
Substances
LinkOut - more resources
Full Text Sources
Medical