. 2022 May 5;11(1):2066767.
doi: 10.1080/2162402X.2022.2066767. eCollection 2022.

Neoadjuvant chemoradiation alters the immune microenvironment in pancreatic ductal adenocarcinoma

Affiliations

Neoadjuvant chemoradiation alters the immune microenvironment in pancreatic ductal adenocarcinoma

Robyn D Gartrell et al. Oncoimmunology. .

Abstract

Patients with pancreatic ductal adenocarcinoma (PDAC) have a grim prognosis despite complete surgical resection and intense systemic therapies. While immunotherapies have been beneficial with many different types of solid tumors, they have almost uniformly failed in the treatment of PDAC. Understanding how therapies affect the tumor immune microenvironment (TIME) can provide insights for the development of strategies to treat PDAC. We used quantitative multiplexed immunofluorescence (qmIF) quantitative spatial analysis (qSA), and immunogenomic (IG) analysis to analyze formalin-fixed paraffin embedded (FFPE) primary tumor specimens from 44 patients with PDAC including 18 treated with neoadjuvant chemoradiation (CRT) and 26 patients receiving no treatment (NT) and compared them with tissues from 40 treatment-naïve melanoma patients. We find that relative to NT tumors, CD3+ T cell infiltration was increased in CRT treated tumors (p = .0006), including increases in CD3+CD8+ cytotoxic T cells (CTLs, p = .0079), CD3+CD4+FOXP3- T helper cells (Th, p = .0010), and CD3+CD4+FOXP3+ regulatory T cells (Tregs, p = .0089) with no difference in CD68+ macrophages. IG analysis from micro-dissected tissues indicated overexpression of genes involved in antigen presentation, T cell activation, and inflammation in CRT treated tumors. Among treated patients, a higher ratio of Tregs to total T cells was associated with shorter survival time (p = .0121). Despite comparable levels of infiltrating T cells in CRT PDACs to melanoma, PDACs displayed distinct spatial profiles with less T cell clustering as defined by nearest neighbor analysis (p < .001). These findings demonstrate that, while CRT can achieve high T cell densities in PDAC compared to melanoma, phenotype and spatial organization of T cells may limit benefit of T cell infiltration in this immunotherapy-resistant tumor.

Keywords: T regulatory cells; Tumor microenvironment; biomarkers; tumor-infiltrating lymphocytes.


Conflict of interest statement

YMS has recieved funding from Regeneron. BTF has financial interests in both Regeneron and Thermo Fisher Scientific. GAM is a consultant for CEND Biopharma and Synthekine, and has recieved funding from MERCK, Roche, BioLine, and Regeneron. None of the disclosures listed are related to this work.

Figures
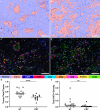
Figure 1.
Figure 1.
Representative tissue segmentation and multiplex immunofluorescence (mIF) image of a non-treated (NT) patient and a patient who received neoadjuvant chemoradiation (CRT) and analysis of total tumor density. Tissue segmentation images for A) NT and B) CRT. Blue cells are DAPI (nuclei) positive. Red areas represent tumor tissue, blue areas represent stromal tissue. Multiplex view of the same C) NT and D) CRT images stained using mIF for DAPI (nuclei, blue), Ki67 (tumor, proliferative cells, red), CD3 (T cells, cyan), CD4 (T helper cells, (Th), Orange), CD8 (cytotoxic T cells (CTLs), magenta), FOXP3 (T regulatory cells (Tregs), yellow), CD68 (macrophages, green). White bars represent 100 μm. E) Comparison of the ratio of total cells in the tumor compartment to total cells in the overall tissue sample between treatment groups (p < .0001). F) Comparison of the densities of Ki67+ cells in the total tissue samples between treatment groups (p = .0067). (*≤0.05, **≤0.01, ***≤0.001, ****≤0.0001).
Figure 2.
Figure 2.
Density of immune cells in tumor, stroma, and total tissue comparing NT to CRT cases. A) CD3+ T cells in tumor (p = .0006), B) CD3+ T cells in stroma (p = .0078), and C) CD3+ T cells in total (p = .0013). D) CD3+CD8+ cytotoxic T cells (CTLs) in tumor (p = .0079), E) CD3+CD8+ CTLs in stroma (p = .0758), and F) CD3+CD8+ CTLs in total (p = .0076). G) CD3+CD4+FOXP3 T helper (Th) cells in tumor (p = .0010), H) CD3+CD4+FOXP3 Th cells in stroma (p = .0216), and I) CD3+CD4+FOXP3 Th cells in total (p = .0078). J) CD3+ CD4+ FOXP3 + T regulatory (Treg) cells in tumor (p = .0089), K) CD3+CD4+FOXP3+ Treg cells in stroma (p = .4211), and L) CD3+CD4+FOXP3+ Treg cells in total (p = .1464). Lines represent median values. (*≤0.05, **≤0.01, ***≤0.001, ****≤0.0001).
Figure 3.
Figure 3.
Comparing ratios of T cell subsets within the tumor compartment between NT and CRT. A) CD3+ T cell to CD68+ macrophage ratio (p < .0001). B) CD3+ T cell to Ki67+ cell ratio (p < .0001). C) CD3+CD4+FOXP3 Th cell to CD3+CD4+FOXP3+ Treg cell ratio (0.0260). Lines represent median values. (*≤0.05, **≤0.01, ***≤0.001, ****≤0.0001).
Figure 4.
Figure 4.
Comparison of overall survival (OS) of CRT treated patients using CD3+CD4+FOXP3+ (Treg cell) to CD3+ (T cell) ratio. A) Comparison of the ratios of CD3+CD4+FOXP3+ Treg cells to total CD3+ T cells within the tumor compartment between CRT patients who lived <2 years (Short Term Survivor, n = 6) and >2 years (Long Term Survivor, n = 8) after diagnosis (p = .0007). B) Kaplan Meier curve demonstrating the difference in survival between patients with lower (Low Treg/CD3, n = 7) and higher (High Treg/CD3, n = 7) than median CD3+CD4+FOXP3+ cell to CD3+ cell ratios (p = .0121 by Mantel-Cox). Representative quantitative mIF images of C) a CRT patient surviving >2 years and D) a CRT patient surviving <2 years stained for DAPI (blue), CD3 (yellow), CD4 (magenta) and FOXP3 (green). White bars represent 100 μm. (*≤0.05, **≤0.01, ***≤0.001, ****≤0.0001).
Figure 5.
Figure 5.
Density, survival, and spatial proximity analysis of CD3+CD8+ cells in CRT PDAC and melanoma. Comparison of CD3+CD8+ cell densities between A) the total tissue compartments of CRT PDAC and melanoma (p = .5267), and B) the tumor and stroma compartments of CRT PDAC (p = .3761) and melanoma (p < .0001), respectively. Lines represent median values. Representative CD8 IHC views of C) CRT PDAC and D) melanoma illustrate the differences in density and spatial profiles of CD8+ cells between the two neoplasms. Black bars represent 100 μm. E) K-nearest neighbor distance analysis was performed for k = 1, k = 5, and k = 20 nearest CD3+CD8+ cells to another CD3+CD8+ cell. The nearest neighbor distances among each neoplasm type were compared for each k using Kruskal-Wallis tests (k = 1, p < .0001; k = 5, p < .0001; k = 20, p < .0001), and the following pairwise distance comparisons were made using Dunn’s multiple comparisons test: NT PDAC v. melanoma (k = 1, p < .0001; k = 5, p < .0001; k = 20, p < .0001), NT PDAC v. CRT PDAC (k = 1, p = .0226; k = 5, p = .1593; k = 20, p = .5595), and CRT PDAC v. melanoma (k = 1, p = .0165; k = 5, p = .0011; k = 20, p < .0001). F) Comparison of the average nearest neighbor distances for k = 20 between CD3+CD8+ cells in the stroma and tumor compartments of CRT PDAC (p = .3060) and melanoma (p < .0001), respectively. Data points represent median values, with brackets representing 95% confidence intervals. G) Analysis of the frequency with which a specified number (n) of CD3+CD8+ cells fell within a 20 micron radius of another CD3+CD8+ cell between CRT PDAC and melanoma demonstrated differences for n = 0 (p = .0007) and n = 1 (p = .049). (*≤0.05, **≤0.01, ***≤0.001, ****≤0.0001).

References

    1. Surveillance . Epidemiology, and end results program (SEER): pancreatic cancer. 2021 ed. Bethesda (MD): National Cancer Institute (NCI; ). 2021.
    1. Rahib L, Smith BD, Aizenberg R, Rosenzweig AB, Fleshman JM, Matrisian LM.. Projecting cancer incidence and deaths to 2030: the unexpected burden of thyroid, liver, and pancreas cancers in the United States. Cancer Res. 2014;74(11):2913–12. doi:10.1158/0008-5472.CAN-14-0155. - DOI - PubMed
    1. Janssen QP, O’Reilly EM, van Eijck CHJ, Groot Koerkamp B.. Neoadjuvant treatment in patients with resectable and borderline resectable pancreatic cancer. Front Oncol. 2020;10:41. doi:10.3389/fonc.2020.00041. - DOI - PMC - PubMed
    1. Li D, Xie K, Wolff R, Abbruzzese JL. Pancreatic cancer. Lancet. 2004;363(9414):1049–1057. doi:10.1016/S0140-6736(04)15841-8. - DOI - PubMed
    1. Neoptolemos JP, Palmer DH, Ghaneh P, Psarelli EE, Valle JW, Halloran CM, Faluyi O, O’Reilly DA, Cunningham D, Wadsley J, et al. Comparison of adjuvant gemcitabine and capecitabine with gemcitabine monotherapy in patients with resected pancreatic cancer (ESPAC-4): a multicentre, open-label, randomised, phase 3 trial. Lancet. 2017;389(10073):1011–1024. doi:10.1016/S0140-6736(16)32409-6. - DOI - PubMed

Publication types

MeSH terms

Substances