. 2018 Nov 19;8(68):38872-38882.
doi: 10.1039/c8ra06832a. eCollection 2018 Nov 16.

Alteration of glycosylation in serum proteins: a new potential indicator to distinguish non-diabetic renal diseases from diabetic nephropathy

Affiliations

Alteration of glycosylation in serum proteins: a new potential indicator to distinguish non-diabetic renal diseases from diabetic nephropathy

Moyan Liu et al. RSC Adv. .

Abstract

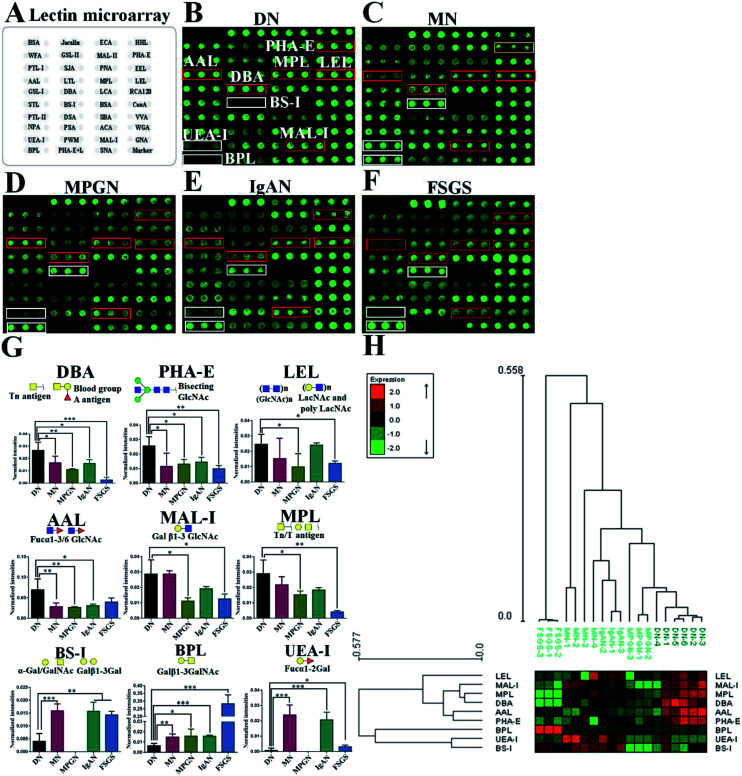
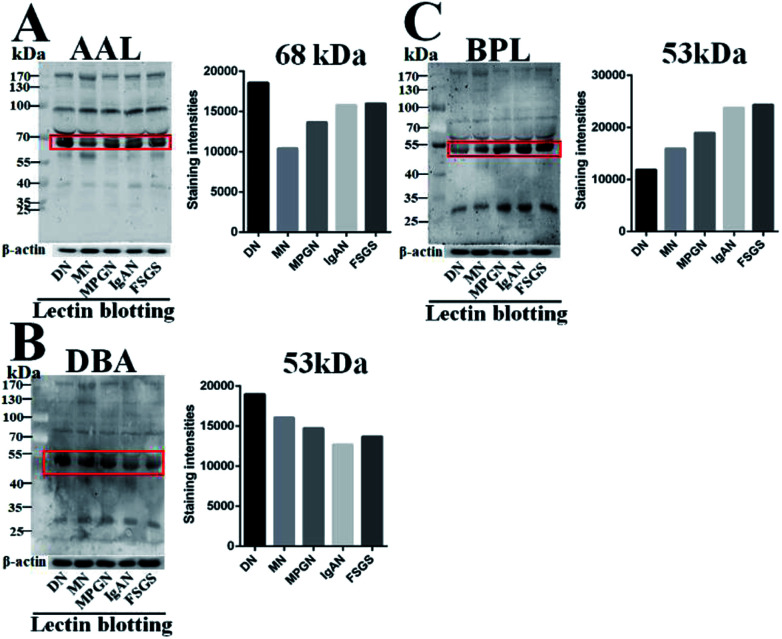
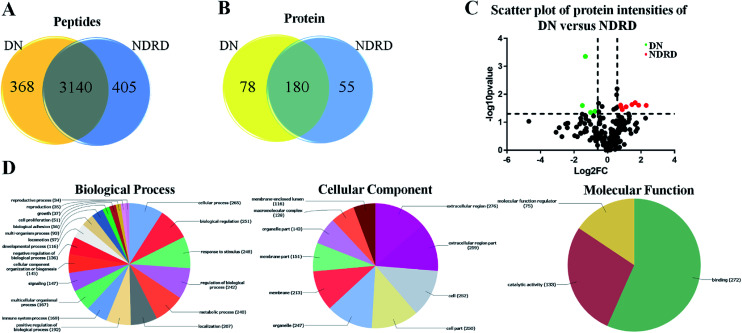
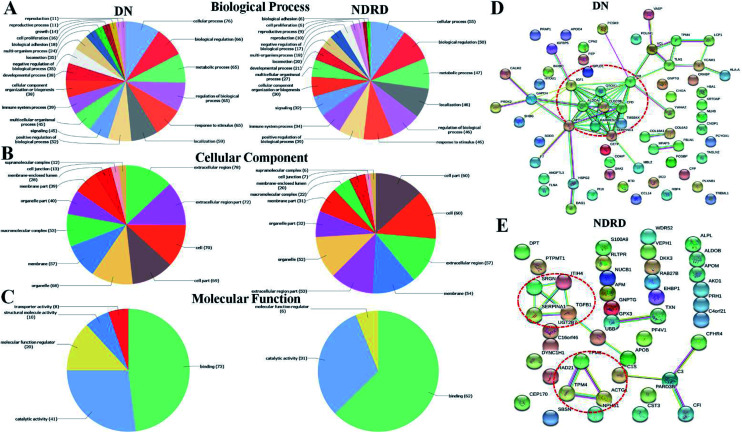
Diabetic nephropathy (DN) and nondiabetic renal disease (NDRD) are two major categories of renal diseases in diabetes mellitus patients. The clinical differentiation among them is usually not so clear and effective. In this study, sera from DN and NDRD patients were collected, and glycan profiles of serum proteins from DN and NDRD patients were investigated and compared by using lectin microarray and lectin blot. Then, altered glycoproteins were enriched by lectin coupled magnetic particle conjugate and characterized by LC-MS/MS. We found significant change in glycan patterns between DN and NDRD patients. In particular, the relative abundance of the glycopattern of Galβ1-3GalNAc which was identified by BPL (Bauhinia purpurea lectin) was significantly decreased in DN patients compared to four types of NDRD patients (p < 0.05). Moreover, BPL blotting indicated that the proteins with a molecular weight of about 53 kDa exhibited low staining signal in DN compared to all NDRD groups, which was consistent with results of lectin microarrays. After enriching by BPL and identification by LC-MS/MS, a total of 235 and 258 proteins were characterized from NDRD and DN respectively. Among these, the relative abundance of 12 isolated serum proteins exhibited significantly alteration between DN and NDRD (p < 0.05). Our findings indicated not only the relative abundance of Galβ1-3GalNAc on serum proteins but also certain glycoproteins modified with this glycopattern showed a difference between DN and NDRD patients. This suggested that the analysis of this alteration by using urine specimens may constitute an additional valuable diagnostic tool for differentiating DN and NDRD with a non-invasive method.


Conflict of interest statement

The authors declare no conflict of interest.

Figures

Fig. 1
Fig. 1. Comparision of glycan patterns of serum glycoproteins between DN and NDRD groups. (A) Layout of lectin microarray. The profile of Cy3-labelled serum proteins from DN (B), MN (C), MPGN (D), IgAN (E) and FSGS (F) bound to the lectin microarrays, respectively. The lectins showing significantly increased or decreased in DN compared to four NDRD groups were marked with red or white frames. (G) The NFIs of 9 lectins were significantly different in DN compared to NDRD groups (including MN, MPGN, IgAN and FSGS) reference based on fold change and One-way ANOVA (*p < 0.05, **p < 0.01, and ***p < 0.001). The data are presented as the averaged NFI ± SD. (H) Heat map and hierarchical clustering analysis of the 9 lectins exhibiting significantly difference NFIs between DN and NDRD. Glycan profiles of DN and NDRD groups (including MN, MPGN, IgAN and FSGS) were clustered (average linkage, correlation similarity). Samples are listed in columns and the lectins are listed in rows. The color and intensity of each square indicated expression levels relative to other data in the row. Red, high; green, low; black, medium.
Fig. 2
Fig. 2. Binding patterns of glycoproteins in pooled sera from DN and NDRD groups for AAL, DBA and BPL. The serum proteins from DN and NDRD groups were separated by 10% SDS-PAGE and transferred in PVDF membrane. The 30 μg of Cy5 labelled AAL (A), DBA (B) and BPL (C) were incubated with membranes, and images were acquired by STROM fluorImager respectively. The gray values of the protein bands marked with red frames were measured by imageJ software.
Fig. 3
Fig. 3. Characterization and bioinformatic analysis of glycoproteins isolated from DN and NDRD. (A) and (B) Cross-correlation of the isolated glycoproteins from DN and NDRD by BPL coupled magnetic particle conjugates. The Venn diagram presents the number of peptides and proteins identified. (C) Volcano plot of protein abundance differences as a function of statistical significance between DN and NDRD. Y-axis is p values (−log10) versus protein log2 fold change (x-axis) in NDRD/DN. The color code indicates upregulation (red) (fold change > 1.5, p < 0.05) and downregulation (green) (fold change < 0.67, p < 0.05). Proteins with no statistically significant difference in expression between NDRD and DN are in black. (D) Classification of the identified proteins in biological process, cellular component and molecular function by Blast2GO.
Fig. 4
Fig. 4. Characterization and bioinformatic analysis of differential glycoproteins isolated from DN and NDRD. Gene Ontology (GO) domain overview of differential proteins. The differential proteins of DN and NDRD were input into the three GO domains: biological process (A), cellular component (B), and molecular function (C) and the resultant terms associated with these terms are visualized as pie charts. Term names are located next to their position on the chart. (D and E) Protein interaction network generated and visualized with STRING 9.0 for differential proteins of DN or NDRD. The strength of the associations is represented by line thickness. Networks with three or more protein interactions are shown. Required confidence (score) of protein association was high confidence. Selected, functionally important protein core complexes and the proteins involved in same biochemical reaction are marked with red imaginary line.

Similar articles

Cited by

References

    1. Kanwar Y. S. Sun L. Xie P. Liu F. Y. Chen S. Annu. Rev. Pathol.: Mech. Dis. 2011;6:395. doi: 10.1146/annurev.pathol.4.110807.092150. - DOI - PMC - PubMed
    1. Fineberg D. Jandeleit-Dahm K. A. Cooper M. E. Nat. Rev. Endocrinol. 2013;9:713. doi: 10.1038/nrendo.2013.184. - DOI - PubMed
    1. Levey A. S. N. Engl. J. Med. 2002;347:1505. doi: 10.1056/NEJMcp013462. - DOI - PubMed
    1. Liang S. Zhang X. Cai G. Zhu H. Zhou J. Wu J. Chen P. Lin S. Qiu Q. Chen X. PLoS One. 2013;8:e64184. doi: 10.1371/journal.pone.0064184. - DOI - PMC - PubMed
    1. Dong Z. Wang Y. Qiu Q. Zhang X. Zhang L. Wu J. Wei R. Zhu H. Cai G. Sun X. Chen X. Diabetes Res. Clin. Pract. 2016;121:112. doi: 10.1016/j.diabres.2016.09.005. - DOI - PubMed