. 2018 Oct 24;8(63):36201-36208.
doi: 10.1039/c8ra05586f. eCollection 2018 Oct 22.

Polydopamine nanoparticles kill cancer cells

Affiliations

Polydopamine nanoparticles kill cancer cells

Celia Nieto et al. RSC Adv. .

Abstract

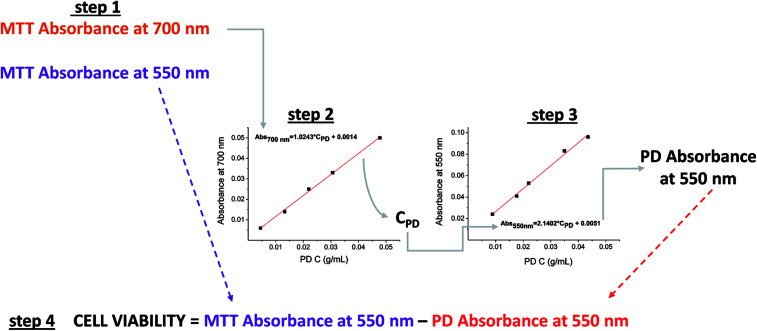
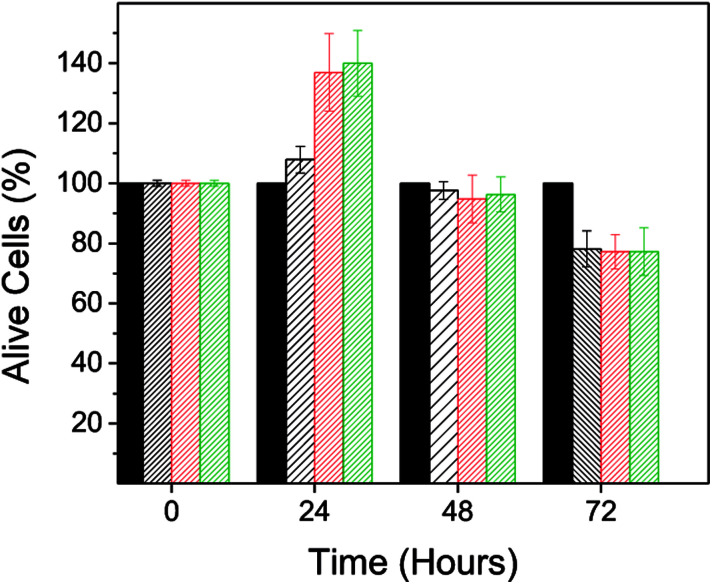
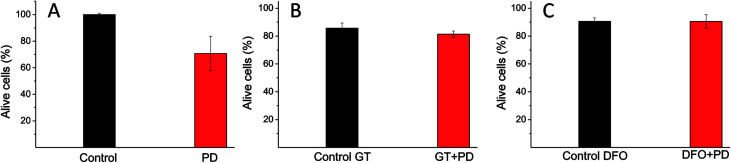
Polydopamine (PD) is a synthetic melanin analogue of growing importance in the field of biomedicine, especially with respect to cancer research, due, in part, to its biocompatibility. But little is known about the cytotoxic effects of PD on cancer cell lines. PD is a UV-vis absorbing material whose absorbance overlaps with that of formazan salts, which are used to assess cell viability in MTT assays. In this study, a protocol has been established to eliminate the contributing absorbance of PD at 550 nm, and has been applied to characterize the cytotoxicity of PD nanoparticles in both healthy and breast cancer cell lines. Once the protocol is applied, it was found that PD is per se an antineoplastic system, meaning it selectively kills cancer cells, especially those of breast cancer, but it has no toxic effect on healthy cells. The mechanism of action could be related to the production of ROS and the alteration of iron homeostasis in lysosomes. To the best of our knowledge there are only a few examples of nanoparticle systems devoid of drugs that selectively kill cancer cells.


Conflict of interest statement

The authors declare no conflict of interests.

Figures

Fig. 1
Fig. 1. (A) TEM image of PD nanoparticles. (B) Histogram of the size distribution obtained by measurement of ca. 100 particles of different TEM images. (C) Intensity-averaged size distribution of PD dispersed in deionized water (pH = 7).
Fig. 2
Fig. 2. (A) Normalized UV-vis absorption spectra (at 280 nm) of PD (black line) and the MTT reagent (purple line). (B) UV-vis absorption spectrum of PD at different PD concentrations. (C) The effect of PD concentrations, in range of 0.001–0.032 mg mL−1, on the MTT absorption spectrum. (D) Absorbance variations detected at 550 nm as a function of PD concentration for a PD colloidal dispersion (black square) and a solution of the MTT reagent upon the addition of different PD aliquots (purple circle).
Scheme 1
Scheme 1. Illustration of the proposed procedure to eliminate the contributing absorbance of PD at 550 nm, which is directly estimated in the MTT assay. First step: absorbance is measured at 550 and 700 nm. Second step: the absorbance at 700 nm is interpolated in the PD calibration curve (PD absorbance at 700 nm vs. PD concentration) to estimate the PD concentration (CPD) that remains in the well. Third step: CPD is interpolated in the PD calibration curve (PD absorbance at 550 nm vs. PD concentration) to determine the PD absorbance at 550 nm. Fourth step: cell viability can be calculated considering the MTT absorbance at 550 nm that is measured in the first step and the PD absorbance at 550 nm.
Fig. 3
Fig. 3. The viability of the cell line NIH3T3 cultured in different concentrations of PD. Green: 0.02 mg mL−1, blue: 0.050 mg mL−1, red: 0.072 mg mL−1 and black: 0.093 mg mL−1.
Fig. 4
Fig. 4. (A) BT474 cell viability after treatment with different concentrations of PD. Control (black filled column). PD concentration (unfilled column): green: 0.044 mg mL−1, red 0.033 mg mL−1 and black: 0.022 mg mL−1. (B) The viability of HTC116 cells after being cultured with two concentrations of PD: 0.015 mg mL−1 (red) and 0.050 mg mL−1 (blue). The control is represented by the solid black bar.
Fig. 5
Fig. 5. Results without protocol implementation: BT474 cell viability after treatment with different concentrations of PD. Control (black filled column). PD concentration (unfilled column): green: 0.044 mg mL−1, red 0.033 mg mL−1 and black: 0.022 mg mL−1.
Fig. 6
Fig. 6. (A) Bright field image of the BT474 cell line, (B) fluorescent image of the BT474 cell line after co-culturing with fluorescent PD particles (0.05 mg mL−1) for 3 hours, with excitation at 405 nm. The fluorescence is due to the PD particles (C) lysosomes were stained with the Lyso Tracker red DND 99 marker, the excitation is at 570 nm and fluorescence is due to the lysosome marker (D) image after merging (A–C) images.
Fig. 7
Fig. 7. The viability of BT474 cells after a 24 hours treatment for the following conditions: (A) without (black bar) and with PD particles at 0.033 mg mL−1 (red bar); (B) reduced GT at a concentration of 50 μM (black bar) and the combination of GT (50 μM) with PD particles (0.033 mg mL−1) (red bar). (C) DFO at a concentration of 0.7 μM (black bar) and the combination of DFO (0.7 μM) with PD particles (0.0033 mg mL−1) (red bar).

References

    1. Meredith P. Sarna T. Pigm. Cell Res. 2006;19:572–594. doi: 10.1111/j.1600-0749.2006.00345.x. - DOI - PubMed
    1. d'Ischia M. Napolitano A. Ball V. Chen C.-T. Buehler M. J. Acc. Chem. Res. 2014;47:3541–3550. doi: 10.1021/ar500273y. - DOI - PubMed
    1. Liu Y. Ai K. Liu J. Deng M. He Y. Lu L. Adv. Mater. 2013;25:1353–1359. doi: 10.1002/adma.201204683. - DOI - PubMed
    1. Meredith P. Riesz J. Photochem. Photobiol. 2004;79:211–216. doi: 10.1562/0031-8655(2004)079<0211:RCRQYF>2.0.CO;2. - DOI - PubMed
    1. Lee H. Rho J. Messersmith P. B. Adv. Mater. 2009;21:431–434. doi: 10.1002/adma.200801222. - DOI - PMC - PubMed