. 2016 Jun;3(3):703-715.
doi: 10.15761/imm.1000228. Epub 2016 Jun 25.

Trophic factors intervention regenerates the nestin-expressing cell population in a model of perinatal excitotoxicity: Implications for perinatal brain injury and prematurity

Affiliations

Trophic factors intervention regenerates the nestin-expressing cell population in a model of perinatal excitotoxicity: Implications for perinatal brain injury and prematurity

A Espinosa-Jeffrey et al. Integr Mol Med. 2016 Jun.

Abstract

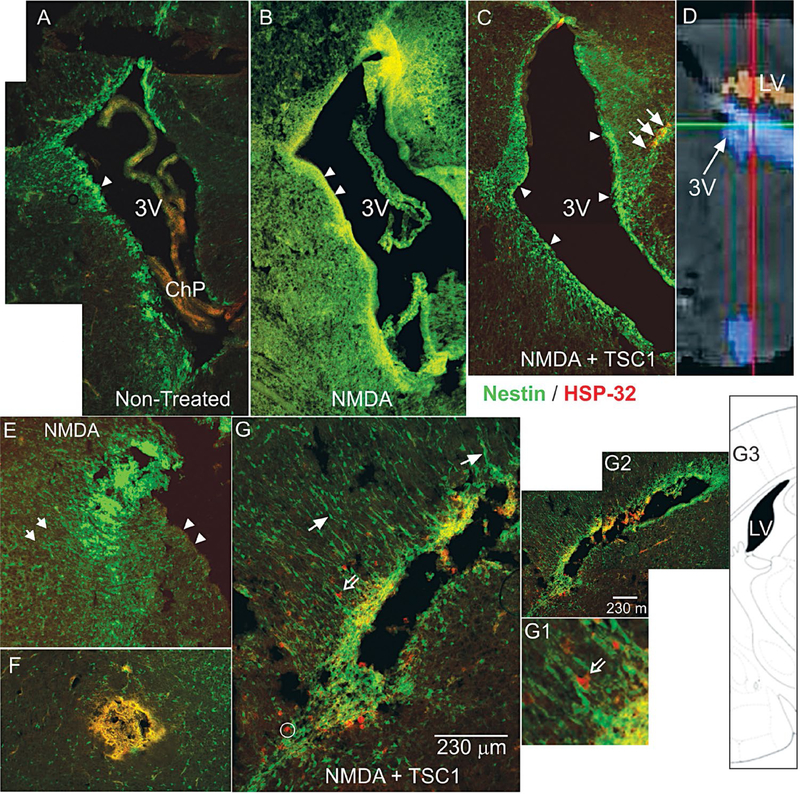
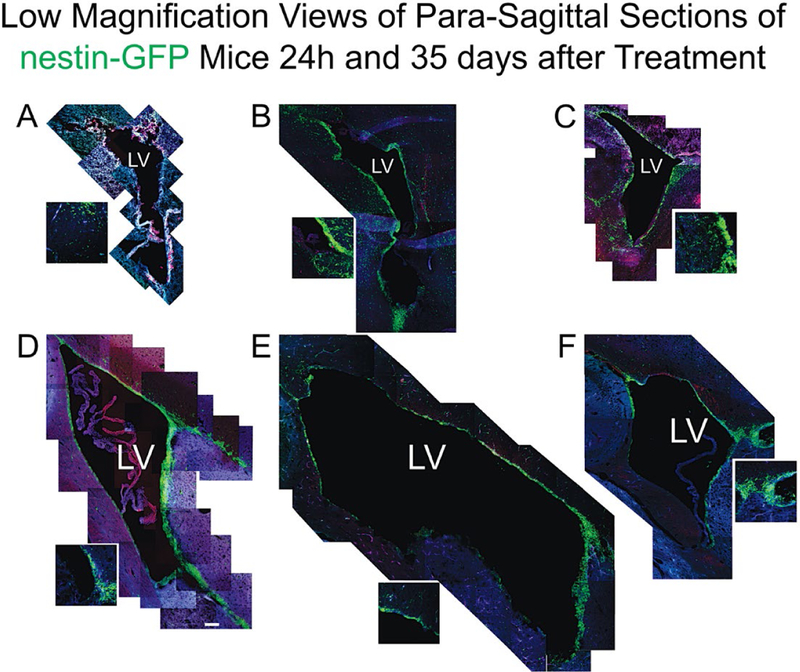
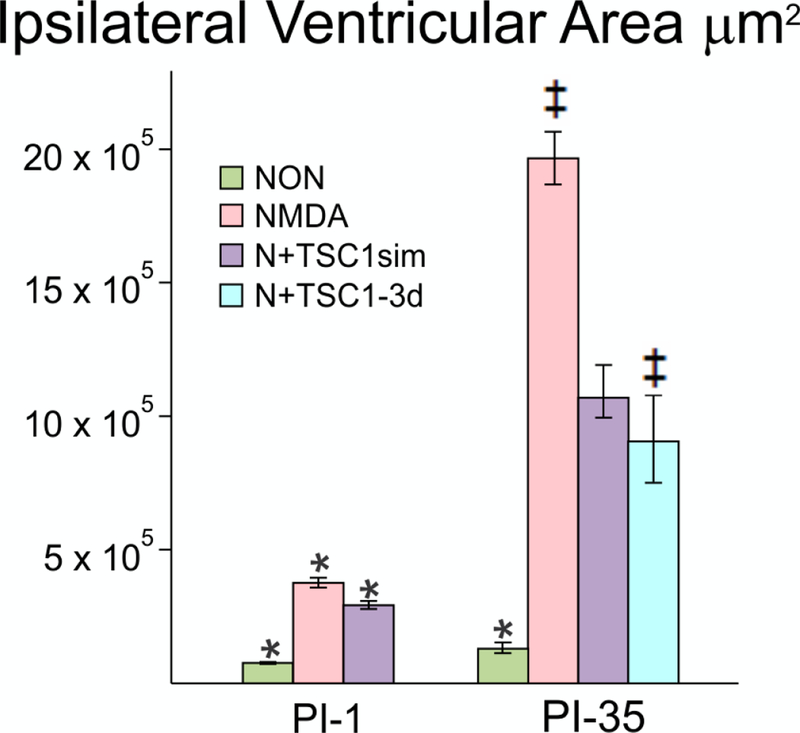
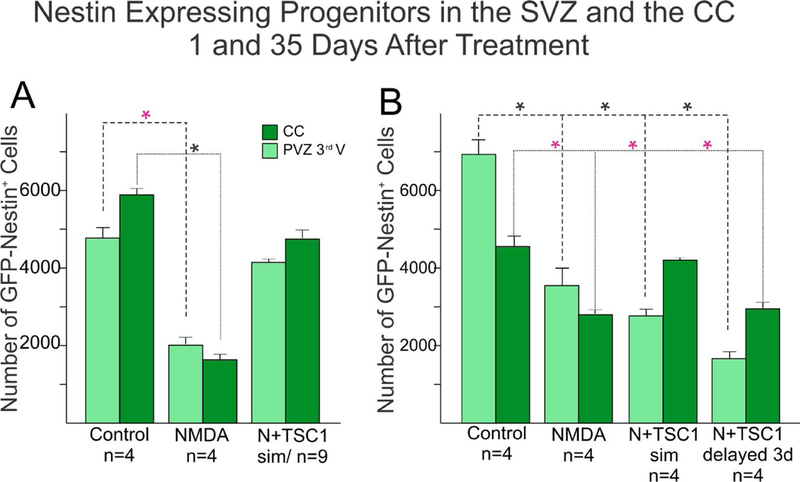
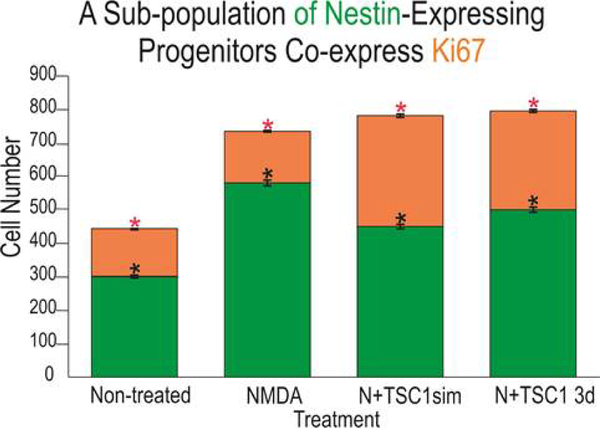
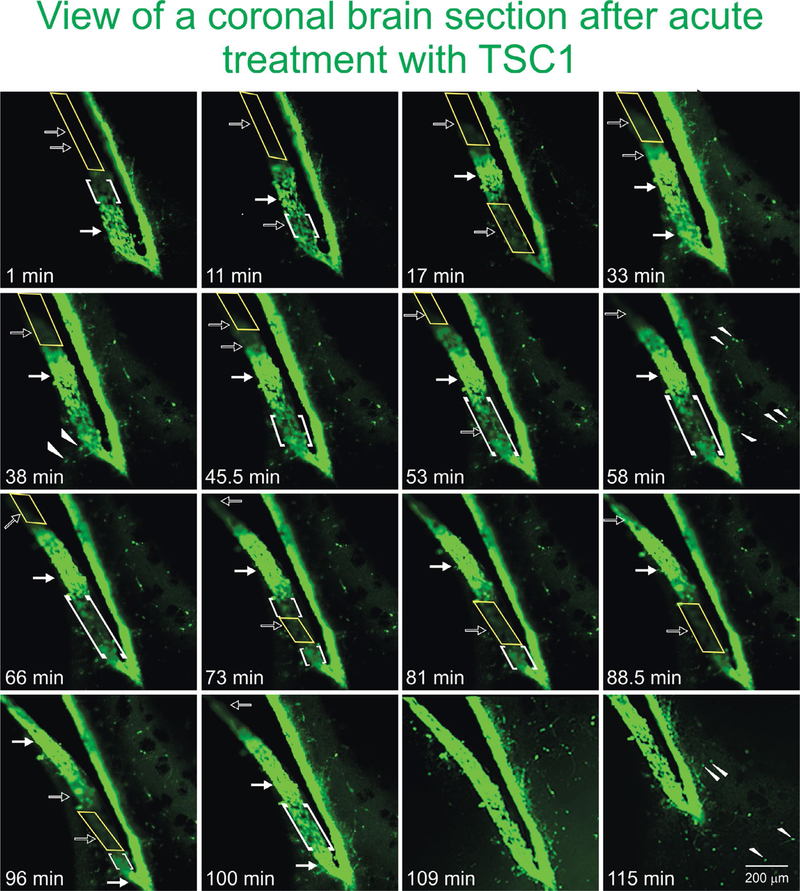
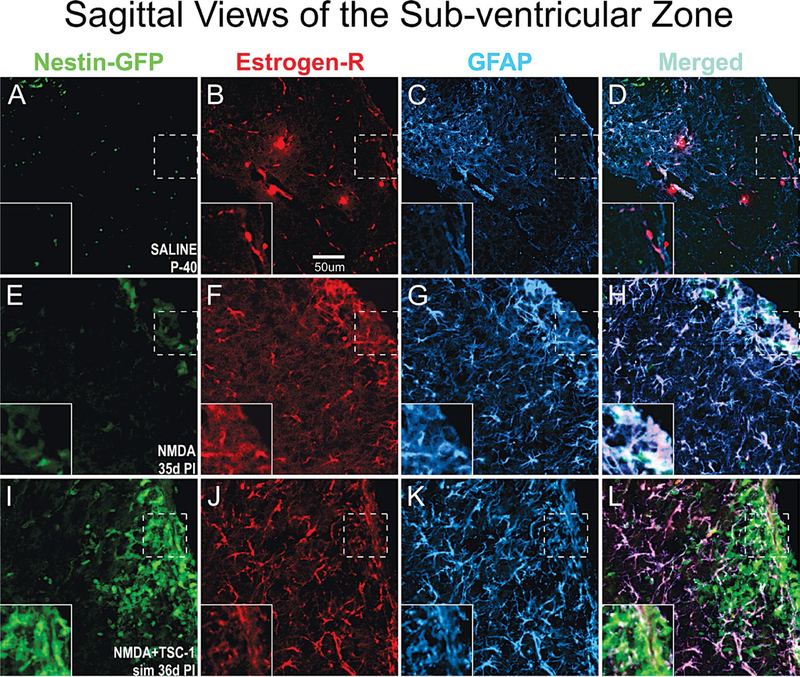
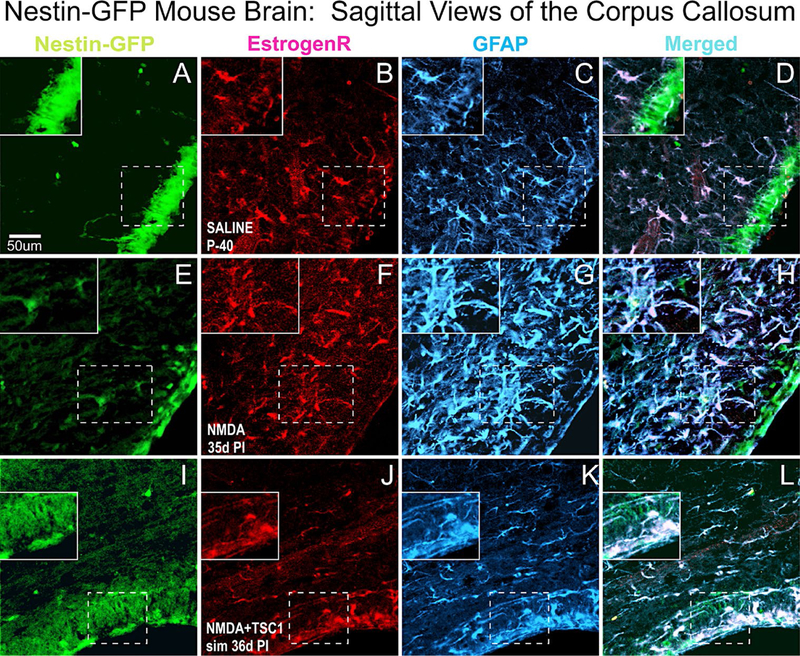
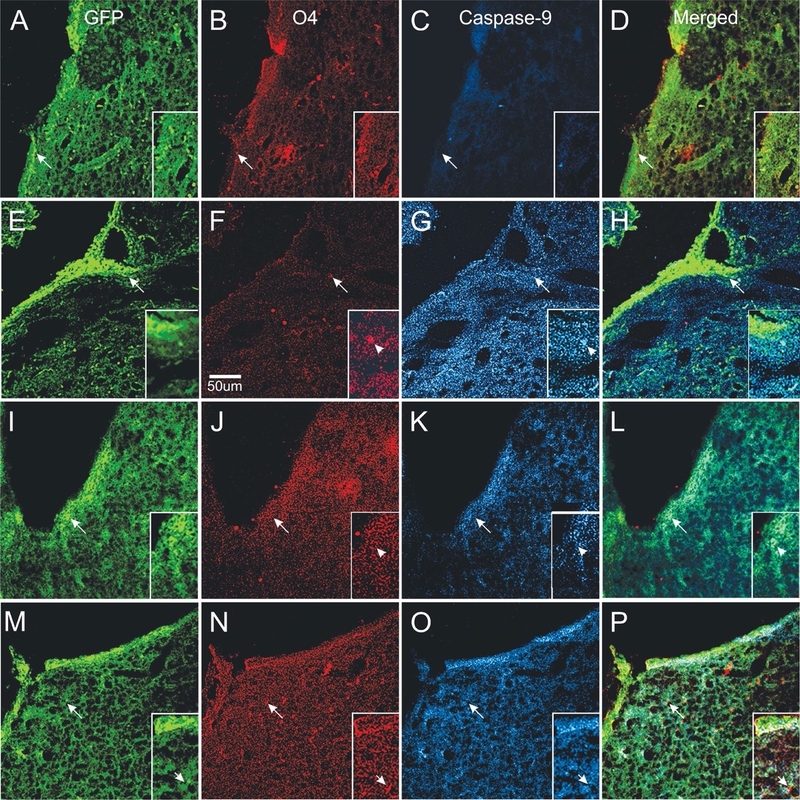
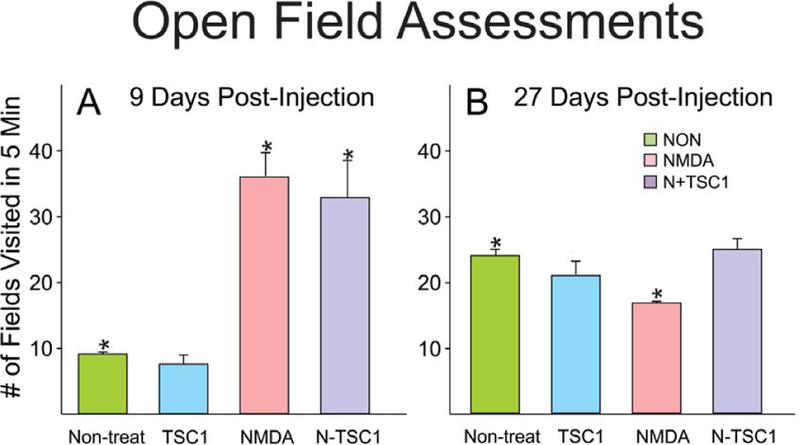
We previously showed that TSC1 (a combination of transferrin and IGF-1) is a potent inductor of myelinogenesis in myelin deficient rats and in demyelinated adult mice. More recently, we demonstrated that regeneration of oligodendrocyte progenitors and myelin are possible with a single dose of TSC1 in a mouse model of Premature birth. Here, using the same mouse model of perinatal white matter damage due to glutamate excitotoxicity (GME), we tested the hypothesis that regeneration of endogenous nestin-expressing neural progenitors improves the outcome of prematurity. Treatments: N-methyl-D-aspartate (NMDA), saline, NMDA+TSC1 together or NMDA followed byTSC1 3 days later, were stereotaxically delivered into the corpus callosum of P4 mouse pups. Fluorescence analysis showed an intense enrichment of nestin-expressing cells in groups injected with NMDA+TSC1 from which many were generated by proliferation. Moreover, when TSC1 was injected three days after the primary insult it was still able to reduce ventricular enlargement and extensively rescue nestin-expressing progenitors. Cells co-expressing the proliferation marker Ki67, CNPase and faint nestin label were more abundant in groups injected with MNDA+TSC1 at 35 days after injection. Stereological analysis showed that the number of nestin-expressing cells in the sub-ventricular zone correlated inversely with the volume of the ventricle. A delayed administration of TSC1 after excitotoxicity reduced ventriculomegaly but not as much as, when NMDA and TSC1 were injected simultaneously. Thus, the earliest TSC1 was administered, the more tissue was rescued as shown by reduced ventriculomegaly. Astrocytes responded to GME by upregulating the expression of estrogen receptor and this expression was attenuated in the presence of TSC1 suggesting a decreased inflammation and a lesser need for estrogen-mediated central nervous system (CNS) neuroprotection.

Keywords: PVL; excitotoxicity; myelination; oligodendrocyte; transferrin/IGF-1.


Conflict of interest statement

Competing interests Financial support for this work was proved in part by the National Multiple Sclerosis Society PP1498; NICHD Intellectual and Development Disabilities Research HD-04612. All other authors declare no competing interests

Figures

Figure 1.
Figure 1.. Low magnification views of para-sagittal (A-C/24h PI) and coronal (D,D1, D2 24h PI) brain sections from nestin-GFP mice immunostained for HSP-32.
A) Non-treated animals at 6 days of age. The wall of the third ventricle and subventricular (SVZ) regions display migratory nestin-expressing cells (arrowheads) and an absence for HSP-32. B) The brain of an animal treated with NMDA at P5 and analyzed at P6 shows large cyst consisting of nestin positive and HSP-32 negative cells. Moreover, the wall of the third ventricle (arrowheads) as well as the SVZ appear to have lost the nestin expression. C) The brain of an animal treated with NMDA+TSC1 at P5 and analyzed at P6 displays an intact ventricular wall (arrowheads), and a thicker SVZ in all areas. More nestin positive cells appear to migrate towards the parenchyma with a few co-expressing HSP-32 (arrows) versus non-treated animals. D) Diagramatic view of the 3rd ventricle of the mouse brain. E) View of another animal 24 hours after NMDA injection, where the wall of the ventricle was deprived of nestin positive cells (arrowheads). Clustered nestin-expressing cells accumulated near the ventricle (arrow). Only single scattered nestin-expressing cells were seen in the vicinity. F) In the brain parenchyma a cyst had formed from cells that appeared to co-express nestin and HSP-32 giving an orange color. The parenchyma had nestin-expressing cells that appeared to be organized in a concentric pattern with respect to the cyst. These clustered cells might tend to disappear with time. G) Coronal view of a mouse treated with NMDA+TSC1 where there were numerous “radial glia-like” nestin positive cells with long processes oriented perpendicular to the wall of the ventricle (solid arrows) and along these fibers nestin-negative/HSP-32 positive cells appeared to migrate (open arrows, (G1insert). G2). Low magnification view of the same ventricle showing extensive nestin expression. G3) Diagramatic representation of a coronal view of the mouse brain showing the lateral ventricle (Figure 1E).
Figure 2.
Figure 2.. Low magnification views of para-sagittal sections of nestin-GFP transgenic mice24 hours after Treatment. Sections were immunolabeled forKi67 and CNPase.
A) Non-treated animal 6 days of age or D) non-treated mouse 35 days of age. B) Twenty-four hours after NMDA injection the ventricle of mice injected with NMDA was already visibly enlarged with respect to non-treated animals and those that received the NMDA+TSC1 combination. The wall of the ventricle and subventricular regions displayed nestin+, Ki67+ and CNP+ cells. In many cases nestin was co-expressed with Ki67 (yellow cells) indicating that they were originated via cell proliferation (insert). D) View of a non-treated mouse thirty nine days of age where the inner portion of the ventricle had just a few nestin+ cells scattered along the wall of the ventricle and those from the SVZ had migrated away from this region. The outer portion of the ventricle was still thick but almost no nestin positive cells were seen beyond the SVZ. E) At this time point NMDA injected mice had a very large ventricle where the inner portion of the wall had very few nestin positive faintly labeled cells. Almost no cell expressed Ki67 nor CNPase in this region. F) The ventricle of mice treated with NMDA+TSC1 was much smaller than in mice without TSC1 treatment. The outer portion of the ventricle still displayed nestin+ cells and some appeared to migrate from the SVZ to the parenchyma. Many of these cells (co-expressed Ki 67 (insert). Cells expressing ki67 alone were not present in the vicinity of the ventricle at this time point suggesting that they may have had migrated.
Figure 3.
Figure 3.. The enlargement of the Ipsilateral ventricle was differentially impacted across treatments.
Using stereology we next measured the ipsilateral portion of the 3rd ventricle starting from the midline. This morphometric analysis differs from the above measurements in that here only the ipsilateral portion of the ventricle was measured and compared across treatments at a given time point as opposed to the comparison of the area of the lateral ventricle in the injected hemisphere versus the non-injected (contralateral) one in the same brain section: NMDA alone (pink bars); NMDA+TSC1 injected simultaneously (purple bars) and NMDA followed by delayed treatment of TSC1 (turquoise bar). The third ventricle suffered a dramatic tissue loss as a function of time in mice injected with NMDA alone. Thirty-five days after the simultaneous injection of NMDA + TSC1 the enlargement of the third ventricle was visible but it was around 8 times larger than in the non-treated mice. The same was true for mice receiving the delayed injection where the ventricular size was around 50% smaller than in mice injected with NMDA alone. In the PI-1 group, the differences across treatments were statistical significant. In the PI-35 group mice treated with TSC1 simultaneously and those that received TSC1 3 days after NMDA the differences were not significant suggesting that treatment with TSC1 even three days after excitotoxicity brain tissue will be spared; while with respect to NMDA alone cell numbers were significant. Values are expressed as mean ± SEM; *p<0.05, p<0.01 comparison versus their respective control.
Figure 4.
Figure 4.. Comparison of the total number of Nestin-GFP expressing progenitors in the SVZ of the third ventricle and the CC.
Sagittal sections were examined, nestin-expressing progenitors were counted using the Optical Fractionator Probe (mbf) and the 63X oil objective. A) The total number of nestin-expressing progenitors was extremely reduced in NMDA injected mice as early as 1 day after GME with more cells left in the SVZ than those that migrated to the CC. Mice that received the injection of NMDA + TSC1 simultaneously showed a 25% nestin-expressing cell loss as opposed to almost 66% reduction found in mice injected with NMDA alone. The differences were significant between saline and NMDA injected mice and non-significant between saline or untreated controls, and N + TSC1 mice indicating that the number of nestin-expressing cells both in the SVZ and CC was considerably close to controls when compared to mice injected with NMDA alone. Significance for the SVZ(*P)<0.05, and for the CC (*P)<0.05 versus their respective control. B) Thirty-five days after injection there were still more nestin-expressing cells in mice receiving saline injections than in those injected with NMDA in the presence or absence of TSC1; with NMDA alone there was a reduced loss of the total number of nestin-expressing cells from 66% to 45%. At this time point NMDA+TSC1 injected simultaneously reflected a total reduction of 39% nestin-expressing cells. A more pronounced reduction was seen when TSC1 injection was delayed 3 days after NMDA administration. Nonetheless, more cells had migrated to the CC than in NMDA injected mice. Bars represent the means ± SE for each group.*P<0.05 versus respective control. The difference in cell numbers found in the CC between N+TSC1sim and N + TSC1 administered 3 days later, was significant (*P<0.01), suggesting that the sooner we inject TSC1, the more nestin-expressing cells will be spared.
Figure 5.
Figure 5.. The subventricular zone regenerates via proliferation of a sub-population of nestin-expressing progenitors as well as via direct mobilization of quiescent nestin-expressing cells.
Seven days post-injection (PI) ten fields were selected around the SVZ of the third ventricle in the ipsilateral hemisphere in sagittal sections. First, only cells expressing nestin-GFP were counted (green portion of the bars), these cells were negative for the proliferation marker Ki67. Values are expressed as mean ± SEM; *p<0.01 across treatments versus control. Interestingly, in mice treated with NMDA followed by a 3-day delayed TSC1 injection, the total number of nestin positive cells was slightly but significantly greater than in NMDA treated mice. The number of nestin+ cells in each experimental condition was compared with that of the non-treated mice. The co-expression of Ki67 and nestin in the SVZ (orange portion of the bars) was also assessed by counting double labeled cells in the same ten fields around the SVZ. The total number of nestin-expressing cells in the control group was lower than in the brain of treated groups. Approximately, one third of these cells co-expressed nestin and Ki67. NMDA treated mice also showed new nestin-expressing cells generated via cell proliferation as assessed by ki67 expression. A striking finding was that in mice that received NMDA +TSC1 either simultaneously or three days after NMDA administration, twice as many nestin-expressing cells had formed via cell proliferation with respect to the control group. In the N+TSC1 injected simultaneously the total number of nestin-expressing cells was almost doubled from which nearly 50% were new progenitors generated via cell proliferation. In the case where NMDA was injected and TSC1 treatment was administered 3 days later, the number of non-proliferative nestin positive cells was slightly larger while those generated via proliferation amounted to around 40%. Values are expressed as mean ± SEM; *p<0.01 across treatments versus control (non-treated).
Figure 6.
Figure 6.. TSC1 elicits the “awakening” of nestin-expressing cells in the SVZ of the lateral ventricle.
To assess the ‘awakening” and migration of NSC, we used fresh 300 μm thickness brain slices from the nestin-green fluorescent protein (GFP) mouse at 7 months of age to be able to distinguish di novo GFP-nestin expression. Views of the lateral ventricle from a coronal brain section treated with TSC1 show a single plane of focus during 115 min. Note a pronounced thickening of the ventricular wall and the subventricular region within minutes of exposure to TSC1. We observed a dynamic behavior of GFP-nestin-expressing cells. Some regions that were negative (yellow rectangles), became intensely labeled for nestin-GFP at time 1 min post treatment, gradually becoming visible starting at 11 min (open arrows) and continued showing the 100% of the SVZ light by intense GFP fluorescence by min 109 (1h 49 min, solid arrows). At the same time, zones of the SVZ that expressed intense to moderate green fluorescence at time 0 became gradually negative until no GFP was detected by minute 88 (1h 28 min). Interestingly, the same region started to light up again by min 100 and became intensely labeled 9 min later, time at which the full view of the lateral ventricle was GFP positive. Concomitant to the development of these phenomena, single bipolar cells were seen to migrate from the SVZ into the adjacent parenchyma (arrowheads). Initially, just a few cells were visible but with time rows of cells perpendicular to the SVZ were observed (small arrows). Note that 11 minutes after addition of TSC1, a nestin negative area became positive while the opposite occurred below that region. After 17 min the same area had turned off and turned green again by 33 min after TSC1 was added to the tissue slice. Starting at 17 min green cells appeared to have moved beyond the SVZ into the brain parenchyma. This region of the SVZ was the most active as it went gradually on (at 33 and 100 min) and off (at 17 and 73min). The complete SVZ became nestin-GFP positive at 109 min. Migrating cells had increased in number with time and of the SVZ took place during the first 33 min.
Figure 7.
Figure 7.. In the SVZ Estrogen-R shifts localization from the vasculature to astrocytes upon GME.
Double immunofluorescence for estrogen receptor alpha (Estrogen-Rα) and glial fibrillary acidic protein (GFAP). A-D Saline treated mice at P40 the estrogen-Rα was present only in blood vessels but not in astrocytes. In contrast, in NMDA recipients 35d PI (d = days; PI = post injection) estrogen R colocalized with GFAP mainly in the cell body of astrocytes and it was also intensely expressed in blood vessels. Astrocytes were reactive as they were enlarged and fibrous with prominent processes strongly expressing GFAP (E-H). Interestingly, in NMDA+TSC-1 treated mice (I,J,K,L) most but not all astrocytes were still enlarged and their cell body prominently labeled with GFAP. Other astrocytes showed smaller body and processes, they seemed non-reactive and in smaller numbers only a few astrocytes co-expressed ER-α. The label was diffusely distributed along fibers rather than in the astrocytes cell bodies. Estrogen-R was not expressed by nestin-GFP progenitors (inserts).
Figure 8.
Figure 8.. Sagittal Views of the Corpus Callosum.
Double immunofluorescence for estrogen receptor (ER-α) and glial fibrillary acidic protein (GFAP). The corpus callosum (CC) showed that in non-treated animals (A-D) ER-α was present mainly in blood vessels and in a few astrocytes. In contrast, in NMDA injected mice (E-F) ER-α colocalized with GFAP mainly in the cell body and it was intensely expressed in blood vessels as well. Astrocytes were reactive, they were intensely labeled and with a fibrous aspect. Interestingly, in NMDA+TSC-1 treated mice (H,I,J,K), the astrocytes seemed non-reactive, they were less numerous and their cell bodies were small as well as their GFAP labeled cell processes and they were present in smaller numbers and only a few of them co-expressed ERα. The ERα was almost not seen in blood vessels and those that expressed displayed a diffusely distributed ERα and GFAP along their fibers rather than in their cell bodies. ERα was not expressed by nestin-GFP progenitors. Inserts show the absence of ERα label in nestin-expressing cells adjacent to those GFAP/ERα co-labeled cells.
Figure 9.
Figure 9.. Differential neuroprotection produced by TSC1 administered during or after excitotoxicity.
Control mice injected with saline (A–D). A). Several nestin positive cells were located in SVZ and in some areas of the ventricular wall. B) O4 expressing cells were also present in the SVZ and the adjacent parenchyma. C) Caspase 9 was not expressed in saline injected mice. D) Merged views of the three markers. Mice treated with NMDA alone (E–H) showed intensely nestin labeled progenitors at the wall of the ventricle (E) =creo que no debe llevar el parenthesis izquierdo esta E=almost none in the SVZ and numerous single cells in the neighboring parenchyma. F) Very few O4 positive cells could be observed with hairy cell processes. G) These O4 positive cells co-expressed caspase 9. Single cells with fewer processes were also seen. In addition, the full area surrounding the lateral ventricle of the injected hemisphere showed caspase intense staining as “puncta”. These puncta seemed to be predominant in comparison to the extent of O4 labeled puncta. H) Very few nestin positive cells co-expressed caspase 9. When NMDA was injected simultaneously with TSC1 (I–L), nestin-labeled cells were seen across the wall of the ventricle, SVZ and adjacent parenchyma (I). There was much more O4 expressed in small size OLPs; some could be seen as bipolar cells with long processes than in mice injected with NMDA alone. More O4 labeled puncta were observed (J). In these mice, some but not all, nestin-expressing cells co-expressed caspase 9 (L). The delayed administration of TSC1 3 days after NMDA injection resulted in a spongy-like tissue M–P). Nonetheless, both the expression of nestin (M) and O4 (N) were preserved and O4 positive cells were negative for caspase 9 (O). It also appeared as if caspase 9 was labeling cells other than nestin-expressing and O4 labeled cells, in which cases caspase 9 seemed to label flatter cells (O).
Figure 10.
Figure 10.. NMDA induced hyperactive behavior at early time points.
Initially, non-treated mice and those that received TSC1 injection 9 days earlier had comparable behavior and the small differences were not significant. In contrast, animals injected with NMDA alone or NMDA + TSC1 were characterized by hyperactivity and the difference was significant with respect to control (non-treated) mice). Twenty-seven days after treatment, the behavior of all groups was similar yet the difference was significant for NMDA-treated mice when comparing it to that of non-treated mice. In contrast, the behavior of mice in groups non-treated, TSC1 and N-TSC1 was equivalent and the differences were nonsignificant anymore.

Similar articles

Cited by

References

    1. Behrman RE, Butler AS (2007) “Preterm Birth Causes, Consequences, and Prevention.” The National Academies. - PubMed
    1. Holsti L, Grunau RV, Whitfield MF (2002) Developmental coordination disorder in extremely low birth weight children at nine years. J Dev Behav Pediatr 23: 9–15. - PubMed
    1. Woodward LJ, Edgin JO, Thompson D, Inder TE (2005) Object working memory deficits predicted by early brain injury and development in the preterm infant. Brain J Neurol 101: 2578–2587. - PubMed
    1. Volpe JJ (2005) Encephalopathy of Prematurity Includes Neuronal Abnormalities. Pediatrics 116: 221–225. - PubMed
    1. Lindquist S (1986) The heat-shock response. Annu Rev Biochem 55: 1151–1191. - PubMed

LinkOut - more resources