. 2022 Apr 26:16:878046.
doi: 10.3389/fncir.2022.878046. eCollection 2022.

Hippocampus Maintains a Coherent Map Under Reward Feature-Landmark Cue Conflict

Affiliations

Hippocampus Maintains a Coherent Map Under Reward Feature-Landmark Cue Conflict

Indrajith R Nair et al. Front Neural Circuits. .

Abstract

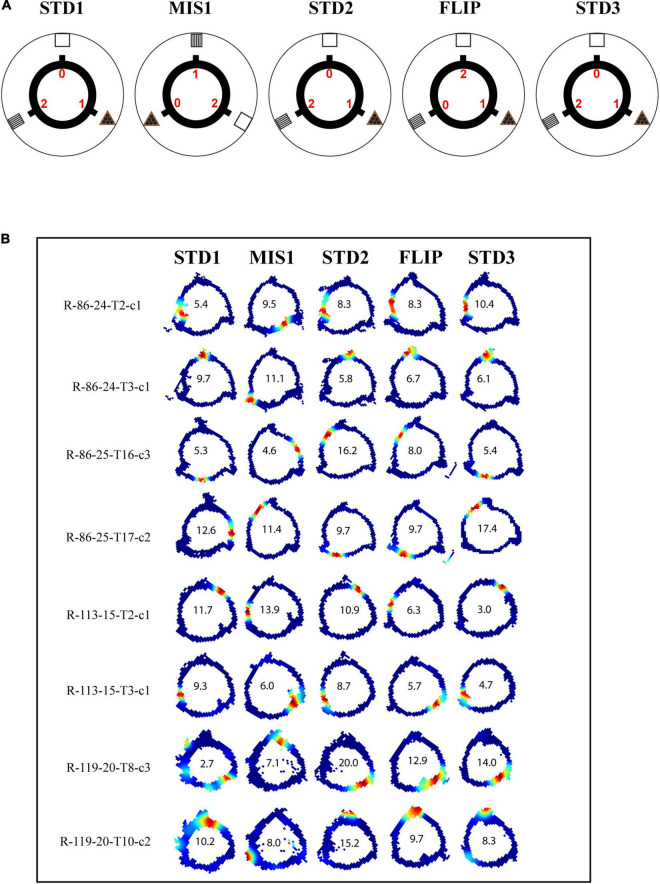
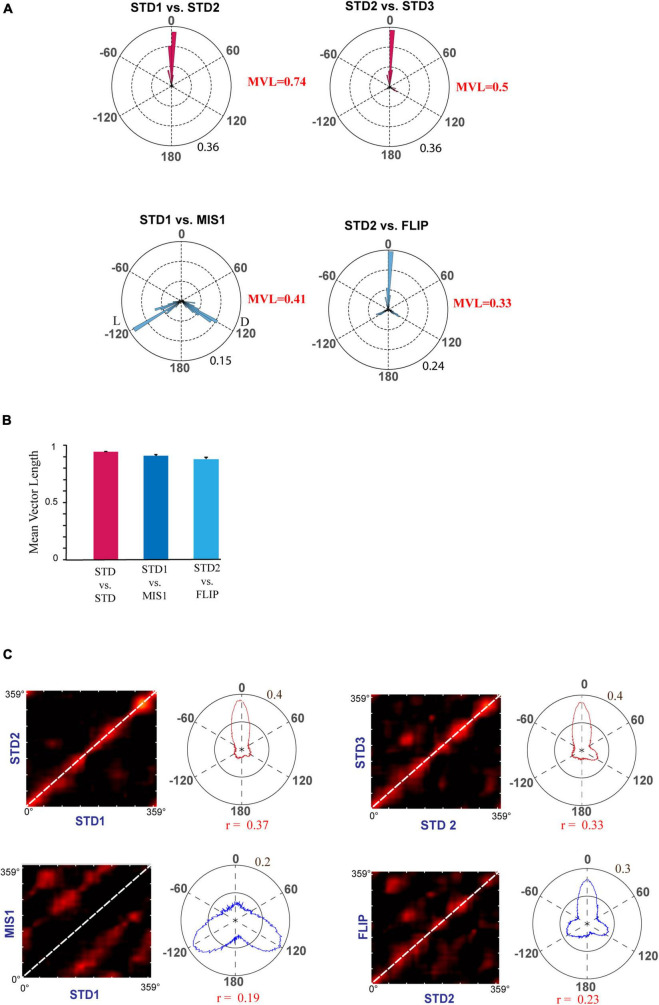
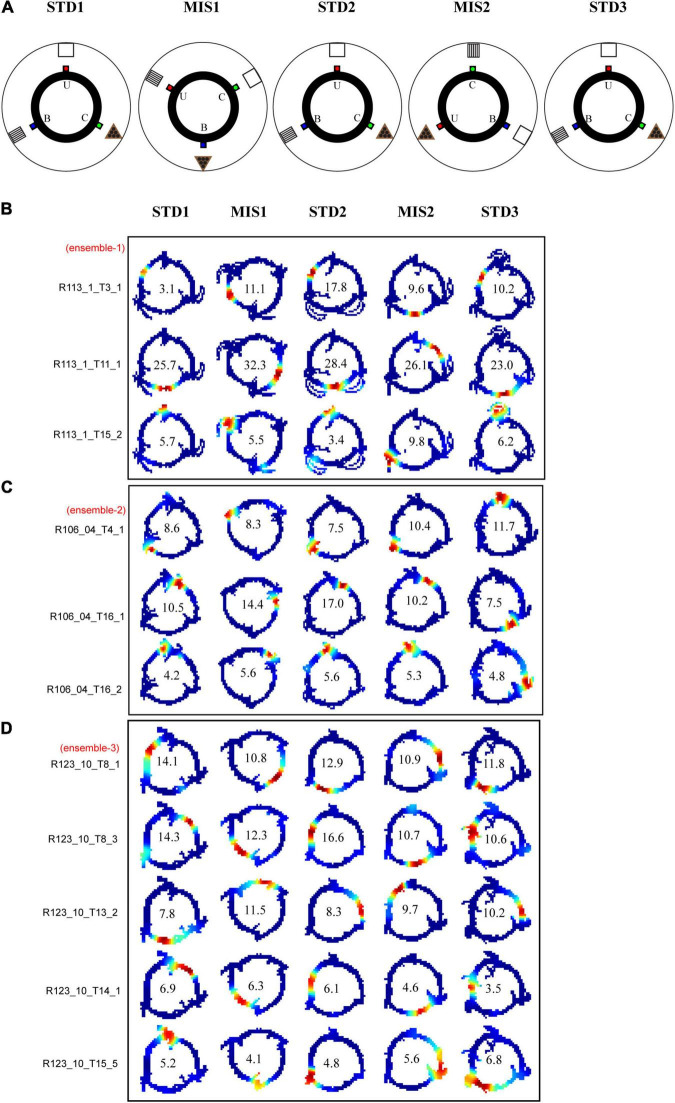
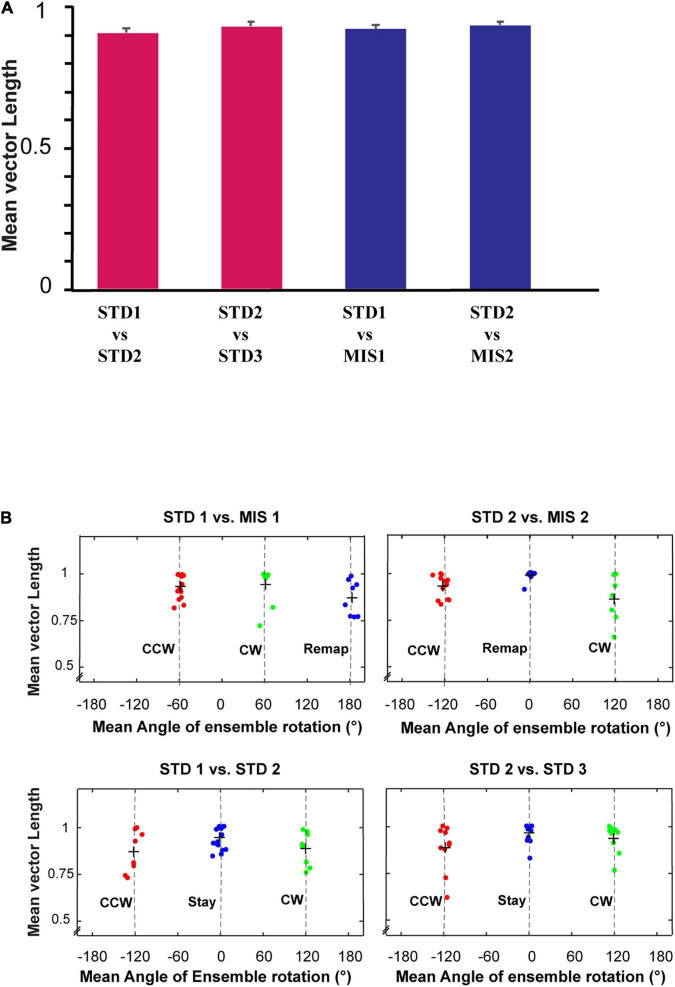
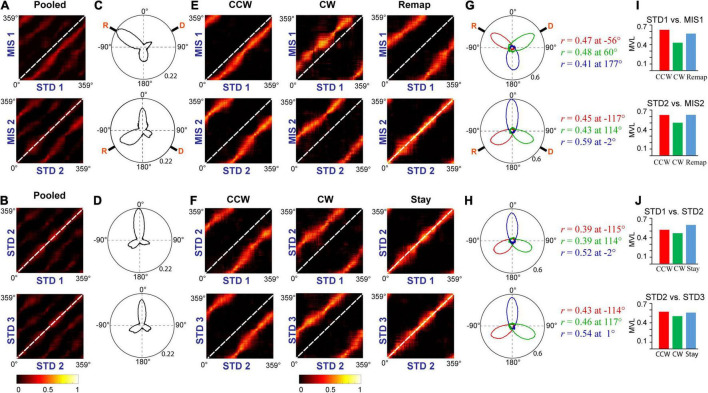
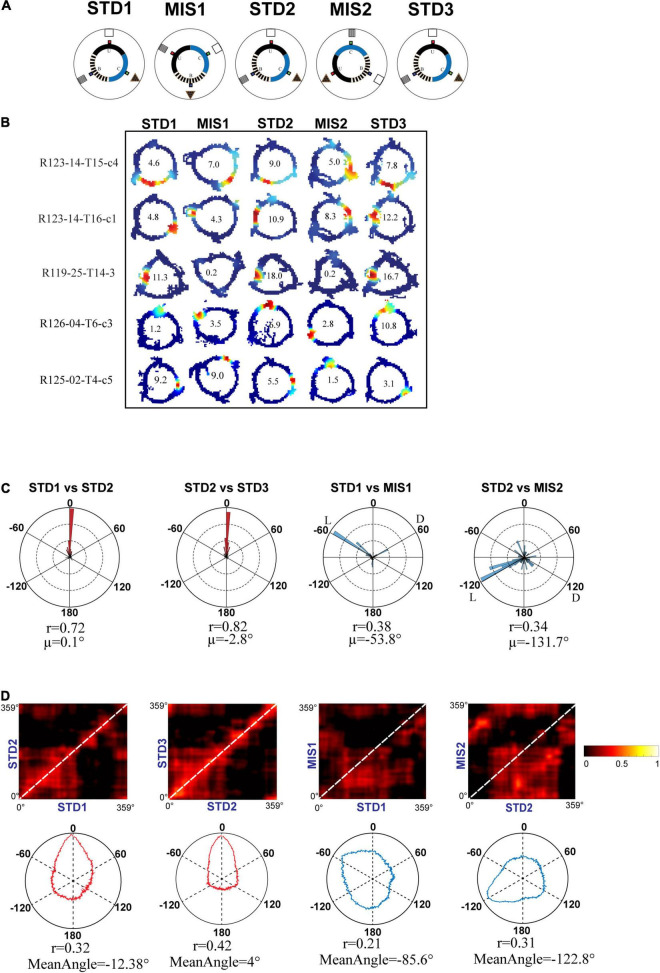
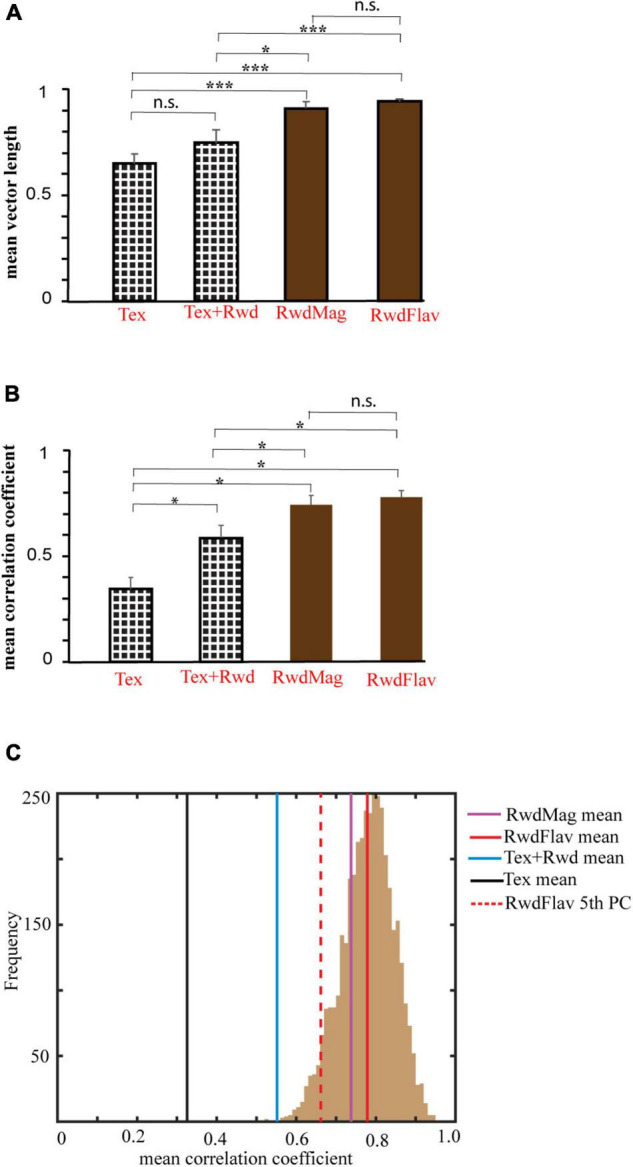
Animals predominantly use salient visual cues (landmarks) for efficient navigation. When the relative position of the visual cues is altered, the hippocampal population exhibits heterogeneous responses and constructs context-specific spatial maps. Another critical factor that can strongly modulate spatial representation is the presence of reward. Reward features can drive behavior and are known to bias spatial attention. However, it is unclear whether reward features are used for spatial reference in the presence of distal cues and how the hippocampus population dynamics changes when the association between reward features and distal cues is altered. We systematically investigated these questions by recording place cells from the CA1 in different sets of experiments while the rats ran in an environment with the conflicting association between reward features and distal cues. We report that, when rewards features were only used as local cues, the hippocampal place fields exhibited coherent and dynamical orientation across sessions, suggesting the use of a single coherent spatial map. We found that place cells maintained their spatial offset in the cue conflict conditions, thus showing a robust spatial coupling featuring an attractor-like property in the CA1. These results indicate that reward features may control the place field orientation but may not cause sufficient input difference to create context-specific spatial maps in the CA1.

Keywords: attention; cue conflict; place cells; reward; tetrode.


Conflict of interest statement

The authors declare that the research was conducted in the absence of any commercial or financial relationships that could be construed as a potential conflict of interest.

Figures

FIGURE 1
FIGURE 1
Tetrode localization in CA1. Representative examples of Nissl-stained coronal sections from four different rats, showing tetrode tracks (indicated by red arrows) in the CA1 region of the hippocampus (Scale bar = 1 mm).
FIGURE 2
FIGURE 2
Schematic representation of the double rotation experiments with a textured track as a local cue (Tex). (A) The schematic representation of the Tex double-rotation paradigm. In this paradigm, the reward was provided at random locations on the textured track. (B) Representative place fields from five sessions showing heterogeneous representation. The number inside the firing rate maps indicates the peak firing rate [in Hertz (Hz)]. The rate maps are color coded, with red color denoted by >90% of the peak firing rate; no firing is indicated by blue, and successive gradients in the firing rates are shown with intervening colors in the spectrum. Clusters R-33-D1-T3-c1 and R-33-D1-T14-c2 are co-recorded neurons orienting to distal and local cues, respectively, demonstrating heterogeneous response from CA1. Clusters R-A16-D3-T6-c5 and R-58-D5-T9-c2 show the place field that did not fire in all sessions. Cluster R-A16-D1-T11-c2 shows remapping of place cells. (C) Circular histogram shows place field rotation across different standards and mismatch comparisons. L and D indicate the rotation of local and distal cues. The mean vector length (MVL) and mean direction (μ) of comparisons are shown alongside the plot. The numbers in brown indicate the maximum proportion of place fields (an outer circle).
FIGURE 3
FIGURE 3
Schematic representation of the double rotation experiments with a textured track and reward as local cues (Tex + Rwd). (A) The schematic representation of a double-rotation paradigm in which reward was provided at a particular location on the textured track. A white dot with the red center indicates the reward location. (B) Representative place fields from different experimental days from five sessions. The numbers inside the firing rate maps indicate the peak firing rate in Hz. The rate maps are color coded as described in Figure 2. (C) Circular histogram shows place field rotation of hippocampal population across different standards and mismatch comparisons. The corresponding mean vector length (MVL) and mean direction (μ) of each comparison are shown alongside the plot. L and D indicate the rotation of local and distal cues.
FIGURE 4
FIGURE 4
Comparison of place field orientation in the Tex and Tex + Rwd paradigm. (A) The stacked histogram of the number of place fields rotated with distal and local cues in STD1 vs. MIS1 comparison in the Tex paradigm with the expected and observed number of place field rotations in the Tex + Rwd paradigm. The number of place fields oriented to distal and local cues in the Tex paradigm is 69 and 32. In the Tex + Rwd paradigm, the observed numbers are 15 (distal) and 56 (local). (B) The stacked histogram of the number of place fields rotated with distal and local cues in STD2 vs. MIS2 comparison in the Tex paradigm with the expected and observed number of place field rotations in the Tex + Rwd paradigm. The number of place fields oriented to distal and local cues in the Tex paradigm is 93 and 43. In the Tex + Rwd paradigm, the observed numbers are 15 (distal) and 39 (local).
FIGURE 5
FIGURE 5
Schematic representation of double rotation experiments with different reward magnitude as local cues (RwdMag). (A) The schematic representation of the RwdMag double-rotation paradigm in which rewards of different magnitude were provided at specific spokes. Colored numbers (0, 1, 2) indicate the number of reward pellets offered at the corresponding spokes. (B) Representative place fields from different experimental days from five sessions. The rate map color coding is the same as described in Figure 2. The number inside the firing rate maps indicates the peak firing rate in Hz.
FIGURE 6
FIGURE 6
Representation of rotational correlation of place field population in the RwdMag experimental paradigm. (A) Circular histogram of rotational correlation of place fields in standard and mismatch/FLIP comparison. Mean vector length (MVL) of each comparison is shown near the corresponding plots. L and D indicate the rotation of local and distal cues. (B) Mean vector length of ensembles comparing STD and mismatch/FLIP comparisons. An error bar indicates the standard error of the mean. (C) Population correlation matrices of standard and mismatch/FLIP comparisons with the polar plot. The diagonal is marked with white-dotted lines. Transformation of the 2D correlation matrix to a 1D polar plot is presented alongside the correlation matrix. Maximum correlation value (r) of the polar plot is shown below the polar plot.
FIGURE 7
FIGURE 7
Schematic representation of double rotation experiments with different reward flavors as local cues (RwdFlav). (A) The schematic representation of the double rotation paradigm using rewards of different flavors as local cues. The blue dot indicates the spoke where banana flavor pellets (B) were provided, the red dot indicates the spoke where sucrose pellets (U) were provided, and the green dot indicates the spoke where chocolate-flavored pellets (C) were provided. (B–D) Representative place fields from different experimental days from five sessions. On the left side, cluster-ID is provided. The number inside the firing rate maps indicates the peak firing rate in Hz.
FIGURE 8
FIGURE 8
Mean vector length distribution and dynamics of place cell orientation. (A) Mean vector length of co-recorded cells (ensemble) in different standard and mismatch comparisons. An error bar indicates the standard error of mean. (B) A scatter plot of the mean direction and mean vector length of all the ensembles across standard and mismatch sessions. Red, green, and blue dots show the clustering of the data points based on k-means elbow method. “+” indicates the centroid of each cluster. In standard vs. mismatch comparisons, the red cluster signifies the ensembles that followed the rotation of CCW reward flavors (CCW), the green cluster signifies the ensembles that followed the rotation of CW distal cues (CW), and the blue cluster signifies the ensembles that rotated away (Remap), not following either reward flavors or distal cues. In standard vs. standard comparisons, the red cluster signifies the ensembles that followed the net CCW rotation (CCW), the green cluster signifies the ensembles that followed the net CW rotation (CW), and the blue cluster signifies the ensembles that showed a stable representation between standard sessions (stable). Gray-dotted line denotes the angle of separation of spokes/cues (120°).
FIGURE 9
FIGURE 9
Population response in the hippocampus. (A,B) Correlation matrices from population firing rate vectors of all the cells pooled from each ensemble at each position on the track between STD vs. MIS (A) and STD vs. STD sessions (B). (C,D) The hippocampal population activity from panels (A,B) is represented as polar plots in panels (C,D), respectively. (E,F) Grouped correlation matrices from population firing rate vectors of all the cells present in each cluster of ensembles at each location on the track between STD vs. MIS (CCW, CW, and Remap) and STD vs. STD sessions (CCW, CW, and Stay). (G,H) The hippocampal population activity of different groups between STD vs. MIS sessions [CCW (red), CW (green), and Remap (blue)] and STD vs. STD sessions [CCW (red), CW (green), and Stay (blue)] are represented as polar plots (constructed from correlation matrices). The values next to the polar plot indicate the angle of peak correlation (r) of the hippocampal population at corresponding groups. (I,J) Length of the mean vector in each group in STD vs. MIS and STD vs. STD sessions for each of the corresponding polar plots is shown in panels (G,H).
FIGURE 10
FIGURE 10
Schematic representation of double rotation experiments with different reward flavors and surface textures as local cues (RwdFlav + Tex). (A) Schematic representation of the reward flavor + texture–a distal cue double-rotation paradigm. The blue dot indicates the spoke where banana flavored-pellets (B) were provided, the red dot indicates the spoke where sucrose pellets (U) were provided, and the green dot indicates the spoke where chocolate-flavored pellets (C) were provided. (B) Representative place fields from different experimental days from five sessions. (C) Circular histogram of place field rotation in standard and mismatch comparisons. L and D indicate the rotation of local and distal cues. (D) Population correlation matrices and the corresponding polar plot of standard and mismatch comparisons.
FIGURE 11
FIGURE 11
Comparison of mean vector length and correlation coefficient across different experiments. (A) Mean vector length of mismatch sessions in different experimental paradigms. The error bar indicates the standard error of the mean. n.s indicates non-significant. * indicates p < 0.02, *** indicates p < 0.001 (Kruskal–Wallis test, Bonferroni corrected). (B) Mean correlation coefficient obtained from a spatial coupling between subsequent sessions in different experimental paradigms. * indicates p < 0.05, n.s. indicates non-significant. (Kruskal–Wallis test, Bonferroni corrected). (C) Histogram of coefficient of correlation calculated by the bootstrap sampling of any random 200 cell pairs between adjacent sessions (1,000 repetitions) in the RwdFlav experiment. The red-dotted line and the solid red line indicate the 5th percentile and the mean of the correlation coefficient obtained (RwdFlav experiments). Mean correlation coefficients of other experiments obtained by bootstrap sampling are also shown. The mean correlation of Tex and Tex + Rwd experiments is lower than the 5th percentile of RwdFlav experiments (p < 0.05).

Similar articles

Cited by

References

    1. Alme C. B., Miao C., Jezek K., Treves A., Moser E. I., Moser M. B. (2014). Place cells in the hippocampus: eleven maps for eleven rooms. Proc. Natl. Acad. Sci. U.S.A. 111 18428–18435. 10.1073/pnas.1421056111 - DOI - PMC - PubMed
    1. Anderson B. A. (2013). A value-driven mechanism of attentional selection stimulus value. J. Vis. 13 1–16. - PMC - PubMed
    1. Aoki Y., Igata H., Ikegaya Y., Sasaki T. (2019). The integration of goal-directed signals onto spatial maps of hippocampal place cells. Cell Rep. 27 1516–1527. 10.1016/j.celrep.2019.04.002 - DOI - PubMed
    1. Barrientos S. A., Tiznado V. (2016). Hippocampal CA1 subregion as a context decoder. J. Neurosci. 36 6602–6604. 10.1523/JNEUROSCI.1107-16.2016 - DOI - PMC - PubMed
    1. Bassett J. P., Wills T. J., Cacucci F. (2018). Self-organized attractor dynamics in the developing head direction circuit. Curr. Biol. 28 609.e–615.e. 10.1016/j.cub.2018.01.010 - DOI - PMC - PubMed

Publication types