. 2022 Apr 26:16:891631.
doi: 10.3389/fncel.2022.891631. eCollection 2022.

Neuroanatomical Basis for the Orexinergic Modulation of Anesthesia Arousal and Pain Control

Affiliations

Neuroanatomical Basis for the Orexinergic Modulation of Anesthesia Arousal and Pain Control

Xuaner Xiang et al. Front Cell Neurosci. .

Abstract

Hypothalamic orexin (hypocretin) neurons play crucial roles in arousal control. Their involvement in anesthesia and analgesia remains to be better understood. In order to enhance our view on the neuroanatomy, we systematically mapped the projections of orexin neurons with confocal microscope and light sheet microscope. We specifically expressed optogenetic opsins tagged with fluorescence markers in orexin neurons through adeno-associated viral infection in the mouse brain. The imaging results revealed fine details and novel features of the orexin projections throughout the brain, particularly related to the nuclei regulating arousal and pain. We then optogenetically activated orexin neurons in the lateral hypothalamus to study the effects on anesthesia-related behaviors. cFos staining showed that optogenetic stimulation can activate orexin neurons in the ChR2-mCherry group, but not the control mCherry group (62.86 ± 3.923% vs. 7.9 ± 2.072%; P < 0.0001). In behavior assays, optogenetic stimulation in the ChR2-mCherry group consistently elicited robust arousal from light isoflurane anesthesia (9.429 ± 3.804 s vs. 238.2 ± 17.42 s; P < 0.0001), shortened the emergence time after deep isoflurane anesthesia (109.5 ± 13.59 s vs. 213.8 ± 21.77 s; P = 0.0023), and increased the paw withdrawal latency in a hotplate test (11.45 ± 1.185 s vs. 8.767 ± 0.7775; P = 0.0317). The structural details of orexin fibers established the neuroanatomic basis for studying the role of orexin in anesthesia and analgesia.

Keywords: analgesia; anesthesia; hypocretin; light sheet microscopy; optogenetics; orexin.


Conflict of interest statement

The authors declare that the research was conducted in the absence of any commercial or financial relationships that could be construed as a potential conflict of interest.

Figures

FIGURE 1
FIGURE 1
Opsin expression in the orexin-Cre mouse brain. (A) Schematic diagrams illustrate AAV virus injections into the orexin-Cre mouse brain. (B) Immunostaining of Cre (red), orexin (green), and DAPI (blue) in brain slices showed an overlapping expression of Cre and orexin in only orexin-Cre mice but not wildtype (WT) mice. (C,D) To express opsin in orexin neurons, orexin-Cre or WT mice received injections of AAV5-DIO-ChrimsonR-tdT into the LHA (C) and AAVretro-DIO-ChR2-mCherry into the LC (D), and the brain slices were stained for mCherry (red), orexin (green), and DAPI (blue). The result showed expression of ChrimsonR-tdT and ChR2-mCherry in orexin neurons in orexin-Cre mouse but not WT mouse. (E) Quantitative analysis showed 92.87 ± 0.6974% (n = 5) colocalization of Cre recombinase with orexin in no-injection group, 93.7 ± 2.456% (n = 5) colocalization of tdTomato with orexin in AAV5 group, and 90.07 ± 1.593 % (n = 5) colocalization of mCherry with orexin in AAVretro group. (F) To compare the expression levels from different AAV serotypes, expressions in hypothalamus from saline, AAV5-DIO-ChrimsonR-tdT, and AAVretro-DIO-ChR2-mCherry injections in the WT or orexin-Cre mice are shown. AHN, anterior hypothalamus nucleus; BF, basal forebrain; LC, locus coeruleus; LHA, lateral hypothalamus area; LHb, lateral habenula; LS, lateral septum; PAG, periaqueductal gray; PVT, paraventricular nucleus of the thalamus; PRN, pontine reticular nucleus, TMN, tuberomammillary nucleus.
FIGURE 2
FIGURE 2
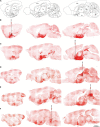
The topography of orexin projections. Orexin-Cre mice were injected with AAV5-DIO-ChrimsonR-tdT into LHA. (A–D) Representative confocal images from lateral to medial showing the orexin projections in sagittal planes. (E,F) Schematic drawings of lateral (E), hypothalamic, rostral, and caudal (F) projections of orexin neurons. (G) Two hemispheres of mouse brain underwent tissue clearing for 1 week (left) and 3 weeks (right). (H–K) Orexin projections revealed by the lightsheet microscope. The images were chosen at particular angles to show certain interesting projection features. AAA, anterior amygdalar area; ACB, nucleus accumbens; AMY, amygdala; BST, bed nuclei of the stria terminalis; CB, cerebellum; CEA, central amygdalar nucleus; CP, caudoputamen; CS, superior central nucleus raphe; CTX, cerebral cortex; DR, dorsal nucleus raphe; fr, fasciculus retroflexus; GRN, gigantocellular reticular nucleus; HPF, hippocampal formation; HY, hypothalamus; IC, inferior colliculus; IPN, interpeduncular nucleus; LHb, lateral habenula; LS, lateral septal nucleus; MARN, magnocellular reticular nucleus; MB, midbrain; MEA, medial amygdalar nucleus; MM, medial mammillary nucleus; MPO, medial preoptic area; MRN, midbrain reticular nucleus; MY, medulla; NDB, diagonal band; NLOT, nucleus of the lateral olfactory tract; OLF, olfactory areas; opt, optic tract; P, pons; PAG, periaqueductal gray; PCG, pontine central gray; PH, posterior hypothalamic nucleus; PRN, pontine reticular nucleus; RM, nucleus raphe magnus; RO, nucleus raphe obscurus; SC, superior colliculus; SI, substantia innominata; sm, stria medullaris; SN, substantia nigra; st, stria terminalis; SUM, supramammillary nucleus; TH, thalamus; V3, third ventricle; VTA, ventral tegmental area; ZI, zona incerta.
FIGURE 3
FIGURE 3
Orexin projections in coronal planes. Orexin-Cre mice were injected with AAV5-DIO-ChrimsonR-tdT into LHA. (A) Schematic diagram showing the anterior-posterior positions of the coronal brain slices. (B–K) Representative confocal images showing the orexin projections in coronal planes. Scale bars: 500 μm. AAA, anterior amygdalar area; act, anterior commissure, temporal limb; AHN, anterior hypothalamic nucleus; ACB, nucleus accumbens; AQ, cerebral aqueduct; B, barrington’s nucleus; BLA, basolateral amygdalar nucleus; BMA, basomedial amygdalar nucleus; BST, bed nuclei of the stria terminalis; CB, cerebellum; CEA, central amygdalar nucleus; COA, cortical amygdalar area; COAa, cortical amygdalar area, anterior part; CP, caudoputamen; cpd, cerebal peduncle; CTX, cerebral cortex; DMH, dorsomedial nucleus of the hypothalamus; DTN, dorsal tegmental nucleus; fi, fimbria; fr, fasciculus retroflexus; fx, columns of the fornix; FS, fundus of striatum; GPe, globus pallidus, external segment; GPi, globus pallidus, internal segment; HPF, hippocampal formation; HY, hypothalamus; int, internal capsule; IC, inferior colliculus; IPN, interpeduncular nucleus; KF, Koelliker-Fuse subnucleus; LC, locus coeruleus; LDT, laterodorsal tegmental nucleus; LHA, lateral hypothalamic area; LHb, lateral habenula; LPO, lateral preoptic area; LSc, lateral septal nucleus, caudodorsal part; LSr, lateral septal nucleus, rostroventral part; mtt, mammillothalamic tract; MA, magnocellular nucleus; MARN, magnocellular reticular nucleus; MB, midbrain; MEA, medial amygdalar nucleus; MHb, medial habenula; MM, medial mammillary nucleus; MPN, medial preoptic nucleus; MPO, medial preoptic area; MRN, midbrain reticular nucleus; MS, medial septal nucleus; MY, medulla; NI, nucleus incertus; NDB, diagonal band; NPC, nucleus of the posterior commissure; opt, optic tract; OT, olfactory tubercle; P, pons; PAG, periaqueductal gray; PB, parabrachial nucleus; PCG, pontine central gray; PF, parafascicular nucleus; PG, pontine gray; PH, posterior hypothalamic nucleus; PMd, dorsal premammillary nucleus; PMv, ventral premammillary nucleus; PPN, pedunculopontine nucleus; PRC, precommissural nucleus; PRNr, pontine reticular nucleus; PRNc, pontine reticular nucleus, caudal part; PSV, principal sensory nucleus of the trigeminal; PT, parataenial nucleus; PVT, paraventricular nucleus of the thalamus; PVH, paraventricular hypothalamic nucleus; RE, nucleus of reunions; RH, rhomboid nucleus; RN, red nucleus; RR, midbrain reticular nucleus, retrorubral area; sm, stria medullaris; st, stria terminalis; SCH, suprachiasmatic nucleus; SCm, superior colliculus, motor related; SCs, superior colliculus, sensory related; SI, substantia innominata; STN, subthalamic nucleus; SNc, substantia nigra, compact part; SNr, substantia nigra, reticular part; SUM, supramammillary nucleus; TH, thalamus; TMv, tuberomammillary nucleus, ventral part; TRN, tegmental reticular nucleus; TU, tuberal nucleus; V, motor nucleus of trigeminal; VIIn, facial nerve; VMH, ventromedial hypothalamic nucleus; VTA, ventral tegmental area; ZI, zona incerta.
FIGURE 4
FIGURE 4
Retrograde tracing Orexin fibers. Orexin-Cre mice received retrograde AAVretro-DIO-ChR2-mCherry injections at different target sites. (A) Sagittal atlas diagrams corresponding to the confocal images. (B–F) Five different injection sites including MEA (B), MPO (C), LHb (D), PAG (E), or LC (F). Scale bars: 2,000 μm. AAA, anterior amygdalar area; ACB, nucleus accumbens; BST, bed nuclei of the stria terminalis; CB, cerebellum; CEA, central amygdalar nucleus; COAa, cortical amygdalar area, anterior part; COApm, cortical amygdalar area, posterior part, medial zone; CP, caudoputamen; CTX, cerebral cortex; GP, globus pallidus; HY, hypothalamus; IC, inferior colliculus; LC, locus coeruleus; LHA, lateral hypothalamic area; LHb, lateral habenula; MB, midbrain; MEA, medial amygdalar nucleus; MPO, medial preoptic area; MY, medulla; NDB, diagonal band nucleus; P, pons; PAG, periaqueductal gray; PB, parabrachial nucleus; PH, posterior hypothalamic nucleus; PVT, paraventricular nucleus of the thalamus; TH, thalamus; SI, substantia innominata; ZI, zona incerta.
FIGURE 5
FIGURE 5
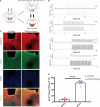
Optogenetic stimulation can reliably excite the orexin neurons expressing ChR2-mCherry. (A) Schematic diagram showing virus injection, patch-clamp recording, and optical fiber implantation. (B) Acute brain slices from mice expressing ChR2-mCherry were used for loose patch recordings. The results showed that orexin neurons expressing ChR2-mCherry can be reliably excited by blue light (473 nm) at different frequencies from 1 to 20 Hz. (C) Slices from mice expressing mCherry or ChR2-mCherry are stained for mCherry (red), cFos (green), and DAPI (blue) in lateral hypothalamus. (D) The statistical comparison of cFos staining in the mCherry group (7.9 ± 2.072, n = 5) vs. the ChR2-mCherry group (62.86 ± 3.923, n = 5), showed the optogenetic stimulation significantly increase the cFos expression in orexin neurons. All data are expressed as mean ± SEM. Significance was analyzed using unpaired t-test between two groups. ****P < 0.0001.
FIGURE 6
FIGURE 6
Optogenetic activation of orexin neurons facilitated arousal and pain tolerance. (A) Arousal test under 0.75% isoflurane. (B) Optogenetic stimulation elicited early arousal, while under 0.75% isoflurane, for the ChR2-mCherry group (9.429 ± 3.804, n = 7) but not the mCherry group (238.2 ± 17.42, n = 6). (C) EEG/EMG traces during wakefulness or under 0.75% isoflurane. Heat map showed the EEG spectra before, during and after optogenetic stimulation. (D) Emergence test after 2% isoflurane for 30 min. (E) Optogenetic stimulation significantly shortened the emergence time, for the ChR2-mCherry group (no light vs. 20 Hz, 237.2 ± 19.26 vs. 109.5 ± 13.59, n = 6) but not the mCherry group (no light vs. 20 Hz, 219.2 ± 24.15 vs. 213.8 ± 21.77, n = 6). Without stimulation, the ChR2-mCherry group has similar emergence time to the mCherry group. (F) Hotplate test. (G) Optogenetic stimulation increased the withdrawal latency to 55°C hotplate for the ChR2-mCherry group (no light vs. 20 Hz, 8.133 ± 0.5846 vs. 11.45 ± 1.185, n = 6) but not the mCherry group (no light vs. 20 Hz, 9.117 ± 0.663 vs. 8.767 ± 0.7775, n = 6). Without stimulation, the ChR2-mCherry group has similar withdrawal latency to the mCherry group. All data are expressed as mean ± S.E.M. Significance was analyzed using paired t-test within the same group of animals, and unpaired t-test between different groups. *P < 0.05, **P < 0.01, ****P < 0.0001.

Similar articles

Cited by

References

    1. Abbott R. D., Ross G. W., White L. R., Tanner C. M., Masaki K. H., Nelson J. S., et al. (2005). Excessive daytime sleepiness and subsequent development of Parkinson disease. Neurology 65 1442–1446. 10.1212/01.wnl.0000183056.89590.0d - DOI - PubMed
    1. Arnulf I., Bonnet A.-M., Damier P., Bejjani B.-P., Seilhean D., Derenne J.-P., et al. (2000). Hallucinations, REM sleep, and Parkinson’s disease: a medical hypothesis. Neurology 55 281–288. 10.1212/WNL.55.2.281 - DOI - PubMed
    1. Barr J. L., Zhao P., Brailoiu G. C., Brailoiu E. (2021). Choline-sigma-1R as an additional mechanism for potentiation of orexin by cocaine. Int. J. Mol. Sci. 22:5160. 10.3390/ijms22105160 - DOI - PMC - PubMed
    1. Belanger-Willoughby N., Linehan V., Hirasawa M. (2016). Thermosensing mechanisms and their impairment by high-fat diet in orexin neurons. Neuroscience 324 82–91. 10.1016/j.neuroscience.2016.03.003 - DOI - PubMed
    1. Bulbul M., Babygirija R., Ludwig K., Takahashi T. (2010). Central orexin-A increases gastric motility in rats. Peptides 31 2118–2122. 10.1016/j.peptides.2010.07.014 - DOI - PubMed